
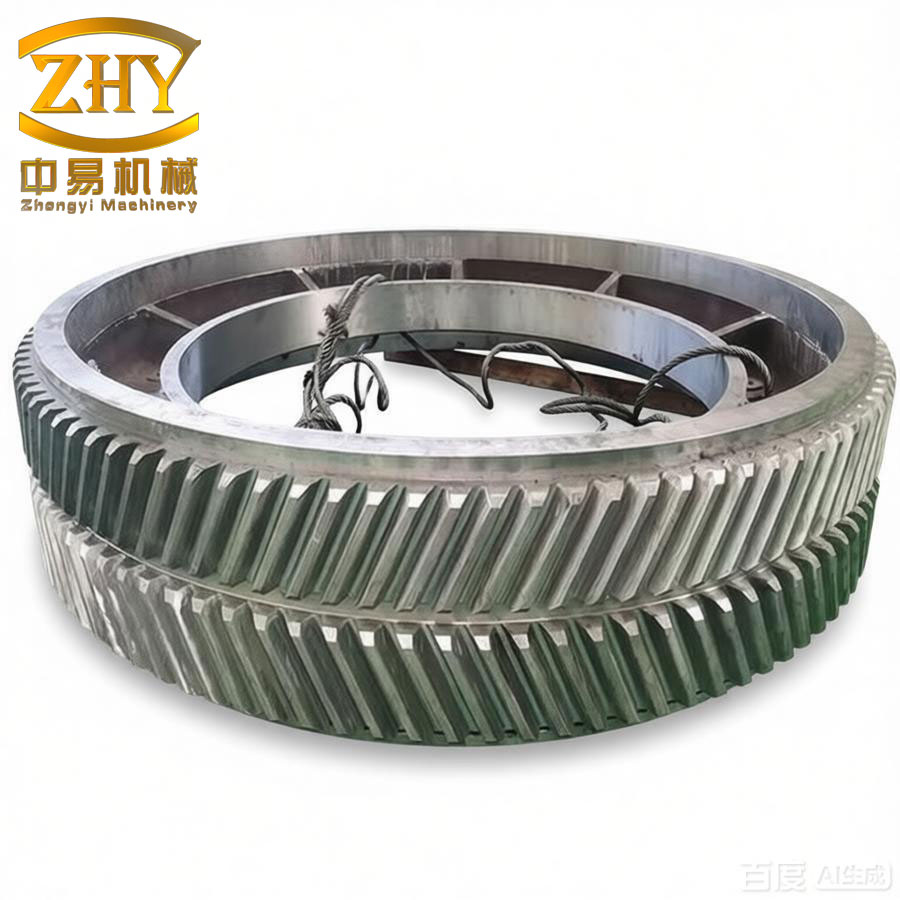
In this work, I focus on the influence of manufacturing-induced symmetry error on the meshing performance of herringbone gear pairs. Herringbone gears are widely used in high-speed and heavy-load transmissions because of their high load capacity and balanced axial forces. However, the left and right helical halves are machined separately, so a certain degree of asymmetry inevitably arises. This asymmetry is quantified by the so-called symmetry error, which is unique to herringbone gears. My research establishes analytical models to simulate the gear tooth contact and loaded behavior under such errors. I systematically investigate how different levels of symmetry error affect the contact pattern, transmission error, load distribution, and mesh stiffness. I also propose an error compensation method based on axial modification. Experimental tests on a real herringbone gear pair are carried out to verify the theoretical and numerical results.
To begin with, I derive the tooth surface equation of a helical gear using the generation process with a rack cutter. The rack cutter profile is assumed to be parabolic with a very small modification coefficient, which converts the line contact into point contact for the ease of tooth contact analysis. The position vector and unit normal vector of the rack cutter surface can be expressed in the cutter coordinate system as
$$ \mathbf{r}_{ai} = \begin{bmatrix} u_i \\ a_i u_i^2 + l_i \\ 0 \\ 1 \end{bmatrix}, \quad \mathbf{n}_{ai} = \frac{1}{\sqrt{1 + 4 a_i^2 u_i^2}} \begin{bmatrix} -2 a_i u_i \\ 1 \\ 0 \end{bmatrix}, $$
where \(u_i\) and \(l_i\) are the surface parameters, and \(a_i\) is the parabolic modification coefficient. The subscript \(i=1,2\) denotes the pinion and gear, respectively. Through coordinate transformations, the cutter surface is transformed into the gear reference frame. The meshing equation during generation is given by the condition that the relative velocity is perpendicular to the common normal:
$$ f(u_i, l_i, \theta_i) = \mathbf{n}_{ti} \cdot \mathbf{V}^{(i)}_{ti} = 0. $$
After solving the meshing equation, I obtain the generated tooth surface \(\mathbf{r}_i(u_i,\theta_i)\) and its normal \(\mathbf{n}_i(u_i,\theta_i)\). For a standard herringbone gear pair, the left and right helical gear pairs are assembled with a common pinion. The tooth contact analysis model is established in a fixed reference frame attached to the gear housing. The two tooth surfaces must be in continuous tangency, which yields the following system of equations:
$$ \mathbf{r}^{(1)}_f(u_1,\theta_1,\varphi_1) = \mathbf{r}^{(2)}_f(u_2,\theta_2,\varphi_2), \quad \mathbf{n}^{(1)}_f(u_1,\theta_1,\varphi_1) = \mathbf{n}^{(2)}_f(u_2,\theta_2,\varphi_2). $$
Here \(\varphi_1\) and \(\varphi_2\) are the rotation angles of the pinion and gear. Since \(| \mathbf{n}^{(1)}_f | = | \mathbf{n}^{(2)}_f | = 1\), only five scalar equations are independent. Taking \(\varphi_1\) as the input, the remaining five unknowns are solved at each meshing instant. For the herringbone gear, the contact patterns on the left and right flanks are computed separately. The geometric transmission error is defined as
$$ \delta \varphi_2 = \varphi_2 – \varphi^{(0)}_2 – \frac{Z_1}{Z_2} (\varphi_1 – \varphi^{(0)}_1), $$
where \(Z_1\) and \(Z_2\) are the tooth numbers of the pinion and gear. If the left and right sides have different phase errors, I introduce a phase difference \(\Delta \varphi\) between the two meshing pairs.
For the loaded tooth contact analysis, I consider the elastic deformation of the contacting teeth. The initial separations between the left and right flanks are determined from the geometric transmission error and the normal clearances. The normal flexibility matrix is obtained by applying unit normal loads on the discretized grid points over the tooth surface and then interpolating along the instantaneous contact lines. The loaded contact problem is governed by the displacement compatibility condition:
$$ \mathbf{F}_k \mathbf{P}_k + \mathbf{w}_k = \mathbf{Z} \, \mathbf{1} + \mathbf{d}_k, \quad k = \mathrm{I}, \mathrm{II}, \mathrm{III}, \mathrm{IV}, $$
where \(\mathbf{F}_k\) is the normal flexibility matrix, \(\mathbf{P}_k\) is the vector of normal loads at the discrete points, \(\mathbf{w}_k\) is the initial gap vector, \(\mathbf{Z}\) is the normal approach under load, and \(\mathbf{d}_k\) is the residual separation. The force balance condition requires that the sum of all normal load components equals the total applied normal load \(P\). The non-embedding condition states that
$$ p_j > 0 \Rightarrow d_j = 0, \quad p_j = 0 \Rightarrow d_j > 0. $$
For the herringbone gear pair, the left and right sides are coupled through the common pinion. Under axial floating conditions, the pinion can move axially to balance the left and right axial forces. The load balance on the left and right sides then becomes
$$ \sum_{j=1}^{n} p_{Lj} = P_L, \quad \sum_{j=1}^{n} p_{Rj} = P_R, \quad P_L + P_R = P. $$
Solving the nonlinear programming problem associated with the above equations yields the load distribution, the loaded transmission error, and the contact pressure distribution.
Symmetry error is defined based on the shape error of the herringbone gear. When the gear is cut along the pitch cylinder and the tooth spirals are unwrapped, the theoretical intersection of the left and right tooth spirals lies on the center plane. Due to manufacturing errors, the actual intersection moves away from the center plane. The distance between the actual intersection point and the center line along the direction perpendicular to the axial direction is defined as the symmetry error \(\Delta T\). To model this error in the tooth contact analysis, I rotate the right-hand pinion tooth surface by a small angle around the gear axis. The equivalent rotational angle is
$$ a = \frac{\Delta T \tan \beta}{r}, $$
where \(\beta\) is the helix angle and \(r\) is the pitch radius. The modified position vector and normal vector are
$$ \mathbf{R}_1 = \mathbf{M} \, \mathbf{r}_1, \quad \mathbf{N}_1 = \mathbf{L} \, \mathbf{n}_1, $$
with
$$ \mathbf{M} = \begin{bmatrix} \cos a & -\sin a & 0 & 0 \\ \sin a & \cos a & 0 & 0 \\ 0 & 0 & 1 & 0 \\ 0 & 0 & 0 & 1 \end{bmatrix}. $$
By substituting the modified surface equations into the TCA equations, I establish a herringbone gear tooth contact analysis model that accounts for symmetry error. In the loaded contact analysis, the initial gap vector is adjusted by adding a term related to \(\Delta T \tan \beta\). The left and right sides then possess different initial gaps, which causes an unequal load sharing between the two sides.
To validate the analytical models, I also construct a three-dimensional solid model of the herringbone gear pair with a prescribed symmetry error. The gear parameters used in this study are listed in Table 1.
| Parameter | Gear (wheel) | Pinion |
|---|---|---|
| Number of teeth | 81 | 27 |
| Normal module (mm) | 3.5 | |
| Normal pressure angle (deg) | 20 | |
| Helix angle (deg) | 30 | |
| Face width per side (mm) | 30 × 2 | |
| Relief groove width (mm) | 55 | |
| Symmetry error \(\Delta T\) (mm) | 0.01 (for main study) | |
The solid model is imported into a finite element analysis environment. The gear rims are simplified to a limited number of teeth around the meshing zone to reduce the computational effort. I use tetrahedral elements with a refined mesh size of 0.4 mm in the contact region and a global size of 1 mm elsewhere. The contact condition is defined as frictional contact with a friction coefficient of 0.2. The pinion is allowed to rotate about its axis while the gear is fully restrained. A torque of 2000 N·m is applied to the pinion. The finite element simulation gives the contact pressure distribution and the loaded transmission error. Figure 1 shows the typical herringbone gear model used in the simulation.
I compare the results from the loaded tooth contact analysis model with those from the finite element analysis for a symmetry error of 0.01 mm. The contact patterns obtained by both methods are very similar, with the contact region moving from the tooth root to the tip and having a diagonal orientation. The loaded transmission error curves for the left and right sides are shown in Table 2.
| Method | Left mean (arcsec) | Left amplitude (arcsec) | Right mean (arcsec) | Right amplitude (arcsec) |
|---|---|---|---|---|
| FEM | -4.9554 | 10.711 | -4.1588 | 9.332 |
| LTCA | -4.8008 | 8.659 | -3.9423 | 7.537 |
The differences in the mean values are around 3% for the left side and 5% for the right side, confirming the accuracy of the LTCA model. The mesh stiffness values computed from both methods are also in good agreement, as summarized in Table 3.
| Method | Left mean (N/m) | Left amplitude (N/m) | Right mean (N/m) | Right amplitude (N/m) |
|---|---|---|---|---|
| FEM | 6.52921×10⁸ | 1.25983×10⁸ | 5.33369×10⁸ | 1.20714×10⁸ |
| LTCA | 6.36742×10⁸ | 1.23340×10⁸ | 5.14924×10⁸ | 1.19111×10⁸ |
The consistency between the finite element and analytical results validates the reliability of my LTCA approach for herringbone gears with symmetry error.
Next, I investigate the influence of different symmetry error values on the meshing characteristics. I set \(\Delta T\) to 0 mm, 0.01 mm, 0.02 mm, and 0.03 mm. For each case, I perform tooth contact analysis and loaded tooth contact analysis. Table 4 lists the coordinates of the contact points on the left and right flanks for the ideal case \(\Delta T = 0\).
| Left flank X (mm) | Left flank Y (mm) | Right flank X (mm) | Right flank Y (mm) |
|---|---|---|---|
| -15.000000 | 6.333924 | 15.000000 | 6.333924 |
| -15.000000 | 5.740138 | 15.000000 | 5.740138 |
| -15.000000 | 5.049065 | 15.000000 | 5.049065 |
| -15.000000 | 4.264508 | 15.000000 | 4.264508 |
| -14.472214 | 3.500000 | 14.472214 | 3.500000 |
| -10.073984 | 3.500000 | 10.073984 | 3.500000 |
| -5.675754 | 3.500000 | 5.675754 | 3.500000 |
| -1.277525 | 3.500000 | 1.277525 | 3.500000 |
| 3.120705 | 3.500000 | -3.120705 | 3.500000 |
| 7.518935 | 3.500000 | -7.518935 | 3.500000 |
| 11.917164 | 3.500000 | -11.917164 | 3.500000 |
| 15.000000 | 3.224925 | -15.000000 | 3.224925 |
| 15.000000 | 2.251030 | -15.000000 | 2.251030 |
| 15.000000 | 1.197154 | -15.000000 | 1.197154 |
| 15.000000 | 0.067706 | -15.000000 | 0.067706 |
In the ideal case, the contact points are perfectly symmetric on the left and right flanks, and the geometric transmission error is nearly zero. When \(\Delta T = 0.01\) mm, the right flank contact points shift slightly toward the tooth root, while the left flank remains unchanged. The right-side geometric transmission error increases to about -8″. For \(\Delta T = 0.02\) mm, the shift becomes more pronounced and the right-side transmission error reaches approximately -15″. For \(\Delta T = 0.03\) mm, the right-side error grows to about -22″. These results indicate that symmetry error directly changes the contact path and introduces an additional geometric transmission error on the affected side, which can lead to vibration and noise in the transmission.
The loaded tooth contact analysis provides further insight into the load distribution between the left and right flanks. Figure 2 shows the load distribution maps for different symmetry errors. With increasing \(\Delta T\), the load gradually concentrates on the left flank, while the right flank carries less and less load. For \(\Delta T = 0.03\) mm, almost the entire load is taken by the left flank, which is a serious bias condition. The load sharing ratio between the two sides is clearly influenced by the symmetry error. Table 5 gives the average load proportion for the left flank under different errors.
| Symmetry error ΔT (mm) | Left flank average load share | Right flank average load share |
|---|---|---|
| 0 | 50% | 50% |
| 0.01 | 58% | 42% |
| 0.02 | 66% | 34% |
| 0.03 | 73% | 27% |
In addition, the loaded transmission error curves show that the left side error increases and the right side error decreases as the symmetry error grows. The mesh stiffness also decreases with increasing symmetry error. The stiffness reduction is more significant on the right side. This behavior can be explained by the unequal initial gaps: the flank with a larger gap becomes more compliant in the loaded contact, while the flank with a smaller gap carries more load but exhibits a larger deformation.
In practice, herringbone gear pinions are often mounted with a floating axial support so that the pinion can move axially to balance the left and right axial forces. I analyze this condition by allowing the common pinion to translate along its axis until the left and right total loads are equal. The tooth contact analysis under axial floating shows that the meshing pattern becomes more uniform than in the fixed condition. The load distribution between the left and right flanks becomes almost equal, but the contact pressure on each individual tooth flank still has some bias. Table 6 compares the load sharing coefficients for the fixed and floating conditions at \(\Delta T = 0.01\) mm and 2000 N·m torque.
| Support condition | Left flank coefficient | Right flank coefficient |
|---|---|---|
| Axially fixed | 0.58 | 0.42 |
| Axially floating | 0.50 | 0.50 |
Although the floating support equalizes the total load on each side, it does not eliminate the local bias on the tooth surface. The axial displacement of the pinion is a periodic function of time because the meshing conditions change as the teeth engage and disengage. The amplitude of the axial displacement increases with the symmetry error. For \(\Delta T = 0.01\) mm, the axial displacement amplitude is about 5 μm; for 0.02 mm it is about 10 μm; and for 0.03 mm it reaches about 15 μm.
To reduce the negative effects of symmetry error, I propose an error compensation method based on axial tooth surface modification. The idea is to modify the tooth surface in the longitudinal direction with different amounts on the left and right flanks. On the side where the initial gap is small (the flank carrying more load), a larger modification is applied; on the side with a larger gap, a smaller modification is applied. This compensates for the initial gap difference caused by the symmetry error. The modification curves are composed of parabolic segments at the two ends and a linear segment in the middle, as commonly used for gear crowning. By optimizing the modification parameters, I can achieve a nearly uniform load distribution between the left and right flanks.
For the case \(\Delta T = 0.01\) mm, I apply the compensation modification only to the pinion. After compensation, the contact patterns on both flanks become symmetric and the geometric transmission error on the right side is reduced. The loaded contact analysis shows that the load sharing between the left and right flanks becomes 50/50. The loaded transmission error amplitudes on both sides are also equalized. Table 7 summarizes the loaded transmission error amplitudes before and after compensation.
| Condition | Left amplitude (arcsec) | Right amplitude (arcsec) |
|---|---|---|
| Before compensation | 8.659 | 6.037 |
| After compensation | 6.280 | 6.280 |
The mesh stiffness after compensation becomes more uniform, and the overall stiffness level is restored. The compensation method effectively eliminates the bias load and improves the meshing stability of the herringbone gear pair.
To experimentally verify the analytical results, I designed and manufactured a pair of herringbone gears with the parameters given in Table 1. The actual symmetry error of the test gears was measured using a CNC gear measuring center. The measurement principle relies on the full tooth helix method. The gear is mounted on the measuring machine, and the probe traces the tooth spirals on both the left and right sides. The data are processed by least-squares fitting of the two helix lines. The intersection point of the fitted lines is then determined, and its distance from the center plane is taken as the symmetry error. In this way, I obtain a measured symmetry error of about 0.010 mm for the test pinion.
I built a test rig for the herringbone gear transmission system. The rig consists of a driving motor, a torque sensor, a gearbox containing the test gears, a coupling, and a loading motor. The driving motor provides the input speed and the loading motor applies the output torque. The torque and speed signals are acquired in real time. Two types of bearing arrangements are used to realize the axially fixed and axially floating conditions for the pinion. In the fixed case, both shafts are supported by spherical roller bearings that can carry axial loads. In the floating case, the pinion is supported by cylindrical roller bearings that permit axial motion, while the gear remains axially fixed.
For the contact pattern experiment, I coated the tooth surfaces with red lead powder and ran the system at a low speed and low load for a short time. The resulting contact patterns were recorded. When the pinion was axially fixed, the contact patterns on the left and right flanks were not symmetric, and the distribution was uneven. When the pinion was allowed to float axially, the contact patterns on both flanks became nearly symmetric. This observation matches the simulation results and confirms that the axial floating motion helps balance the left and right axial forces.
I also measured the axial displacement of the floating pinion during operation. Three displacement sensors were mounted at different positions along the pinion shaft to capture the axial vibration velocity. By integrating the velocity signals, I obtained the instantaneous axial displacement. The measured axial displacement has a periodic waveform whose frequency corresponds to the tooth meshing frequency. The amplitude is approximately 5–6 μm for the measured symmetry error of 0.01 mm and a load of 2000 N·m. The experimental result is in good agreement with the simulated value of about 5 μm. Minor differences are attributed to additional manufacturing errors and measurement uncertainties.
Through these experiments, I verified the correctness of the theoretical models and the simulation methods used in this work. The measured contact patterns and axial displacement confirm the trends predicted by the tooth contact analysis and loaded tooth contact analysis. The good correlation between simulation and experiment demonstrates that my analytical approach is suitable for predicting the meshing behavior of herringbone gears with symmetry error.
In summary, my research provides a comprehensive analysis of the influence of symmetry error on herringbone gear meshing. The main findings are as follows. First, symmetry error shifts the contact pattern on one flank and increases the geometric transmission error, with a magnitude proportional to the error. Second, the load becomes unevenly distributed between the left and right flanks, leading to higher loads on one side and reduced loads on the other. Third, the loaded transmission error and mesh stiffness vary significantly with symmetry error, which may deteriorate the vibrational performance of the transmission. Fourth, an axially floating pinion can balance the total load between the two sides but cannot fully correct the local bias on the tooth surface. Finally, a compensation modification along the tooth direction can effectively improve the load sharing and restore the meshing quality. These conclusions provide useful guidelines for the design, manufacturing, and measurement of high-performance herringbone gear drives.
The methods established in this work are not only applicable to the specific gear pair studied here but can also be extended to other gear types with similar asymmetric features. The combination of TCA, LTCA, finite element verification, and experimental testing builds a complete framework for evaluating the meshing performance of herringbone gears under realistic manufacturing errors. Future work could involve stochastic symmetry errors that vary from tooth to tooth, as well as dynamic analyses that include the resulting periodic excitations.