
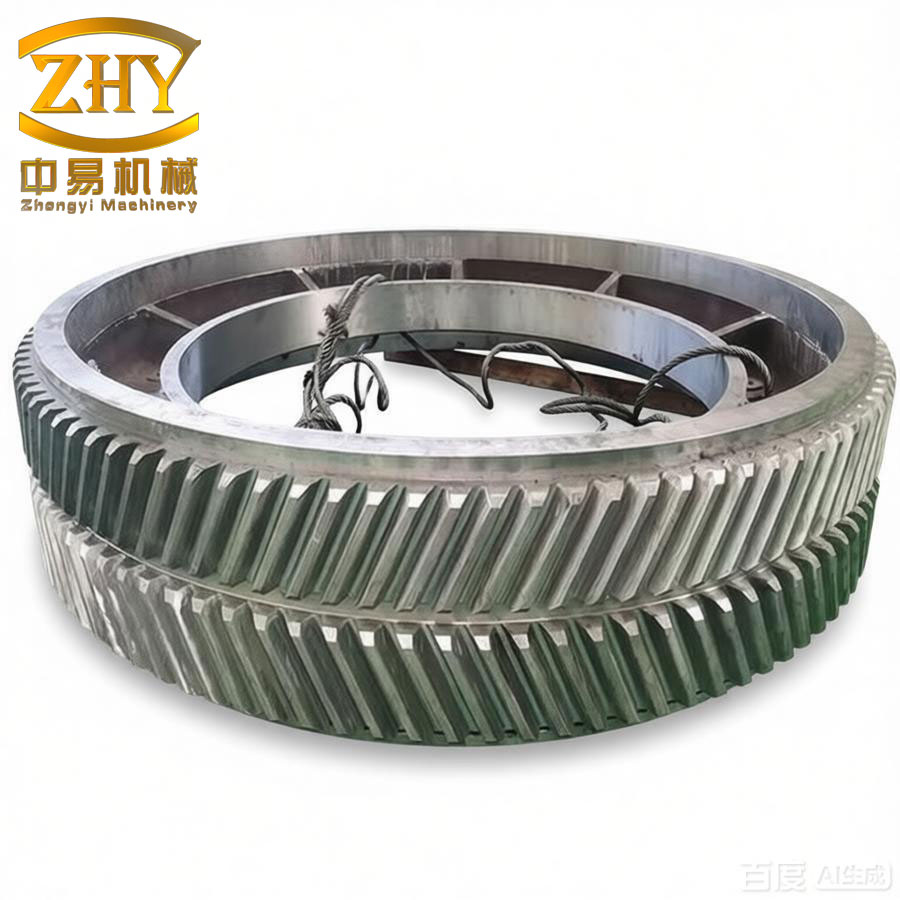
Herringbone gears are critical components in high-speed and heavy-duty transmission systems, widely applied in aerospace, marine propulsion, and energy equipment due to their high power density and exceptional transmission stability. During service, tooth surface wear remains one of the most common failure modes, directly affecting transmission efficiency, dynamic performance, and operational reliability. The wear process of herringbone gears involves multiple wear mechanisms and is influenced by strongly coupled nonlinear factors, making accurate wear prediction a challenging task. Traditional wear models based on a single wear mechanism often fail to capture the complex degradation behavior accurately. To address this issue, I investigated the tooth surface wear of herringbone gears from the perspective of irreversible process thermodynamics, aiming to establish a more comprehensive wear prediction model that unifies various wear mechanisms through the concept of entropy generation.
Irreversible Thermodynamics Framework for Wear
Wear is inherently an irreversible and dissipative process. When two contacting surfaces slide relative to each other, material removal occurs accompanied by friction, heat generation, and entropy production. Classical thermodynamics deals primarily with equilibrium states and reversible processes, which are insufficient for describing the complex non-equilibrium phenomena in tribological systems. Irreversible process thermodynamics provides a unified framework to analyze such systems by introducing the concept of entropy generation as a measure of irreversibility.
For an open thermodynamic system undergoing wear degradation, the entropy balance equation can be expressed as:
$$ \mathrm{d}S = \mathrm{d}S_e + \mathrm{d}S_i $$
where the total entropy change dS consists of the entropy exchange with the surroundings dSe and the entropy generated inside the system dSi. For irreversible processes, the entropy generation rate is always non-negative according to the second law of thermodynamics:
$$ \frac{\mathrm{d}S_i}{\mathrm{d}t} \geq 0 $$
In the friction and wear process, the primary source of entropy generation is the frictional work dissipated at the contacting asperities. The local entropy generation rate per unit volume can be formulated considering the frictional shear stress and sliding velocity:
$$ \dot{\chi} = \frac{\mu N v}{T V} $$
where μ represents the friction coefficient, N is the normal load, v is the sliding velocity, T is the absolute contact temperature, and V is the volume of the material subjected to plastic deformation. This relationship establishes a direct link between the mechanical energy dissipation and the entropy production, providing the foundation for a thermodynamic approach to wear prediction.
Bryant, Khonsari, and Ling proposed the Degradation-Entropy Generation (DEG) theorem, which states that the degradation of a material system is proportional to the entropy generated during the degradation process. According to this theorem, the wear rate can be expressed as:
$$ \dot{w}_v = B \dot{S}_i $$
where B is the degradation coefficient, a material property that characterizes the relationship between entropy generation and material loss. Combining the entropy generation rate expression, the thermodynamic wear model becomes:
$$ \dot{w}_v = B \frac{\mu N v}{T} $$
This equation reveals that the wear rate depends not only on the mechanical parameters such as load and sliding velocity but also on the friction coefficient and contact temperature, which distinguishes it from the classical Archard wear model. The degradation coefficient B must be determined experimentally for specific material pairs, similar to the wear coefficient in the Archard model.
Analysis of Herringbone Gear Meshing Characteristics
To apply the thermodynamic wear model to herringbone gears, I first performed a detailed analysis of their meshing and contact characteristics. A herringbone gear can be treated as a combination of two oppositely helixed helical gears. During meshing, the contact between the gear teeth can be equivalently modeled as the contact of two pairs of conical rollers with opposite helix directions, which provides a convenient basis for calculating contact parameters.
The contact line length of herringbone gears changes periodically during the meshing process. The calculation of contact line length depends on the relationship between the transverse contact ratio εα and the axial contact ratio εβ. When εα > εβ, the total contact line length as a function of time is:
$$ L(t) = \begin{cases} \frac{p_{bt}t}{\sin\beta_b}, & 0 \leq t \leq \varepsilon_\alpha T_m \\ \frac{b}{\cos\beta_b}, & \varepsilon_\alpha T_m < t \leq T_m \\ \frac{b}{\cos\beta_b} – \frac{p_{bt}(t – T_m)}{\sin\beta_b}, & T_m < t \leq \varepsilon_\gamma T_m \end{cases} $$
The load distribution on the tooth surface is determined based on the contact line length percentage method, where the total load is assumed to be uniformly distributed along the total contact lines. Using the Hertzian contact theory, the contact half-width and the maximum contact pressure at each meshing point are calculated as:
$$ a_h = \sqrt{\frac{4 L_F R}{\pi E^*}} $$
$$ p_{max} = \sqrt{\frac{E^* F_L}{\pi R}} $$
where LF is the load per unit length, R is the equivalent radius of curvature, and E* is the effective elastic modulus. The average contact pressure used in the wear calculation is given by:
$$ p_m = \frac{4 F_L}{3 \pi a_h} $$
For the herringbone gear pair analyzed in this study, the geometric and operating parameters are summarized in Table 1.
| Parameter | Pinion | Gear |
|---|---|---|
| Number of teeth z | 37 | 95 |
| Normal module (mm) | 15 | 15 |
| Normal pressure angle (°) | 20 | 20 |
| Single-side face width (mm) | 170 | 170 |
| Helix angle (°) | 20 | 20 |
| Input speed (r/min) | 150 | |
| Input torque (N·mm) | 800 | |
Sliding Distance and Contact Temperature Calculation
The sliding distance at each meshing point is a crucial parameter for wear analysis. By discretizing the herringbone gear into thin slices along the face width direction, each slice can be treated as a spur gear. The sliding velocities of the driving and driven gears at the meshing point are determined from the velocity analysis of gear meshing, as expressed by:
$$ \Delta v_y = v_{y1} – v_{y2} = \omega_1 \overline{N_1 M} – \omega_2 \overline{N_2 M} $$
According to the single-point observation method, the sliding distances for the pinion and gear at each meshing point are:
$$ s_p = \frac{\Delta v_y}{v_{y1}} 2a_h, \quad s_g = \frac{\Delta v_y}{v_{y2}} 2a_h $$
The contact temperature on the tooth surface is composed of the bulk temperature and the flash temperature. The flash temperature is calculated using the Tian and Kennedy model for a moving rectangular heat source on a semi-infinite body:
$$ T_f = \frac{2 q_t a_h}{\sqrt{\pi}(K_p \sqrt{1 + P_{ep}} + K_g \sqrt{1 + P_{eg}})} $$
The total heat flux qt is generated by the frictional work at the contacting interface. In mixed lubrication conditions, the heat is generated by both the shearing of the lubricant film and the direct asperity contact. The heat flux components can be approximated as:
$$ q_a = \frac{\mu_b L_a v_s p_m}{100}, \quad q_h = \frac{\Lambda_{lim}(100 – L_a) v_s p_m}{100} $$
where La is the asperity load-sharing ratio, and Λlim is the limiting shear stress coefficient of the lubricant.
Effect of Centring Error on Herringbone Gears
Centring error is an unavoidable manufacturing error for herringbone gears with a central groove. Due to asynchronous machining errors and tool wear during the manufacturing process, the two sides of the herringbone gear may not be perfectly symmetric about the central plane, causing one side to contact earlier than the other during meshing.
The presence of centring error leads to an uneven load distribution between the left and right sides of the herringbone gear. Modeling the gear teeth as a spring system, the load difference between the earlier contact side and the delayed contact side can be expressed as:
$$ \Delta F = k_h \Delta_c $$
where kh is the meshing stiffness of one side of the herringbone gear and Δc is the centring error. The tooth surface wear also modifies the effective centring error during the wear process. After wear occurs, the updated centring error becomes:
$$ \Delta_c’ = \Delta_c + h_{l1} + h_{l2} – h_{r1} – h_{r2} $$
This relationship indicates that wear depth can partially offset the effect of centring error by reducing the asymmetry between the two sides, which is an important consideration in wear evolution analysis.
Thermodynamic Wear Model for Herringbone Gears
To calculate the wear distribution on the tooth surface of herringbone gears, I discretized the meshing plane into a grid of points. The wear depth at each discrete point (m, n) is calculated based on the thermodynamic wear model:
$$ h_{m,n} = B_w \frac{\mu_{m,n} P_{m,n}}{T_{c(m,n)}} s_{m,n} $$
For mixed lubrication conditions, the asperity contact pressure and the friction coefficient of the directly contacting asperities should be used:
$$ h_{m,n} = B_w \left(\frac{L_a P}{100}\right)_{m,n} \frac{\mu_b}{T_{a(m,n)}} s_{m,n} $$
The wear calculation procedure involves iterative updates. The meshing plane of herringbone gears is illustrated in the discretized domain. After a certain number of meshing cycles ε, the contact parameters and the centring error are updated based on the accumulated wear depth. The total wear depth is obtained by accumulating the wear from each update step:
$$ h = \sum_{\xi=1}^{G} h^{(\xi)} $$
The computational flow of the wear prediction model for herringbone gears proceeds as follows: first, the initial contact parameters including sliding distance, contact pressure, and contact temperature are calculated; then, the thermodynamic wear model is applied to compute the wear depth per meshing cycle; after reaching the designated number of meshing cycles, the contact parameters are recalculated considering the updated tooth profile and the modified centring error.
Wear Test and Determination of Degradation Coefficient
To determine the wear degradation coefficient and validate the thermodynamic wear model, I conducted pin-on-disc wear tests using 45 steel as the test material. The tests were performed on an Rtec multifunctional friction and wear tester. The cylindrical pins had a length of 12 mm and a diameter of 6 mm, while the discs had a diameter of 50.8 mm and a thickness of 6.35 mm.
Three sets of wear tests were conducted to determine the degradation coefficient, as summarized in Table 2. Each test was repeated three times, and the average values were taken to minimize experimental error.
| Test | Load (N) | Speed (r/min) | Time (min) | Sliding distance (m) | Wear mass (mg) |
|---|---|---|---|---|---|
| 1 | 65 | 100 | 20 | 84 | 13.45 |
| 2 | 65 | 90 | 20 | 79 | 12.60 |
| 3 | 60 | 90 | 20 | 79 | 11.74 |
The friction coefficient during the tests increased initially and reached a stable value after approximately 2 to 3 minutes, which corresponds to the transition from the running-in stage to the steady-state wear stage. The contact temperature displayed a similar trend to the friction coefficient, as it was primarily influenced by frictional heating. The wear degradation coefficient was calculated using the following equation:
$$ B_w = \frac{\dot{m}_v \rho T}{\mu N s} $$
Based on the three sets of tests, the average wear degradation coefficient for the 45 steel pin-on-disc pair was determined to be approximately:
$$ B_w = 3.02 \times 10^{-10} \, \mathrm{m^2 \cdot K/J} $$
To validate the obtained degradation coefficient, twelve additional wear tests were conducted. The first six tests were performed at a constant speed of 70 r/min with loads ranging from 50 N to 100 N in 10 N increments. The next six tests were performed at a constant load of 70 N with speeds ranging from 50 to 100 r/min in 10 r/min increments. The comparison between the thermodynamic wear model predictions, Archard model predictions, and experimental results is shown in Table 3.
| Load (N) | Speed (r/min) | Experimental wear (mg) | Thermodynamic model (mg) | Archard model (mg) |
|---|---|---|---|---|
| 50 | 70 | 8.41 | 6.20 | 6.38 |
| 60 | 70 | 10.17 | 7.87 | 8.12 |
| 70 | 70 | 12.44 | 9.72 | 10.05 |
| 80 | 70 | 15.02 | 11.63 | 12.04 |
| 70 | 50 | 13.86 | 10.89 | 11.23 |
| 70 | 60 | 13.12 | 10.34 | 10.68 |
| 70 | 80 | 11.78 | 9.18 | 9.51 |
| 70 | 90 | 11.15 | 8.73 | 9.06 |
The experimental wear mass exceeded the model predictions because the experimental measurements include the running-in stage wear, while both models calculate the steady-state wear. Nevertheless, both models provided reasonable predictions for constant load and constant speed conditions. The analysis of the wear rate as a function of entropy generation rate revealed a strong linear correlation, confirming the fundamental relationship between wear degradation and irreversible entropy production.
Variable Load and Speed Test Validation
In practical applications, gears often operate under varying loads and speeds. To validate the thermodynamic wear model under such conditions, I designed tests with different load sequences at a constant speed of 100 r/min, as shown in Table 4.
| Test | Load sequence (N) | Speed (r/min) | Duration (min) |
|---|---|---|---|
| 1 | 60 → 70 → 80 | 100 | 14 |
| 2 | 80 → 70 → 60 | 100 | 14 |
| 3 | 80 → 60 → 70 | 100 | 14 |
| 4 | 70 → 80 → 60 | 100 | 14 |
During the variable load tests, the friction force changed with the load, while the contact temperature showed a gradual increase. The wear prediction results for the variable load sequences are summarized in Table 5.
| Test | Experimental wear (mg) | Thermodynamic model (mg) | Archard model (mg) |
|---|---|---|---|
| 1 | 13.26 | 10.92 | 11.47 |
| 2 | 12.18 | 10.28 | 10.71 |
| 3 | 12.11 | 9.87 | 10.28 |
| 4 | 11.74 | 9.65 | 10.06 |
Two additional tests were conducted with different speed sequences at a constant load of 70 N. The results are presented in Table 6.
| Test | Speed sequence (r/min) | Experimental wear (mg) | Thermodynamic model (mg) | Archard model (mg) |
|---|---|---|---|---|
| 1 | 80 → 100 → 120 | 12.91 | 10.25 | 10.87 |
| 2 | 120 → 100 → 80 | 12.06 | 9.83 | 9.86 |
The results demonstrate that the thermodynamic wear model provides more accurate predictions under variable load and variable speed conditions compared to the Archard model. This improvement is attributed to the fact that the thermodynamic model explicitly includes the effects of friction coefficient and contact temperature, which vary significantly when load and speed change. The Archard model tends to overestimate the wear under variable conditions because it does not account for these variations.
Analysis of Wear on Herringbone Gears with Centring Error
Based on the validated thermodynamic wear model, I proceeded to analyze the tooth surface wear of herringbone gears with centring error. The contact parameters under different centring errors were first computed and analyzed.
The average contact pressure distribution showed that the maximum average contact pressure occurs at the mesh-in point, with higher values also at the mesh-out area. Under the influence of centring error, the earlier contact side experienced higher contact pressures than the delayed contact side. With increasing centring error from 0 to 18 μm, the pressure difference between the two sides increased correspondingly.
In mixed lubrication conditions, the contact pressure is shared between the lubricant film and the surface asperities. The asperity contact pressure, which directly governs the wear behavior, showed a nonlinear decreasing trend along the line of action, with the maximum value at the mesh-in point. Similar to the average contact pressure, the asperity contact pressure of the earlier contact side was higher than that of the delayed contact side.
The contact temperature distribution along the line of action exhibited its maximum at the mesh-in point. The temperature decreased gradually from the mesh-in point toward the pitch point, reaching the minimum at the pitch point, and then increased again toward the mesh-out point. With increasing centring error, the temperature difference between the two sides of the herringbone gear increased, potentially adversely affecting the lubrication condition and accelerating the wear process.
The sliding distance of the driving gear tooth surface, calculated using the single-point observation method, was found to be maximum at the mesh-in point and minimum at the pitch point. The earlier contact side showed a greater sliding distance than the delayed contact side, with the difference increasing as the centring error increased. This is because the higher contact pressure on the earlier contact side results in a larger Hertzian contact half-width, thereby increasing the sliding distance at each meshing point.
Wear Distribution under Different Lubrication Conditions
The wear distribution of herringbone gears was calculated under both dry friction and mixed lubrication conditions. Under dry friction conditions after 104 meshing cycles, the wear distribution on both the driving and driven gears showed that the minimum wear occurs at the pitch point. The wear amount increased from the pitch point toward both the mesh-in and mesh-out points. For the driving gear, the maximum wear was located at the mesh-in point (tooth root), while for the driven gear, the maximum wear was at the mesh-out point (tooth root). Since the gear ratio exceeds unity, the driving gear meshes more frequently and consequently exhibits higher overall wear.
For mixed lubrication conditions, the wear pattern was similar, but with some distinctive characteristics. The wear amount decreased nonlinearly from the mesh-in point along the line of action, and the wear at the pitch point was no longer the minimum. This nonlinear behavior arises from the combined effects of varying oil film thickness, asperity contact ratio, contact temperature, and sliding distance along the meshing path.
A comparison between the thermodynamic wear model and the Archard model for the herringbone gear tooth surface wear is presented in Table 7. The comparison was performed at three cross-sections of one side of the gear.
| Section | Condition | Thermodynamic model (×10⁻⁶ mm) | Archard model (×10⁻⁶ mm) |
|---|---|---|---|
| Front section | Dry friction | 1.75 | 1.92 |
| Middle section | Dry friction | 1.58 | 1.74 |
| Rear section | Dry friction | 1.42 | 1.57 |
| Front section | Mixed lubrication | 6.41 | 7.20 |
| Middle section | Mixed lubrication | 5.86 | 6.58 |
| Rear section | Mixed lubrication | 5.32 | 5.96 |
The wear distribution patterns obtained from the two models are nearly identical, with the thermodynamic model consistently predicting slightly lower values than the Archard model. This is consistent with the experimental observations from the pin-on-disc tests.
Influence of Centring Error on Wear Distribution
The wear distribution of the driving gear with different centring errors was calculated to analyze the influence of centring error on the wear behavior of herringbone gears. Table 8 summarizes the maximum wear depth of the earlier contact side and the delayed contact side for different centring errors.
| Centring error (μm) | Earlier contact side (×10⁻⁶ mm) | Delayed contact side (×10⁻⁶ mm) |
|---|---|---|
| 0 | 6.41 | 6.41 |
| 6 | 7.26 | 5.57 |
| 12 | 8.13 | 4.72 |
| 18 | 9.02 | 3.85 |
The earlier contact side exhibited a significantly higher wear amount compared to the delayed contact side. The difference in wear between the two sides was most pronounced at the mesh-in point and increased with increasing centring error. This is because the centring error causes the contact pressure, contact temperature, and sliding distance on the earlier contact side to be higher than those on the delayed contact side, all of which contribute to accelerated wear.
Parametric Analysis of Wear in Herringbone Gears
To understand how different parameters affect the wear behavior of herringbone gears, I conducted a parametric analysis considering surface roughness, torque, and rotational speed. The analysis was performed on the driving gear with a centring error of 12 μm, and the wear amount after 104 meshing cycles was calculated.
The effect of surface roughness on wear was investigated by setting three roughness values: 0.2 μm, 0.5 μm, and 0.8 μm. The wear results are summarized in Table 9.
| Roughness (μm) | Earlier contact side (×10⁻⁶ mm) | Delayed contact side (×10⁻⁶ mm) |
|---|---|---|
| 0.2 | 0.72 | 0.41 |
| 0.5 | 8.13 | 4.72 |
| 0.8 | 18.36 | 10.51 |
Surface roughness had a substantial influence on the wear of herringbone gears. When the roughness was 0.2 μm, the wear amount was very small because the oil film could effectively separate most of the contacting asperities, reducing the asperity contact ratio. Increasing the roughness led to a lower film thickness ratio, which increased the number of asperities in direct contact and significantly accelerated the wear process.
The effect of input torque on wear was analyzed with torque values ranging from 200 to 800 N·mm. The results are presented in Table 10.
| Torque (N·mm) | Earlier contact side (×10⁻⁶ mm) | Delayed contact side (×10⁻⁶ mm) |
|---|---|---|
| 200 | 2.03 | 1.18 |
| 400 | 4.06 | 2.36 |
| 800 | 8.13 | 4.72 |
Increasing the input torque increased the wear amount and also enlarged the difference between the earlier contact side and the delayed contact side. The torque increase raises the contact pressure and the asperity contact pressure, and enlarges the contact half-width, resulting in a greater sliding distance, all of which contribute to higher wear.
The rotational speed effect was analyzed at speeds of 100, 300, and 500 r/min, as summarized in Table 11.
| Speed (r/min) | Earlier contact side (×10⁻⁶ mm) | Delayed contact side (×10⁻⁶ mm) |
|---|---|---|
| 100 | 8.13 | 4.72 |
| 300 | 7.04 | 4.16 |
| 500 | 6.02 | 3.61 |
Interestingly, the wear amount decreased with increasing rotational speed. This is because at higher speeds, the lubricant molecules adsorbed on the tooth surfaces do not have sufficient time to desorb or be squeezed out, which favors the formation of a thicker oil film and reduces the probability of direct asperity contact. However, it should be noted that excessively high speeds can cause a sharp rise in the flash temperature, which could rupture the oil film and lead to accelerated wear or even scuffing—a condition that falls outside the applicable range of the current model.
Wear Evolution Process of Herringbone Gears
To reveal the interaction between wear depth and contact parameters during the wear process, I simulated the wear evolution of herringbone gears with a centring error of 12 μm under both dry friction and mixed lubrication conditions. The meshing cycles were divided into update steps, and the contact parameters were recalculated after each step based on the accumulated wear depth and the modified centring error.
Under dry friction conditions, the meshing cycles per update step were set to 3×10², and the wear amounts were computed over three update steps. The evolution of wear at the rear section of the driving gear is presented in Table 12.
| Update step | Earlier contact side (×10⁻⁶ mm) | Delayed contact side (×10⁻⁶ mm) |
|---|---|---|
| 1 | 0.42 | 0.20 |
| 2 | 0.36 | 0.27 |
| 3 | 0.31 | 0.31 |
From the first update step to the second update step, the wear rate of the earlier contact side decreased significantly in the regions from the mesh-in point to the pitch point and from the pitch point to the mesh-out point, while the wear rate of the delayed contact side increased in the same regions. This is because the higher wear on the earlier contact side increased the backlash more than on the delayed contact side, causing the two sides to become increasingly symmetric. By the third update step, the accumulated wear difference between the two sides approached the centring error value, and the two sides contacted almost simultaneously, resulting in nearly identical wear rates.
Under mixed lubrication conditions, the meshing cycles per update step were increased to 3×10⁷ due to the significantly lower wear rates. The wear evolution and the corresponding changes in asperity contact pressure over three update steps are summarized in Tables 13 and 14.
| Update step | Earlier contact side (×10⁻⁶ mm) | Delayed contact side (×10⁻⁶ mm) |
|---|---|---|
| 1 | 8.13 | 4.72 |
| 2 | 6.97 | 6.13 |
| 3 | 6.45 | 6.45 |
| Update step | Earlier contact side (MPa) | Delayed contact side (MPa) |
|---|---|---|
| 1 | 625 | 372 |
| 2 | 548 | 478 |
| 3 | 510 | 510 |
The wear evolution under mixed lubrication followed a similar pattern to that observed under dry friction. The asperity contact pressure on the earlier contact side decreased while that on the delayed contact side increased, with both sides converging toward the same value as the wear process progressed. Near the pitch point, where the sliding distance and wear amount were minimal, the contact pressure and wear rate remained almost unchanged. These findings demonstrate that tooth surface wear in herringbone gears can partially offset the adverse effects of centring error by gradually equalizing the contact conditions of the left and right sides.
Conclusions
In this research, I established a thermodynamic wear model for herringbone gears based on irreversible process thermodynamics and the Degradation-Entropy Generation theorem, and validated its effectiveness through pin-on-disc wear tests and numerical comparisons with the classical Archard model. The main conclusions can be summarized as follows:
(1) The thermodynamic wear model provides accurate wear predictions for friction pairs. Compared with the Archard wear model, the thermodynamic model yields predictions that are closer to experimental results under variable load and variable speed conditions. Since the actual operating conditions of herringbone gears often involve fluctuations in load and speed, the thermodynamic wear model is more suitable for wear calculation of herringbone gears.
(2) Under dry friction conditions, the wear amount of the herringbone gear pair is larger at the mesh-in and mesh-out points, with the minimum wear at the pitch point. The wear increases from the pitch point toward both the mesh-in and mesh-out points along the line of action. The wear distribution along the face width is non-uniform, decreasing from the front section to the rear section. Under mixed lubrication conditions, the maximum wear occurs at the mesh-in point, with a nonlinear decreasing trend along the line of action.
(3) Surface roughness, input torque, and rotational speed significantly influence the wear of herringbone gears in mixed lubrication. The wear amount increases with increasing surface roughness and torque but decreases with increasing speed within a certain range.
(4) Centring error causes asynchronous contact between the left and right sides of herringbone gears. The earlier contact side exhibits higher contact pressure, contact temperature, relative sliding distance, and wear amount compared to the delayed contact side. The differences increase with increasing centring error. During the wear evolution of herringbone gears with centring error, the wear rate at the mesh-in region of the earlier contact side gradually decreases while that of the delayed contact side increases. As the wear progresses, the wear rates and contact pressures near the mesh-in point of both sides tend to converge, indicating that tooth surface wear can partially compensate for the adverse effects of centring error.