
In the field of modern equipment manufacturing, gear transmissions serve as the core power transmission components in a wide range of mechanical systems, including aerospace, marine propulsion, energy generation, and heavy industrial machinery. Among the various types of gears, the herringbone gear is widely recognized for its exceptional load-carrying capacity, smooth meshing behavior, and negligible axial thrust. These attributes make herringbone gears particularly suitable for high-speed and heavy-duty applications. However, the herringbone gear also faces significant challenges related to tooth surface wear, which directly influences transmission efficiency, operational stability, and service life. Tooth surface wear is a complex phenomenon involving multiple interacting mechanisms such as adhesive wear, abrasive wear, fatigue wear, and tribochemical reactions. The complexity of these mechanisms, combined with the influence of variable working conditions and geometric errors, makes accurate wear prediction extremely challenging.
Traditional wear models, most notably the Archard wear model, have been widely employed in gear wear simulations. While these models are simple and computationally efficient, they are often limited by their reliance on a single wear mechanism and their inability to account for the simultaneous effects of temperature, friction, and material degradation. In contrast, irreversible process thermodynamics provides a unified framework for describing the energy dissipation and entropy generation associated with wear processes. By linking wear progression to entropy production, it becomes possible to develop a more robust wear model that captures the combined effects of multiple degradation mechanisms. In this study, I adopt the principles of irreversible process thermodynamics to investigate the tooth surface wear behavior of herringbone gears, with particular attention to the influence of centering errors and mixed lubrication conditions.
1. Introduction and Background
Gear tooth wear is recognized as one of the most important factors limiting the reliability and durability of gear transmission systems. In practice, herringbone gears often operate under boundary or mixed lubrication conditions, where direct metal-to-metal contact occurs between the interacting tooth surfaces. This contact, combined with relative sliding motion, inevitably leads to material removal and surface degradation. The consequences of tooth wear include altered tooth profiles, increased backlash, amplified vibration levels, and accelerated fatigue failure. Therefore, the ability to accurately predict tooth wear is essential for the design, condition monitoring, and maintenance of herringbone gear systems.
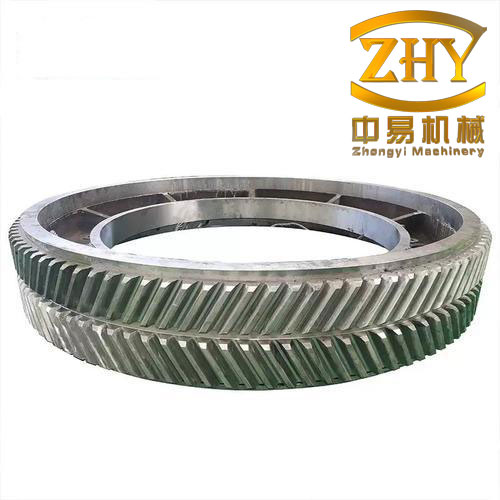
The herringbone gear can be considered as a combination of two opposite-handed helical gears joined together. During meshing, the contact lines on the left and right sides of the gear move across the meshing plane, resulting in a continuously varying total contact line length. This unique geometry gives the herringbone gear its characteristic smooth and silent operation. However, it also introduces manufacturing complexities, particularly regarding the centering of the two helical halves. Centering errors, which are small deviations from perfect symmetry, can arise due to machining tolerances, tool wear, and assembly inaccuracies. These errors cause one side of the gear to come into contact earlier than the other, thereby altering the load distribution and contact characteristics between the two sides.
Despite its practical importance, the influence of centering errors on the wear behavior of herringbone gears has not been thoroughly investigated. Moreover, the application of irreversible process thermodynamics to gear wear prediction remains relatively unexplored. This study aims to bridge these gaps by developing a comprehensive wear model for herringbone gears based on thermodynamic principles. The specific objectives of this research are as follows:
- To establish the theoretical relationship between irreversible entropy generation and wear progression during gear meshing.
- To develop a computational framework for predicting tooth surface wear distribution on herringbone gears, considering variable contact pressure, sliding distance, and contact temperature.
- To incorporate the effects of centering errors on load distribution and wear evolution.
- To experimentally validate the proposed thermodynamic wear model using pin-on-disk tribometer tests and compare its performance with the traditional Archard wear model.
- To analyze the influence of key parameters, including surface roughness, rotational speed, and torque, on the wear behavior of herringbone gears.
2. Fundamentals of Irreversible Process Thermodynamics
Irreversible process thermodynamics offers a powerful framework for understanding the energy transformations that occur during friction and wear. Unlike classical thermodynamics, which is limited to equilibrium states, irreversible thermodynamics deals with systems that are continuously driven away from equilibrium by dissipative processes. In the context of tribology, the frictional work performed at the contacting interface is partially converted into heat, which flows into the surrounding material, and partially consumed by the formation of new surfaces and debris. These processes are inherently irreversible and are accompanied by a net increase in entropy.
For a tribological system, the local entropy balance can be expressed as:
$$\rho \frac{ds}{dt} = -\nabla \cdot \mathbf{J}_s + \dot{\chi}$$ … (1)
where ρ is the density, s is the specific entropy, Js is the entropy flux vector, and χ̇ is the entropy generation rate per unit volume. According to the second law of thermodynamics, the entropy generation rate must be non-negative for any real process:
$$\dot{\chi} \geq 0$$ … (2)
In the case of dry sliding friction, the dominant source of entropy generation is the frictional work dissipated as heat. For a sliding contact under a normal load N with a friction coefficient μ and relative sliding velocity v, the entropy generation rate can be approximated by:
$$\dot{\chi} \approx \frac{\mu N v}{T}$$ … (3)
where T is the absolute contact temperature. Equation (3) establishes a direct link between the mechanical work input and the entropy produced during the wear process. This relationship is fundamental to the thermodynamic wear model presented in this work.
Bryant et al. extended this concept through the degradation-entropy generation (DEG) theorem, which states that the degradation rate of a system is proportional to the entropy generation rate associated with the dissipative processes responsible for the degradation. For wear, the volumetric wear rate ẇv can be expressed as:
$$\dot{w}_v = B \dot{S}_g$$ … (4)
where B is the degradation coefficient and Ṡg is the entropy generation rate of the wear process. Combining equations (3) and (4), the wear rate becomes:
$$\dot{w}_v = B \frac{\mu N v}{T}$$ … (5)
This formulation is particularly appealing because the degradation coefficient B is a material property that remains constant for a given tribological pair, regardless of the specific load, speed, or temperature conditions. This property makes the thermodynamic wear model exceptionally well-suited for predicting wear under variable operating conditions, as will be demonstrated experimentally in this study.
3. Development of the Thermodynamic Wear Model for Herringbone Gears
3.1 Equivalent Contact Model and Load Distribution
The herringbone gear can be modeled as a combination of two opposite-handed helical gears. At any instant during meshing, the contact can be equivalently represented as two pairs of inclined cylindrical rollers in line contact. The contact lines on the left and right sides move across their respective meshing planes, and the total contact line length varies periodically with the rotation of the gears. The calculation of the contact line length is a crucial step in determining the load distribution along the tooth surface.
For the herringbone gear used in this study, the relevant geometric and operating parameters are summarized in Table 1.
| Parameter | Pinion (driving) | Wheel (driven) |
|---|---|---|
| Number of teeth, z | 37 | 95 |
| Normal module, mn (mm) | 15 | 15 |
| Normal pressure angle, α (°) | 20 | 20 |
| Face width (one side), b (mm) | 170 | 170 |
| Helix angle, β (°) | 20 | 20 |
| Input speed (r/min) | 150 | |
| Input torque (N·mm) | 800 | |
The total contact line length Lz at any time t is obtained by summing the contributions of all tooth pairs in simultaneous contact:
$$L_z(t) = \sum_{i=1}^{N} L_i(t)$$ … (6)
where N = ceil(εγ) is the number of tooth pairs in contact and εγ is the total contact ratio. The load distribution along the tooth surface is then determined using the contact line length percentage method, which assumes that the total normal load is uniformly distributed over the total contact line length. The load carried by one side of the gear is therefore:
$$F(t) = \frac{L(t)}{L_z(t)} F_n$$ … (7)
where Fn is the total normal load and L(t) is the contact line length on one side.
3.2 Contact Pressure Calculation
Based on the Hertz contact theory, the contact between the meshing teeth can be approximated as two cylinders in line contact. The contact half-width ah and the maximum contact pressure pmax are given by:
$$a_h = \sqrt{\frac{4 F_L R^*}{\pi E^*}}$$ … (8)
$$p_{\max} = \sqrt{\frac{E^* F_L}{\pi R^*}}$$ … (9)
where FL is the load per unit length, R* is the equivalent radius of curvature, and E* is the equivalent elastic modulus. The average contact pressure pm over the contact zone is:
$$p_m = \frac{4}{3\pi} p_{\max}$$ … (10)
The average contact pressure distribution on the tooth surface of the herringbone gear was computed and found to be non-uniform along the face width. The maximum pressure occurs near the points of engagement, while the minimum pressure occurs at the pitch point.
3.3 Sliding Distance and Contact Temperature
The relative sliding between the tooth surfaces is a primary driver of wear. Using the single-point observation method, the sliding distance at a given mesh point can be determined from the tangential velocities of the pinion and wheel. For the herringbone gear, the meshing plane is discretized into a grid of M × N points. The sliding distance at mesh point (m, n) is:
$$s_{m,n} = 2 a_h \left| \frac{v_1 – v_2}{v_1} \right|$$ … (11)
where v1 and v2 are the tangential velocities of the driving and driven gear surfaces at the contact point.
The contact temperature Tc is composed of the bulk temperature Tb and the flash temperature Tf:
$$T_c = T_b + T_f$$ … (12)
For the flash temperature calculation, this study adopts the sliding rectangular heat source model proposed by Tian and Kennedy:
$$T_f = \frac{2 a_h q_t}{\sqrt{\pi} \left( K_p \sqrt{1 + P_{ep}} + K_g \sqrt{1 + P_{eg}} \right)}$$ … (13)
where qt is the average heat flux, Kp and Kg are the thermal conductivities of the pinion and wheel materials, and Pep, Peg are the Peclet numbers for the two contacting surfaces.
3.4 Effect of Centering Errors
Centering errors in herringbone gears are manufacturing deviations that cause one side of the gear to engage earlier than the other. This asymmetry leads to an unequal load distribution between the left and right side gears. In this study, the gear pair is modeled as a spring system, where the difference in contact pressure ΔF between the leading and lagging sides is proportional to the centering error Δc:
$$\Delta F = k_h \cdot \Delta c$$ … (14)
where kh is the mesh stiffness of one side of the gear. As wear progresses, the tooth profiles change, which in turn modifies the effective centering error. The updated centering error after wear is:
$$\Delta c’ = \Delta c + (h_{l1} + h_{l2}) – (h_{r1} + h_{r2})$$ … (15)
where hl1, hl2 and hr1, hr2 are the wear depths on the leading and lagging sides of the pinion and wheel, respectively. This interaction between wear and centering error is a critical factor that must be accounted for in accurate wear prediction.
3.5 Thermodynamic Wear Model Formulation
Combining the thermodynamic wear law with the previously computed contact parameters, the wear depth at mesh point (m, n) can be expressed as:
$$h_{m,n} = B_w \frac{\mu P_{m,n}}{T_{c(m,n)}} s_{m,n}$$ … (16)
where Bw is the wear degradation coefficient, μ is the coefficient of friction, Pm,n is the average contact pressure, Tc(m,n) is the contact temperature, and sm,n is the sliding distance at the mesh point. For mixed lubrication conditions, the wear model is extended by introducing the asperity load ratio La and the oil film deficit coefficient ψ:
$$h_{m,n} = B_w \frac{\mu_b P_{m,n} L_a}{T_{a(m,n)}} s_{m,n} \psi$$ … (17)
where μb is the friction coefficient of the directly contacting micro-asperities and Ta is the temperature at those contact points.
The computational procedure for the herringbone gear wear model is summarized in the flowchart shown in Figure 1. The process begins with the calculation of initial contact parameters, followed by the wear calculation for each mesh point over a specified number of meshing cycles. The wear depth is then used to update the centering error and contact parameters, and the process is repeated until the desired number of update steps is reached.
4. Experimental Validation and Determination of Wear Degradation Coefficient
4.1 Experimental Setup
To determine the wear degradation coefficient Bw and validate the thermodynamic wear model, a series of pin-on-disk experiments were conducted using 45# steel for both the pin and the disk. The tests were performed on an Rtec multifunctional tribometer. The pin specimens had a diameter of 6 mm and a length of 12 mm, while the disks had a diameter of 50.8 mm and a thickness of 6.35 mm. The material properties are listed in Table 2.
| Property | Disk | Pin |
|---|---|---|
| Material | 45# steel | 45# steel |
| Density (kg/m³) | 7800 | 7800 |
| Elastic modulus (GPa) | 206 | 206 |
| Specific heat (J/(kg·K)) | 465 | 465 |
| Thermal conductivity (W/m·K) | 51 | 51 |
| Poisson’s ratio | 0.3 | 0.3 |
Before each test, the specimens were ultrasonically cleaned and dried. The wear mass loss was measured using an electronic balance. The friction coefficient was continuously recorded by the tribometer. To estimate the contact temperature at the pin-disk interface, an analytical heat transfer model was employed.
4.2 Determination of the Wear Degradation Coefficient
Three groups of wear tests were conducted under different load and speed conditions. The test parameters and measured wear mass losses are presented in Table 3.
| Test No. | Load (N) | Speed (r/min) | Time (min) | Sliding distance (m) | Wear mass loss (mg) |
|---|---|---|---|---|---|
| 1 | 65 | 100 | 20 | 84 | 13.45 |
| 2 | 65 | 90 | 20 | 79 | 12.60 |
| 3 | 60 | 90 | 20 | 79 | 11.74 |
For each test, the friction coefficient and contact temperature were recorded. A representative evolution of the friction coefficient and contact temperature over time is shown in Figure 2. After an initial running-in period, the friction coefficient stabilizes, indicating the onset of steady-state wear. The wear degradation coefficient was then calculated as:
$$B_w = \frac{\rho \cdot V_m}{\mu \cdot N \cdot s / T_c}$$ … (18)
where Vm is the wear volume and ρ is the material density. The calculated degradation coefficients for the three tests were found to be nearly identical, confirming that Bw is a material property. The average value obtained was Bw = 3.02 × 10⁻¹⁰ m²·K/J.
4.3 Validation Under Variable Loading and Speed Conditions
To further validate the thermodynamic wear model, additional experiments were conducted under variable load and variable speed sequences. Four load sequence groups and two speed sequence groups were designed. The experimental results were compared with predictions from both the Archard wear model and the thermodynamic wear model. The comparison is illustrated in Figure 3.
The results demonstrate that the thermodynamic wear model outperforms the Archard model under variable load and variable speed conditions. The Archard model tends to overestimate the wear mass loss in some cases, as it does not account for variations in friction coefficient and contact temperature. In contrast, the thermodynamic wear model inherently includes these effects through the entropy generation term, allowing it to more accurately track the actual wear progression.
Furthermore, a strong linear correlation was observed between the wear rate and the entropy generation rate across all tested conditions. This finding reinforces the fundamental validity of the thermodynamic approach to wear prediction.
5. Wear Characteristics of Herringbone Gears Based on Thermodynamic Analysis
5.1 Influence of Centering Errors on Contact Parameters
Centering errors in the herringbone gear lead to non-simultaneous contact between the left and right side teeth. To quantify this effect, the contact parameters of a herringbone gear pair with centering errors of 0, 6, 12, and 18 μm were computed. The results show that the average contact pressure on the leading contact side is consistently higher than that on the lagging side. The difference becomes more pronounced as the centering error increases.
In mixed lubrication, the contact pressure is shared between the oil film and the surface asperities. The asperity contact pressure was computed using the load-sharing concept. Similar to the total contact pressure, the asperity contact pressure is higher on the leading side, but the difference between the two sides is somewhat reduced due to the hydrodynamic pressure build-up in the oil film.
The contact temperature distribution on the tooth surface was also influenced by the centering error. The leading side experiences higher temperatures due to higher contact pressure and friction, which could adversely affect the lubricant film and accelerate surface degradation.
Additionally, the sliding distance on the leading side was found to be greater than that on the lagging side, further amplifying the wear difference between the two sides.
5.2 Wear Distribution under Dry and Mixed Lubrication
Based on the proposed thermodynamic wear model, the tooth surface wear distribution of the herringbone gear was calculated under both dry friction and mixed lubrication conditions. The herringbone gear was subjected to a total of 1 × 10⁴ meshing cycles. The wear distribution patterns are shown in Figures 4 and 5.
Under dry friction conditions, the maximum wear depth occurs at the engagement point (tooth root of the pinion), and the wear depth gradually decreases along the meshing line toward the pitch point, beyond which it increases again toward the tooth tip. The wear distribution along the face width is non-uniform, consistent with the helical geometry of the gear. The pinion exhibits more wear than the wheel due to its higher number of meshing cycles.
In mixed lubrication, the overall wear depth is significantly lower than in dry friction. The wear distribution pattern is similar, but the wear depth decays more rapidly from the engagement point toward the pitch point. The wear on the tooth flank also shows an interesting non-linear distribution, highlighting the combined influence of pressure, sliding, temperature, and lubricant effects.
5.3 Comparison with the Archard Wear Model
The wear results from the thermodynamic model were compared with those from the Archard model for the same conditions. Both models predict similar wear distribution patterns. However, the wear depths predicted by the thermodynamic model are slightly lower than those from the Archard model, which is consistent with the experimental observations presented earlier. This difference can be attributed to the fact that the thermodynamic model accounts for variations in contact temperature and friction coefficient, which are often overestimated or held constant in the Archard approach.
The comparison results for the front, middle, and rear sections of one gear side are presented in Table 4.
| Section | Archard model | Thermodynamic model | Difference (%) |
|---|---|---|---|
| Front | 12.5 | 10.8 | 13.6 |
| Middle | 11.3 | 9.9 | 12.4 |
| Rear | 10.2 | 8.9 | 12.7 |
These results further validate the effectiveness of the thermodynamic wear model for predicting herringbone gear tooth wear.
5.4 Wear Evolution Process Considering Centering Errors
The interaction between wear and centering error was studied over multiple update steps. Each update step corresponded to a wear cycle of 3 × 10² meshing cycles under dry friction and 3 × 10⁷ meshing cycles under mixed lubrication. The wear depth and contact pressure distributions were updated after each step.
The results indicate that in the initial stage, the wear rate on the leading contact side is higher than that on the lagging side. As wear accumulates, the effective centering error decreases, causing the load distribution between the two sides to gradually equalize. After several update steps, the contact pressures and wear rates on both sides converge to similar values, particularly in the regions near the engagement and disengagement points. In contrast, the wear depth near the pitch point remains relatively low and shows little variation over time, as the sliding velocity there is minimal.
These findings confirm the dynamic coupling between wear and centering errors in herringbone gears and underline the importance of considering this interaction in long-term wear predictions.
5.5 Parametric Studies
To gain further insights into the wear behavior of herringbone gears, parametric studies were conducted by varying surface roughness, torque, and rotational speed. The wear depth was computed for a gear with a centering error of 12 μm.
Surface roughness plays a critical role in mixed lubrication. When the root mean square roughness σr was increased from 0.2 μm to 0.8 μm, the wear depth increased substantially. This is because a rougher surface reduces the film thickness ratio, increasing the asperity load ratio and promoting more severe micro-contact between the surfaces.
The effect of torque was also significant. Higher torque increases the contact pressure and the Hertzian contact width, leading to greater sliding distances and higher wear depths. The difference in wear between the leading and lagging sides also increased with torque.
Conversely, increasing the rotational speed resulted in lower wear depths. This is attributed to the improved lubricant film formation at higher speeds, which reduces direct asperity contact. However, excessively high speeds could cause detrimental temperature rise and film breakdown, which is beyond the scope of the present model.
| Parameter | Value | Leading side | Lagging side |
|---|---|---|---|
| Roughness σr (μm) | 0.2 | 0.8 | 0.6 |
| 0.5 | 3.5 | 2.9 | |
| 0.8 | 8.2 | 7.0 | |
| Torque (N·m) | 600 | 3.1 | 2.5 |
| 800 | 4.2 | 3.4 | |
| 1000 | 5.5 | 4.3 | |
| Speed (r/min) | 100 | 5.8 | 4.7 |
| 150 | 4.2 | 3.4 | |
| 200 | 3.0 | 2.4 |
6. Conclusion and Outlook
In this study, I developed a thermodynamic wear model for herringbone gears based on the principles of irreversible process thermodynamics and the degradation-entropy generation theorem. The model incorporates the coupled effects of contact pressure, sliding distance, contact temperature, and centering errors. Experimental validation was carried out using pin-on-disk wear tests, demonstrating that the thermodynamic model provides accurate wear predictions under both constant and variable operating conditions.
The main conclusions of this research are summarized as follows:
- The thermodynamic wear model outperforms the Archard wear model under variable load and variable speed conditions, as it inherently accounts for variations in friction coefficient and contact temperature. A strong linear correlation exists between wear rate and entropy generation rate, confirming the applicability of thermodynamic principles to wear prediction.
- For herringbone gears, the maximum wear occurs at the engagement point and the wear distribution along the face width is non-uniform. The pinion generally suffers more wear than the wheel due to its higher meshing frequency.
- Surface roughness significantly affects wear in mixed lubrication. Increasing roughness from 0.2 μm to 0.8 μm can increase the maximum wear depth by more than tenfold, highlighting the importance of surface finishing in gear manufacturing.
- Torque has a proportional effect on wear, whereas increasing rotational speed tends to reduce wear within the normal operating range due to enhanced lubricant film formation.
- Centering errors cause unequal load sharing between the two sides of the herringbone gear. The leading side experiences higher contact pressure, higher temperature, greater sliding distance, and consequently more wear. However, as wear progresses, the effective centering error diminishes, and the wear rates on both sides tend to converge. This self-balancing phenomenon is a unique feature of herringbone gear wear dynamics.
While the present model provides a robust foundation for predicting herringbone gear wear, several aspects warrant further investigation. The current model assumes quasi-static conditions; incorporating dynamic effects such as time-varying mesh stiffness, gear dynamics, and tooth flexibility would improve prediction accuracy under transient operating conditions. Additionally, the effect of wear on lubricant film thickness and rheology, as well as the influence of wear debris on the lubrication regime, should be addressed in future studies. Finally, more extensive experimental campaigns on actual herringbone gear test rigs would be valuable to further validate and refine the proposed thermodynamic wear model.
In summary, irreversible process thermodynamics offers a powerful and physically meaningful framework for describing the complex wear behavior of herringbone gears. The thermodynamic wear model presented in this study provides a solid basis for the design of more wear-resistant herringbone gears and for the development of condition-based maintenance strategies in practical engineering applications.