
1. Introduction and Research Background
In the field of mechanical transmission, **herringbone gears** have always played an indispensable role due to their exceptional load-carrying capacity, smooth transmission characteristics, and ability to eliminate axial thrust. Unlike conventional cylindrical gears, **herringbone gears** consist of two opposite-handed helical gear sections machined on a single blank, separated by a central gap known as the “runout groove” or “gap.” The structural configuration of **herringbone gears** inherently cancels axial forces, making them highly desirable in heavy-duty applications such as marine propulsion systems, helicopter reducers, and large-scale industrial gearboxes.
However, despite their widespread application, the measurement and evaluation of **herringbone gears** remain a significant technical challenge. Existing measurement methodologies predominantly rely on cylindrical gear evaluation standards, treating the left-hand and right-hand helical sections of **herringbone gears** as independent entities. This approach introduces a critical limitation: even if both helical sections are individually certified as conforming to specifications, the relative positional accuracy—often referred to as the alignment or symmetry of the V-shaped apex—cannot be guaranteed. This deficiency directly impacts the transmission performance of **herringbone gears**, particularly under high-speed and high-load operating conditions.
My research addresses this gap by developing a dedicated measurement software system capable of performing fully automated, multi-parameter geometric evaluation of **herringbone gears** in a single clamping operation using a CNC gear measuring center (GMC650). The software facilitates the simultaneous measurement and analysis of both left-handed and right-handed helical sections, enabling not only geometric error assessment but also a preliminary evaluation of transmission performance through derived metrics such as alignment deviation, comprehensive pitch error, and load distribution analysis.
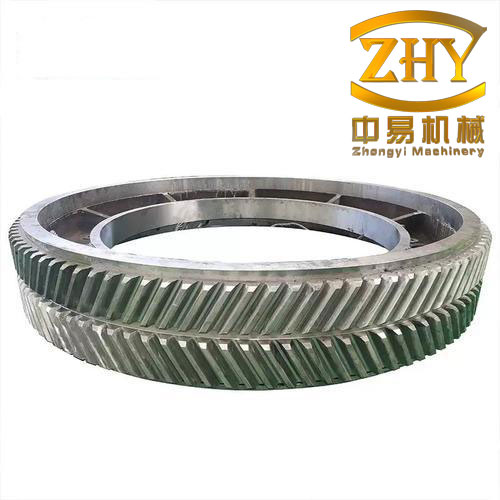
2. Comprehensive Measurement Strategy for Herringbone Gears
2.1 Measurement Requirements and Functional Module Division
The measurement software for **herringbone gears** was designed with a modular architecture to ensure flexibility, maintainability, and upgradeability. The overall system was segmented into three primary modules: the measurement software module, the hardware platform module, and the device driver module. The measurement software module was further refined into four sub-modules: measurement motion control, data processing and error computation, error curve plotting, and measurement report generation. This modular decomposition allowed for tandem development and simplified debugging.
The primary functional requirements included:
- Measurement of tooth profile deviation for both helical sections
- Measurement of helix deviation for both helical sections
- Measurement of pitch deviation for both helical sections
- Measurement of full-tooth alignment deviation based on the V-shaped apex concept
- Comprehensive pitch error evaluation
- Load distribution or bias analysis for transmission performance assessment
2.2 Overall Technical Route
The technical roadmap began with the preparation of the workpiece, followed by its installation on the rotary table of the GMC650 gear measuring center. The human-machine interface (HMI) enabled input of fundamental **herringbone gears** parameters, after which the software executed the planned measurement paths. The collected point data was processed through the data computation module, incorporating error compensation calculations. The results were then visualized in designated plotting regions and output as measurement reports. These reports were subsequently analyzed to verify measurement accuracy and to refine the software iteratively.
2.3 Coordinate System and Workpiece Zero-Point Definition
Establishing a stable coordinate system is a prerequisite for accurate **herringbone gears** measurement. Since the GMC650 gear measuring center utilizes a four-axis configuration (R, θ, Z, T), the initial stage involved the calibration of the R and T axes through the established sphere/bar calibration routines. The Z-axis origin was defined at the lower end face of the **herringbone gears** workpiece. The θ-axis zero position was established by locating a tooth gap on the upper helical section and positioning the probe at the midpoint of two symmetric points on the tooth profile, ensuring a repeatable angular reference for all subsequent measurements.
2.4 Key Human-Machine Interface Design
The HMI was developed to be intuitive and efficient. The main parameter interface allowed users to input critical data such as normal modulus, number of teeth, helix angle, face width, tip diameter, root diameter, runout groove width, and pressure angle. Additionally, the interface incorporated options for installation error correction, including corrections based on reference cylinder sections or end-face referencing. Dedicated interfaces for tooth profile measurement, helix measurement, and pitch measurement provided control over parameters such as the number of teeth to be measured, measurement speed, evaluation standards, and precision grades.
3. Development of Tooth Profile and Helix Measurement Software
3.1 Measurement Principles and Path Planning
The measurement of tooth profile deviation in **herringbone gears** was performed at the mid-face width position of each helical section. The probe was programmed to traverse from the root to the tip of the tooth along a path that spans the usable profile. During this traverse, the rotation axis (θ) and radial axes (R, T) moved in a coordinated manner to maintain probe contact along the theoretical involute curve. The helix measurement was designed to be performed consecutively after each tooth profile measurement on the same tooth surface, transitioning the probe without retracting to the safe distance, thereby optimizing the measurement cycle time and reducing the risk of positional drift.
3.2 Error Computation Methodology
The error calculations for tooth profile and helix measurements relied on comparing the actual probe coordinates against theoretical values derived from the gear’s geometric parameters. The tooth profile deviation was computed using the formula:
$$
f_{\alpha p} = \Delta \theta \times r_b – \Delta Z \times \tan \beta \times \frac{r_b}{r_p} – \Delta T
$$
where $\Delta \theta$, $\Delta Z$, $\Delta T$ are the linear/angular displacements from the respective axes, $r_b$ is the base circle radius, $r_p$ is the pitch circle radius, and $\beta$ is the helix angle. After data acquisition, a three-point moving average was applied to smooth the raw deviations:
$$
f_{\alpha p} = \frac{f_{\alpha p+1} + f_{\alpha p} + f_{\alpha p-1}}{3}
$$
The total profile deviation was then determined as:
$$
F_{\alpha} = \max(f_{\alpha p}) – \min(f_{\alpha p})
$$
Similarly, the helix deviation was calculated by:
$$
f_{\beta p} = \Delta \theta \times r_b – \frac{\Delta Z \times \tan \beta \times r_b}{r_p} – \left(\Delta T \times \frac{r_b}{R_p}\right) \pm \Delta \tan \left(\csc \left(\frac{r_b}{R_p}\right)\right)
$$
with the total helix deviation defined as:
$$
F_{\beta} = \max(f_{\beta p}) – \min(f_{\beta p})
$$
3.3 Repeated Measurement Stability Analysis
To validate the performance of the developed measurement software, repeated measurements were conducted on a 27-tooth **herringbone gears** workpiece under identical clamping conditions. Ten complete measurement cycles were performed, and the results for the tooth profile total deviation are summarized in Tables 3.1 and 3.2 below.
Table 3.1 Tooth Profile Total Deviation (Left-Hand Helix) – Repeated Measurements (Unit: μm)
| Measurement No. | Tooth 1 Left Flank | Tooth 1 Right Flank | Tooth 7 Left Flank | Tooth 7 Right Flank | Tooth 14 Left Flank | Tooth 14 Right Flank | Tooth 21 Left Flank | Tooth 21 Right Flank |
|:—:|:—:|:—:|:—:|:—:|:—:|:—:|:—:|:—:|
| 1 | 2.0 | 3.9 | 1.3 | 2.2 | 1.5 | 2.1 | 2.3 | 4.0 |
| 2 | 1.8 | 3.7 | 1.3 | 2.2 | 1.6 | 2.2 | 2.2 | 4.0 |
| 3 | 2.1 | 3.5 | 1.5 | 2.1 | 1.6 | 2.2 | 2.3 | 3.7 |
| 4 | 1.8 | 3.4 | 1.4 | 2.0 | 1.6 | 2.0 | 2.3 | 3.7 |
| 5 | 1.8 | 3.9 | 1.1 | 2.2 | 1.6 | 2.1 | 2.1 | 4.0 |
| 6 | 1.9 | 3.6 | 1.2 | 2.1 | 1.6 | 1.9 | 2.4 | 3.6 |
| 7 | 2.0 | 3.4 | 1.6 | 2.1 | 1.5 | 1.9 | 2.2 | 3.9 |
| 8 | 1.9 | 3.8 | 1.3 | 2.1 | 1.5 | 2.0 | 2.1 | 3.8 |
| 9 | 2.0 | 3.5 | 1.6 | 2.0 | 1.5 | 2.0 | 2.3 | 3.9 |
| 10 | 2.0 | 3.5 | 1.6 | 2.0 | 1.5 | 2.0 | 2.3 | 3.9 |
Table 3.2 Tooth Profile Total Deviation (Right-Hand Helix) – Repeated Measurements (Unit: μm)
| Measurement No. | Tooth 1 Left Flank | Tooth 1 Right Flank | Tooth 7 Left Flank | Tooth 7 Right Flank | Tooth 14 Left Flank | Tooth 14 Right Flank | Tooth 21 Left Flank | Tooth 21 Right Flank |
|:—:|:—:|:—:|:—:|:—:|:—:|:—:|:—:|:—:|
| 1 | 2.8 | 1.6 | 1.4 | 0.8 | 1.6 | 2.0 | 2.6 | 1.2 |
| 2 | 3.0 | 1.7 | 1.4 | 0.7 | 1.7 | 1.7 | 2.5 | 1.2 |
| 3 | 3.0 | 1.5 | 1.4 | 0.8 | 1.5 | 1.9 | 2.7 | 1.1 |
| 4 | 3.0 | 1.9 | 1.5 | 0.8 | 1.7 | 1.9 | 2.5 | 1.3 |
| 5 | 3.2 | 1.7 | 1.6 | 0.8 | 1.6 | 1.9 | 2.7 | 1.1 |
| 6 | 3.0 | 1.7 | 1.6 | 0.8 | 1.7 | 2.1 | 2.5 | 1.1 |
| 7 | 2.9 | 1.6 | 1.4 | 0.8 | 1.7 | 2.2 | 2.5 | 1.2 |
| 8 | 2.8 | 1.8 | 1.4 | 0.8 | 1.5 | 2.0 | 2.6 | 1.4 |
| 9 | 2.8 | 1.7 | 1.6 | 0.6 | 1.4 | 2.2 | 2.5 | 1.2 |
| 10 | 2.8 | 1.7 | 1.6 | 0.6 | 1.4 | 2.2 | 2.5 | 1.2 |
From the data, it was observed that the maximum variation in the total profile deviation for the left-hand helical section was 0.5 μm, while for the right-hand helical section it was 0.5 μm. Similarly, the profile shape deviation and profile slope deviation both maintained consistently small variations within the allowable tolerance of 2 μm. The helix measurement results exhibited similar stability, with the maximum fluctuation in total helix deviation observed at 1.5 μm. These results confirmed that the developed measurement software delivered highly stable and repeatable measurements for **herringbone gears** tooth profile and helix quality.
3.4 Workpiece Reversal Experiment
In order to verify the measurement consistency of the software, the **herringbone gears** workpiece was re-clamped in an inverted orientation (right-hand helix at the top). Five repeated measurements were conducted on tooth 1 to compare the left and right flank measurements with those obtained in the normal orientation. For the tooth profile measurement, the maximum difference between the two mounting orientations was observed to be 0.7 μm. For the helix measurement, the maximum difference was also limited to 0.9 μm. These experiments confirmed that the software produced consistent measurements irrespective of the clamping orientation.
3.5 Installation Error Correction Experiment
Given the elongated axial structure of **herringbone gears**, the risk of workpiece tilt during clamping is substantial. To mitigate this, the software incorporated a tilt correction algorithm. Experiments were conducted by inserting shims of 20 μm, 40 μm, and 60 μm thickness at approximately two-thirds of the circumference under the top center to induce controlled tilt. The measurement results, before and after correction, are presented in Tables 3.3 and 3.4.
Table 3.3 Tooth Profile Deviation Before and After Tilt Correction (Right-Hand Helix, Tooth 1) (Unit: μm)
| Condition | Shim Thickness | Total Profile Deviation (L) | Total Profile Deviation (R) | Shape Deviation (L) | Shape Deviation (R) | Slope Deviation (L) | Slope Deviation (R) |
|:—:|:—:|:—:|:—:|:—:|:—:|:—:|:—:|
| Before Correction | 20 μm | 16.6 | 16.1 | 2.9 | 2.1 | 15.8 | 15.5 |
| Before Correction | 40 μm | 19.9 | 20.2 | 4.1 | 3.7 | 19.8 | 19.4 |
| Before Correction | 60 μm | 24.7 | 24.3 | 8.0 | 7.7 | 23.8 | 23.4 |
| After Correction | 20 μm | 2.9 | 3.1 | 2.8 | 1.5 | 0.5 | 2.3 |
| After Correction | 40 μm | 2.6 | 1.7 | 2.1 | 1.3 | 1.3 | 1.0 |
| After Correction | 60 μm | 2.8 | 3.9 | 2.7 | 1.6 | 0.9 | 2.4 |
Table 3.4 Helix Deviation Before and After Tilt Correction (Right-Hand Helix, Tooth 1) (Unit: μm)
| Condition | Shim Thickness | Total Helix Deviation (L) | Total Helix Deviation (R) | Shape Deviation (L) | Shape Deviation (R) | Slope Deviation (L) | Slope Deviation (R) |
|:—:|:—:|:—:|:—:|:—:|:—:|:—:|:—:|
| Before Correction | 20 μm | 19.6 | 30.7 | 2.3 | 1.6 | 17.6 | 26.5 |
| Before Correction | 40 μm | 24.4 | 35.7 | 5.6 | 4.6 | 23.4 | 32.4 |
| Before Correction | 60 μm | 28.5 | 40.6 | 9.4 | 9.6 | 38.9 | 36.3 |
| After Correction | 20 μm | 3.6 | 4.5 | 2.0 | 1.6 | 3.2 | 3.5 |
| After Correction | 40 μm | 4.0 | 4.6 | 1.9 | 1.5 | 3.4 | 3.4 |
| After Correction | 60 μm | 3.6 | 5.1 | 2.5 | 1.6 | 2.8 | 4.2 |
The corrected results, regardless of the initial tilt severity, converged to values within a narrow band, with maximum deviations of 1.4 μm for the tooth profile and 1.4 μm for the helix. This demonstrated the robustness and correctness of the implemented tilt correction algorithm.
4. Development and Experimental Analysis of Pitch Measurement Software
4.1 Measurement Path and Software Flow
Pitch measurement of **herringbone gears** requires the probe to contact corresponding points on every tooth flank at the pitch circle diameter and mid-face width. The measurement was initiated on the upper helical section, and after completing all teeth, the probe moved to the lower helical section. The software executed a nested loop structure, sequentially measuring each tooth and flank. For each tooth, the probe approached the flank, registered the contact point, and then retracted to the safe distance before rotating to the next tooth. This process was repeated until all teeth were measured.
4.2 Pitch Error Calculation
The single pitch deviation was determined from the angular position difference between actual and theoretical tooth positions:
$$
f_{pi} = \Delta \theta \times \frac{2\pi Z}{r_m} – \left(\tan\left(\sec\left(\frac{r_b}{\sqrt{R_p^2 + T_p^2}}\right)\right) – \sec\left(\frac{r_b}{\sqrt{R_p^2 + T_p^2}}\right) – \tan\left(\sec\left(\frac{r_b}{\sqrt{R_{pn}^2 + T_{pn}^2}}\right)\right) + \sec\left(\frac{r_b}{\sqrt{R_{pn}^2 + T_{pn}^2}}\right)\right) \times r_m – \Delta T \times \frac{r_m}{R_p}
$$
The adjacent pitch difference and total cumulative pitch deviation were computed as:
$$
f_{Ui} = \max(f_{pi} – f_{p(i-1)})
$$
$$
F_P = \max(f_{pi}) – \min(f_{pi})
$$
4.3 Measurement Report Interface
The pitch measurement report was partitioned into two pages, one for each helical section of the **herringbone gears**. The primary plotting area displayed the individual pitch deviation, adjacent pitch difference, cumulative pitch deviation, and radial runout in a composite chart. At the bottom, the corresponding deviation values and their respective precision grades were displayed, offering a comprehensive overview of the gear’s pitch quality.
4.4 Experimental Results and Analysis
4.4.1 Repeatability Experiment
Ten repeated pitch measurements were performed on the 27-tooth **herringbone gears** workpiece. The measurement results, summarized in Table 4.1 below, show the total cumulative pitch deviation for both helical sections.
Table 4.1 Pitch Cumulative Deviation – 10 Repeated Measurements (27-Tooth Herringbone Gears) (Unit: μm)
| Measurement No. | Left-Hand Helix (Left Flank) | Left-Hand Helix (Right Flank) | Right-Hand Helix (Left Flank) | Right-Hand Helix (Right Flank) |
|:—:|:—:|:—:|:—:|:—:|
| 1 | 10.8 | 10.5 | 16.7 | 17.3 |
| 2 | 11.5 | 9.8 | 16.8 | 17.1 |
| 3 | 11.4 | 9.4 | 16.2 | 16.3 |
| 4 | 11.3 | 10.0 | 16.7 | 16.8 |
| 5 | 11.2 | 9.8 | 16.4 | 16.4 |
| 6 | 11.5 | 9.9 | 16.9 | 17.2 |
| 7 | 11.1 | 9.7 | 16.2 | 16.5 |
| 8 | 10.7 | 9.6 | 16.5 | 16.6 |
| 9 | 10.8 | 10.2 | 16.0 | 16.9 |
| 10 | 10.9 | 10.4 | 16.4 | 16.7 |
| **Range** | **0.8** | **1.1** | **0.9** | **1.0** |
The maximum fluctuation in the cumulative pitch deviation was 1.1 μm, while the single pitch deviation fluctuation remained below 1.0 μm. The radial runout measurement showed a maximum variation of 0.9 μm. These results firmly established the high repeatability of the pitch measurement software for **herringbone gears**.
4.4.2 Workpiece Reversal Experiment
Five inversion experiments were conducted on the **herringbone gears** workpiece. The comparative measurements of cumulative pitch deviation are presented in Table 4.2.
Table 4.2 Pitch Cumulative Deviation – Reversal Experiment Results (Unit: μm)
| Gear Section | Measurement No. | Normal (Left-Hand Up) – Left Flank | Normal (Left-Hand Up) – Right Flank | Inverted (Right-Hand Up) – Right Flank | Inverted (Right-Hand Up) – Left Flank |
|:—:|:—:|:—:|:—:|:—:|:—:|
| Right-Hand Helix | 1 | 10.4 | 17.3 | 10.5 | 17.2 |
| Right-Hand Helix | 2 | 10.4 | 17.1 | 10.3 | 17.3 |
| Right-Hand Helix | 3 | 9.5 | 16.3 | 9.4 | 16.2 |
| Right-Hand Helix | 4 | 10.0 | 16.8 | 10.0 | 16.7 |
| Right-Hand Helix | 5 | 9.5 | 16.4 | 9.8 | 16.2 |
| Left-Hand Helix | 1 | 10.8 | 10.5 | 10.4 | 10.9 |
| Left-Hand Helix | 2 | 11.5 | 10.3 | 11.2 | 10.4 |
| Left-Hand Helix | 3 | 11.4 | 10.4 | 11.1 | 10.8 |
| Left-Hand Helix | 4 | 11.3 | 10.0 | 10.9 | 9.7 |
| Left-Hand Helix | 5 | 11.2 | 9.8 | 10.5 | 10.1 |
The maximum difference observed between the two mounting orientations was 1.3 μm. The consistency of the results confirmed that the pitch measurement software was insensitive to the clamping orientation and produced accurate, reliable results.
4.4.3 Installation Error Correction Experiment
The tilt correction experiment was repeated for pitch measurements. The results are presented in Tables 4.3 and 4.4.
Table 4.3 Pitch Error Before and After Tilt Correction (Right-Hand Helix) (Unit: μm)
| Measurement Category | Shim Thickness | Single Pitch Deviation (Left Flank) | Single Pitch Deviation (Right Flank) | Cumulative Pitch Deviation (Left Flank) | Cumulative Pitch Deviation (Right Flank) | Radial Runout |
|:—:|:—:|:—:|:—:|:—:|:—:|:—:|
| Before Correction | 20 μm | 17.2 | 8.6 | 16.0 | 6.8 | 117.8 |
| Before Correction | 40 μm | 23.2 | 17.6 | 20.0 | 10.8 | 125.8 |
| Before Correction | 60 μm | 28.9 | 26.0 | 29.5 | 20.2 | 131.7 |
| After Correction | 20 μm | 4.3 | 5.3 | 1.9 | 2.6 | 20.0 |
| After Correction | 40 μm | 4.1 | 4.9 | 2.9 | 3.7 | 21.2 |
| After Correction | 60 μm | 3.9 | 4.4 | 2.3 | 3.9 | 21.3 |
Table 4.4 Pitch Error Before and After Tilt Correction (Left-Hand Helix) (Unit: μm)
| Measurement Category | Shim Thickness | Single Pitch Deviation (Left Flank) | Single Pitch Deviation (Right Flank) | Cumulative Pitch Deviation (Left Flank) | Cumulative Pitch Deviation (Right Flank) | Radial Runout |
|:—:|:—:|:—:|:—:|:—:|:—:|:—:|
| Before Correction | 20 μm | 11.6 | 4.6 | 13.3 | 4.8 | 87.0 |
| Before Correction | 40 μm | 15.2 | 8.6 | 20.0 | 11.8 | 95.8 |
| Before Correction | 60 μm | 21.9 | 14.0 | 29.5 | 19.2 | 111.7 |
| After Correction | 20 μm | 2.3 | 2.4 | 1.9 | 2.3 | 13.6 |
| After Correction | 40 μm | 2.4 | 3.1 | 2.1 | 2.9 | 14.9 |
| After Correction | 60 μm | 2.4 | 3.6 | 2.5 | 3.2 | 13.9 |
The corrected results for the pitch measurements displayed excellent convergence, with the maximum variation being 2.0 μm for the cumulative pitch deviation and 1.4 μm for the single pitch deviation. These experiments conclusively proved the correctness and effectiveness of the tilt correction algorithm employed in the measurement software for **herringbone gears**.
5. Development and Experimental Analysis of Alignment Measurement Software
5.1 Definition of Alignment and Symmetry Deviation
The alignment deviation of **herringbone gears** is defined based on the concept of the V-shaped apex. By extending the helix lines of corresponding teeth on both helical sections into the runout groove, they intersect at a virtual point known as the V-shaped apex. The vertical displacement between this apex and the center plane of the **herringbone gears** workpiece constitutes the tooth alignment deviation, denoted as $f_{Ai}$. The overall symmetry deviation $f_{AS}$ is the arithmetic mean of all individual alignment deviations around the gear:
$$
f_{AS} = \frac{\sum_{i=1}^{Z} f_{Ai}}{Z}
$$
where $Z$ is the number of teeth.
5.2 Measurement Approach for Full-Tooth Alignment
The alignment measurement was executed by measuring the helix line on every tooth flank of both helical sections. The measurement path was identical to that used for single helix deviation, but extended to all teeth. The acquired three-dimensional point coordinates were converted from polar to Cartesian coordinates using the following transformations:
$$
Y_i = R_i \times \cos \theta_i – T_i \times \sin \theta_i
$$
$$
X_i = T_i \times \cos \theta_i – R_i \times \sin \theta_i
$$
The Z coordinates remained unchanged, as they represent the linear position along the gear axis.
For each tooth flank, the measured points were fitted into a straight line using the least squares method. The left-hand and right-hand helix lines (E and F) were expressed as:
$$
Y_E = k_{Ei} X + b_{Ei}
$$
$$
Y_F = k_{Fi} X + b_{Fi}
$$
The V-shaped apex coordinates $(X, Y)$ of the two straight lines were obtained by simultaneously solving these two equations:
$$
X = -\frac{b_{Ei} – b_{Fi}}{k_{Ei} – k_{Fi}}
$$
$$
Y = -\frac{k_{Fi} b_{Ei} – k_{Ei} b_{Fi}}{k_{Ei} – k_{Fi}}
$$
5.3 Derivation of Comprehensive Pitch Error and Load Bias Metrics
Based on the V-shaped apex positions, two additional metrics were derived to evaluate the transmission performance of **herringbone gears**:
(1) Comprehensive Pitch Error: The difference between the actual circumferential distance of adjacent V-shaped apexes and the theoretical pitch:
$$
f_{p\Sigma i} = (X_i – X_{i-1}) – f_{pt}
$$
where $f_{pt}$ is the theoretical pitch.
(2) Load Bias Quantity: Reflecting the circumferential offset at the intersection of each helix projection line with the average alignment axis, it characterizes uneven load distribution between the left-hand and right-hand helical sections. It was calculated using the fitted line equations and the symmetry deviation:
$$
f_{oE} = \frac{(f_{AS} – b_E)}{k_E}
$$
$$
f_{oF} = \frac{(f_{AS} – b_F)}{k_F}
$$
$$
f_{oi} = f_{oE} – f_{oF}
$$
where the algebraic sign of $f_{oi}$ is determined by the operating flank (convex or concave) and the lead/lag relationship.
5.4 Experimental Verification of Alignment Measurement Software
5.4.1 Repeatability Experiments on 27-Tooth and 106-Tooth Gears
Ten repeated alignment measurements were conducted on both a 27-tooth and a 106-tooth **herringbone gears** workpiece. The results for the 27-tooth gear are summarized in Tables 5.1 and 5.2.
Table 5.1 Alignment Measurement Results – 27-Tooth Herringbone Gears (Left Flank) (Unit: μm)
| Measurement No. | Adjacent Alignment Difference | Total Alignment Deviation | Symmetry Deviation | Single Comprehensive Pitch Deviation | Total Cumulative Pitch Deviation | Adjacent Load Bias Difference | Total Load Bias Error |
|:—:|:—:|:—:|:—:|:—:|:—:|:—:|:—:|
| 1 | -32.0 | 40.1 | 110.6 | 19.1 | 32.1 | 39.9 | 47.0 |
| 2 | -32.2 | 41.0 | 109.8 | 19.4 | 32.6 | 40.4 | 47.9 |
| 3 | -32.9 | 40.0 | 109.5 | 18.9 | 31.9 | 40.1 | 46.8 |
| 4 | -31.9 | 40.2 | 110.6 | 18.9 | 32.7 | 40.1 | 47.0 |
| 5 | -32.1 | 41.3 | 110.2 | 19.1 | 33.0 | 40.5 | 47.1 |
| 6 | -32.5 | 40.7 | 111.0 | 19.3 | 32.4 | 39.7 | 46.5 |
| 7 | -31.8 | 40.8 | 110.4 | 19.5 | 32.0 | 40.1 | 47.4 |
| 8 | -32.6 | 40.3 | 110.3 | 19.7 | 31.9 | 40.3 | 47.1 |
| 9 | -31.7 | 41.1 | 109.8 | 19.0 | 32.3 | 40.4 | 47.5 |
| 10 | -32.4 | 41.0 | 110.1 | 18.9 | 32.5 | 39.9 | 47.8 |
| **Range** | **1.2** | **1.3** | **1.5** | **0.8** | **1.1** | **0.8** | **1.4** |
Table 5.2 Alignment Measurement Results – 27-Tooth Herringbone Gears (Right Flank) (Unit: μm)
| Measurement No. | Adjacent Alignment Difference | Total Alignment Deviation | Symmetry Deviation | Single Comprehensive Pitch Deviation | Total Cumulative Pitch Deviation | Adjacent Load Bias Difference | Total Load Bias Error |
|:—:|:—:|:—:|:—:|:—:|:—:|:—:|:—:|
| 1 | -2.0 | 5.3 | -101.0 | 2.6 | 14.3 | -3.0 | 6.2 |
| 2 | -1.3 | 5.6 | -101.2 | 2.2 | 14.3 | -3.0 | 6.5 |
| 3 | -1.8 | 5.6 | -101.3 | 2.5 | 13.4 | -3.2 | 6.5 |
| 4 | -1.4 | 4.8 | -99.8 | 2.3 | 14.4 | -3.0 | 5.6 |
| 5 | -1.5 | 5.7 | -99.5 | 2.4 | 14.3 | -3.1 | 5.9 |
| 6 | -1.6 | 5.5 | -100.9 | 2.4 | 13.9 | -2.9 | 6.0 |
| 7 | -1.9 | 5.1 | -99.8 | 2.9 | 14.6 | -3.4 | 6.5 |
| 8 | -1.5 | 5.2 | -100.3 | 2.0 | 13.9 | -3.5 | 5.8 |
| 9 | -1.9 | 4.8 | -101.1 | 2.5 | 14.5 | -3.0 | 6.6 |
| 10 | -1.8 | 5.0 | -101.5 | 2.3 | 14.7 | -3.4 | 6.3 |
| **Range** | **0.7** | **0.9** | **2.0** | **0.5** | **0.4** | **0.6** | **1.0** |
The maximum fluctuations across all alignment-related metrics were below 2.0 μm, confirming the high stability and repeatability of the alignment measurement software. The same conclusion was reached from the experiments conducted on the 106-tooth **herringbone gears**, where all metrics remained within the allowed 2.0 μm tolerance.
5.4.2 Workpiece Reversal Experiment
Five inversion experiments were conducted on the 27-tooth **herringbone gears** workpiece to assess the consistency of the alignment measurement software. The results for the comprehensive pitch deviation and load bias analysis are presented in Tables 5.3 and 5.4.
Table 5.3 Comprehensive Pitch Deviation Reversal Experiment Results (Unit: μm)
| Measurement Category | Measurement No. | Single Comprehensive Pitch Deviation (Left-Hand Up) | Single Comprehensive Pitch Deviation (Right-Hand Up) | Total Cumulative Pitch Deviation (Left-Hand Up) | Total Cumulative Pitch Deviation (Right-Hand Up) |
|:—:|:—:|:—:|:—:|:—:|:—:|
| Left Flank | 1 | -1.7 | -1.8 | 11.9 | 11.3 |
| Left Flank | 2 | -1.8 | -1.9 | 11.9 | 12.1 |
| Left Flank | 3 | -1.7 | -1.6 | 12.6 | 11.5 |
| Left Flank | 4 | -1.7 | -1.5 | 12.1 | 11.9 |
| Left Flank | 5 | -2.0 | -1.7 | 12.1 | 11.6 |
| Right Flank | 1 | 12.4 | 12.3 | 22.0 | 22.1 |
| Right Flank | 2 | 12.5 | 12.5 | 22.5 | 22.4 |
| Right Flank | 3 | 12.6 | 12.8 | 22.9 | 22.9 |
| Right Flank | 4 | 12.6 | 12.6 | 22.2 | 22.6 |
| Right Flank | 5 | 12.9 | 12.7 | 22.9 | 22.0 |
Table 5.4 Load Bias Analysis Reversal Experiment Results (Unit: μm)
| Measurement Category | Measurement No. | Single Load Bias (Left-Hand Up) | Single Load Bias (Right-Hand Up) | Total Load Bias (Left-Hand Up) | Total Load Bias (Right-Hand Up) |
|:—:|:—:|:—:|:—:|:—:|:—:|
| Left Flank | 1 | 3.6 | 3.2 | 5.9 | 6.2 |
| Left Flank | 2 | 3.4 | 3.4 | 6.4 | 6.5 |
| Left Flank | 3 | 3.5 | 3.6 | 6.2 | 6.3 |
| Left Flank | 4 | 3.8 | 3.5 | 7.2 | 6.4 |
| Left Flank | 5 | 3.4 | 3.3 | 6.0 | 6.6 |
| Right Flank | 1 | -25.9 | -25.8 | 31.1 | 30.1 |
| Right Flank | 2 | -25.4 | -25.0 | 30.7 | 29.1 |
| Right Flank | 3 | -25.3 | -25.1 | 30.2 | 30.5 |
| Right Flank | 4 | -25.5 | -25.6 | 30.5 | 30.8 |
| Right Flank | 5 | -25.0 | -25.3 | 30.0 | 30.7 |
The maximum differences observed between the two clamping orientations were 2.0 μm for the total load bias and 1.3 μm for the comprehensive pitch deviation, both within the acceptable tolerance. These findings validated the excellent measurement consistency of the alignment software for **herringbone gears**.
5.4.3 Installation Error Correction Experiment
The tilt correction experiment was also conducted for alignment measurements on the 27-tooth **herringbone gears** workpiece. The results are presented in Tables 5.5, 5.6, and 5.7.
Table 5.5 Alignment Deviation Before and After Tilt Correction (Unit: μm)
| Measurement Category | Shim Thickness | Adjacent Alignment Difference (Left Flank) | Adjacent Alignment Difference (Right Flank) | Total Alignment Deviation (Left Flank) | Total Alignment Deviation (Right Flank) | Symmetry Deviation (Left Flank) | Symmetry Deviation (Right Flank) |
|:—:|:—:|:—:|:—:|:—:|:—:|:—:|:—:|
| Before Correction | 20 μm | -36.6 | -4.4 | 62.8 | 28.9 | 134.6 | -122.9 |
| Before Correction | 40 μm | -45.0 | -15.4 | 68.7 | 35.2 | 142.0 | -129.5 |
| Before Correction | 60 μm | -52.0 | -24.4 | 77.6 | 44.3 | 153.6 | -137.5 |
| After Correction | 20 μm | -33.2 | -2.1 | 38.8 | 7.8 | 134.6 | -122.9 |
| After Correction | 40 μm | -33.5 | -2.3 | 38.5 | 8.7 | 134.0 | -121.5 |
| After Correction | 60 μm | -32.7 | -1.9 | 39.4 | 6.9 | 133.6 | -122.5 |
Table 5.6 Comprehensive Pitch Error Before and After Tilt Correction (Unit: μm)
| Measurement Category | Shim Thickness | Single Comprehensive Pitch Deviation (Left Flank) | Single Comprehensive Pitch Deviation (Right Flank) | Total Cumulative Pitch Deviation (Left Flank) | Total Cumulative Pitch Deviation (Right Flank) |
|:—:|:—:|:—:|:—:|:—:|:—:|
| Before Correction | 20 μm | 23.1 | 15.0 | 143.6 | 123.9 |
| Before Correction | 40 μm | 29.5 | 21.1 | 150.3 | 131.0 |
| Before Correction | 60 μm | 34.2 | 26.1 | 158.2 | 138.5 |
| After Correction | 20 μm | -19.6 | -2.2 | 27.1 | 5.8 |
| After Correction | 40 μm | -19.3 | -2.2 | 25.9 | 6.1 |
| After Correction | 60 μm | -19.5 | -1.6 | 26.1 | 5.7 |
Table 5.7 Load Bias Analysis Before and After Tilt Correction (Unit: μm)
| Measurement Category | Shim Thickness | Adjacent Load Bias Difference (Left Flank) | Adjacent Load Bias Difference (Right Flank) | Total Load Bias Error (Left Flank) | Total Load Bias Error (Right Flank) |
|:—:|:—:|:—:|:—:|:—:|:—:|
| Before Correction | 20 μm | 51.9 | 17.6 | 73.5 | 33.8 |
| Before Correction | 40 μm | 57.9 | 22.5 | 79.3 | 38.9 |
| Before Correction | 60 μm | 63.2 | 28.9 | 86.3 | 45.8 |
| After Correction | 20 μm | 40.0 | -4.9 | 47.7 | 9.1 |
| After Correction | 40 μm | 38.8 | -5.3 | 46.0 | 10.2 |
| After Correction | 60 μm | 39.4 | -4.0 | 46.1 | 9.6 |
As observed in the previous measurement items, the corrected alignment results exhibited remarkable convergence, with maximum variations of 1.7 μm for the total alignment deviation, 1.2 μm for the comprehensive pitch deviation, and 1.7 μm for the load bias error. All values were within the 2.0 μm tolerance, demonstrating the effectiveness of the tilt correction algorithm for alignment measurements in **herringbone gears**.
6. Conclusions and Future Prospects
In this research, a dedicated, fully automated measurement software system for **herringbone gears** was successfully developed and implemented on the GMC650 CNC gear measuring center. The primary conclusions derived from this work are as follows:
1. The developed software facilitates the simultaneous measurement of the left-hand and right-hand helical sections of **herringbone gears** in a single clamping operation. This eliminates the inherent limitations of the previous approach, where the two sections were measured independently, thereby failing to capture the critical relative positional information. The new system ensures the left and right helical sections are positioned within the same coordinate system, enabling a comprehensive and holistic evaluation of the workpiece.
2. By leveraging the V-shaped apex concept, the software directly measures the alignment deviation—a key positional parameter of **herringbone gears**—and further derives two transmission-performance-related metrics: the comprehensive pitch error and the load bias analysis. This establishes a preliminary framework connecting the geometric quality of **herringbone gears** to their operational performance characteristics.
3. Extensive reliability experiments were conducted, including repeated measurement, workpiece reversal, and tilt correction tests. The repeated measurement experiments demonstrated exceptional stability, with all error metrics fluctuating within a maximum range of 2.0 μm. The workpiece reversal experiments confirmed the excellent measurement consistency of the software, also within the 2.0 μm tolerance. The tilt correction experiments substantiated the correctness and robustness of the implemented installation error compensation algorithm, enabling accurate measurements even under non-ideal clamping conditions.
4. The software successfully integrates several measurement modules—tooth profile, helix, pitch, alignment, comprehensive pitch error, and load bias—into a cohesive workflow that outputs clear, comprehensive measurement reports. The software has been deployed in an actual industrial production environment and has proven its practical value and reliability.
The research presented herein significantly expands the application boundaries of the gear measuring center, offering a powerful and practical tool for the quality assessment of **herringbone gears**. Future work will focus on:
- Validating the load bias analysis through dedicated transmission performance test rigs to further correlate geometric measurements with dynamic operational behavior.
- Expanding the measurement scope to accommodate a wider variety of **herringbone gears** geometries and sizes.
- Benchmarking the developed software against other commercial gear measurement instruments under standardized conditions to further verify its measurement capabilities.