
I have carried out a systematic study on the injection lubrication and thermal behavior of helical gear drives. Helical gears are widely used in automobiles, aircraft, ships, and various engineering machines because they offer smooth transmission, compact structure, good meshing performance, large contact ratio, low noise, and high load capacity. When a helical gear pair operates at high speed or under high pressure, the transmission system enters a gas-liquid co-phase lubrication state, and the meshing tooth surfaces usually operate in a mixed lubrication regime. The centrifugal force of the gears, the obstruction of high-speed airflow, and oil splashing all affect the spreading and deposition of oil on the tooth surfaces. As a result, the oil supply in the meshing region becomes insufficient or even lost, which leads to deteriorated tooth surface lubrication. The impact between lubricating oil and rotating tooth surfaces, friction heat generation in the meshing zone, local oil film rupture, reduced load capacity, and weakened heat exchange between oil and tooth surfaces all cause poor heat dissipation. Therefore, for helical gear transmission systems, I studied the feasibility of two flow-field modeling methods for helical gear pairs and explored the mechanism of injection lubrication. I combined numerical simulation and experimental verification to analyze the flow field and temperature field distributions of helical gear injection lubrication, revealed the influence of injection parameters on tooth surface oil distribution and heat dissipation, and provided guidance for the optimal design of injection systems.
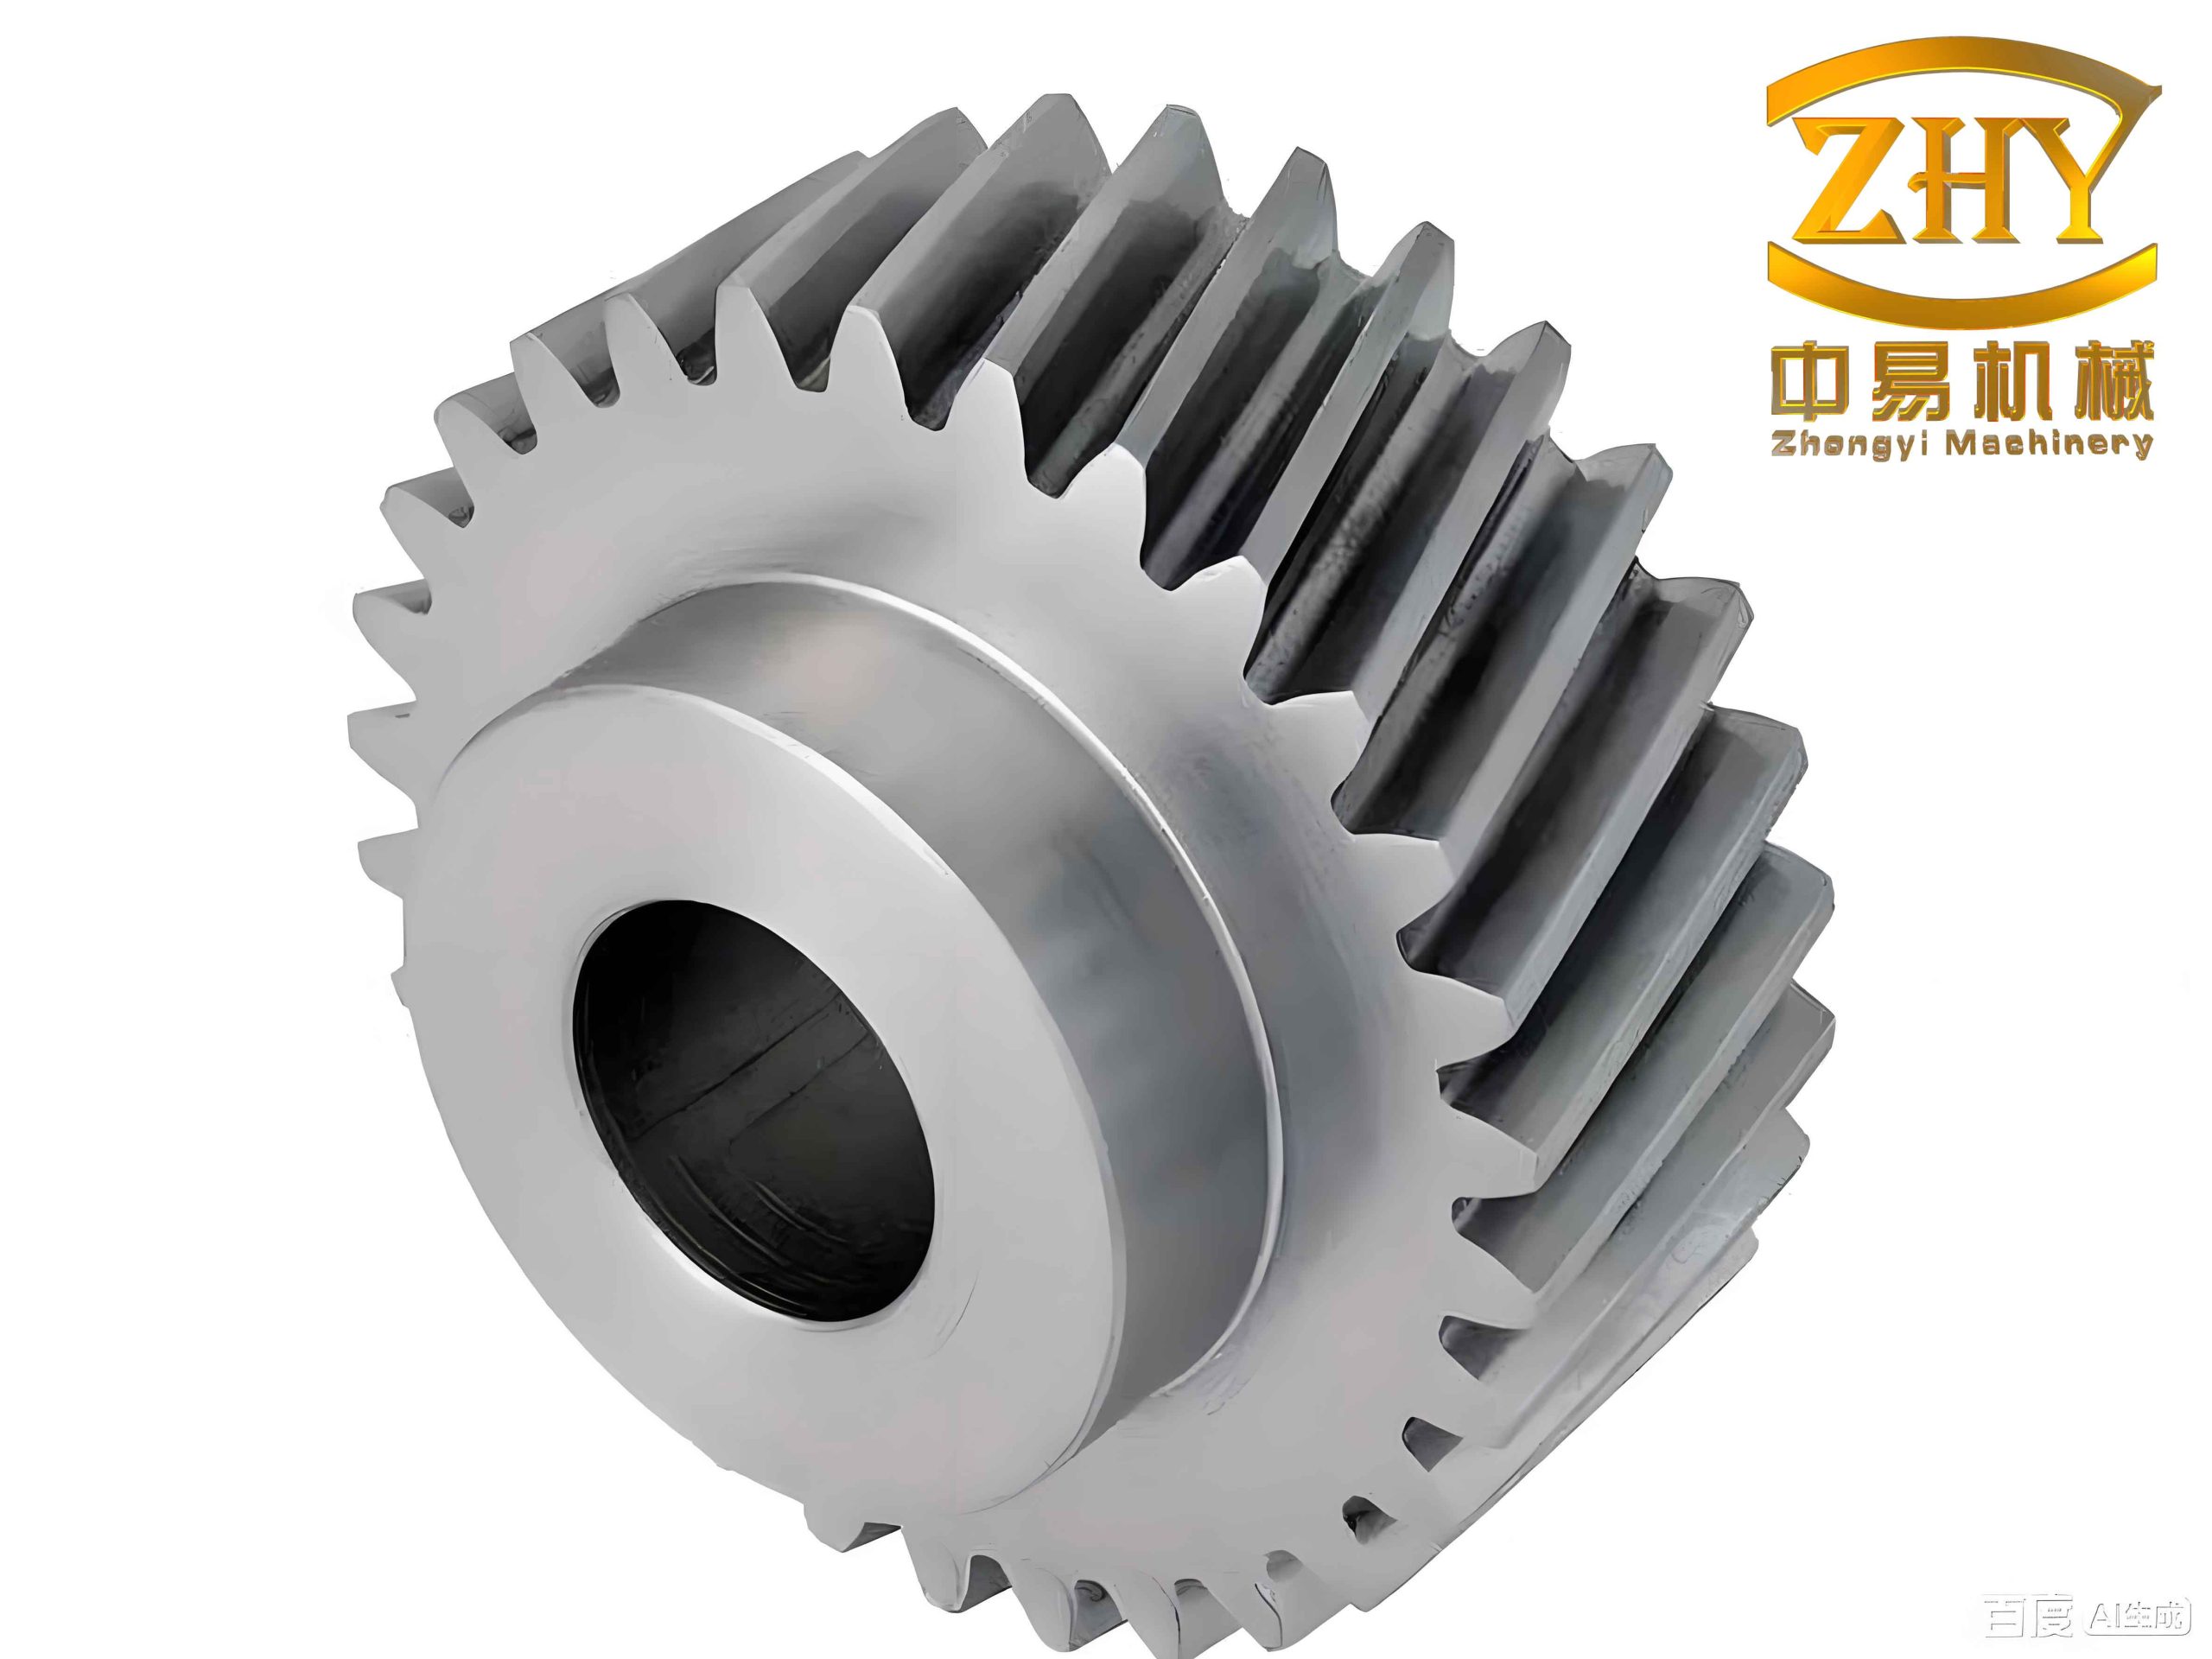
The main research content of my work includes the following parts. First, I addressed the limitations of the dynamic mesh method for solving the flow field of rotating machinery and proposed an overset mesh method to construct a CFD model for helical gear injection lubrication. I evaluated tooth surface lubrication performance using oil volume fraction and oil pressure. The results showed that when the injection angle was 7.5° and the injection velocity was 45 m/s, the tooth surface lubrication was good. By optimizing the injection angle and velocity, the tooth surface lubrication performance improved by 7.726% and 47.259%, respectively. Both simulation and experiment showed swirl and oil deposition below the driving wheel, and the simulation results agreed well with the experimental measurements.
Second, I explored the influence of injection parameters on the heat dissipation of static gears using a static heat-flow coupling method. The results showed that with the decrease of injection angle and injection distance and the increase of injection velocity, the tooth surface heat dissipation performance gradually increased. I also constructed a helical gear heat-flow coupling model based on the sliding mesh method and studied the flow field and temperature field distribution of a helical gear transmission system using a dynamic heat-flow coupling method. The simulation results showed that due to the gear centrifugal force, oil splashing, and the blocking effect of high-speed airflow, most of the oil was difficult to enter the meshing area, resulting in poor heat dissipation on the tooth surface.
Third, I designed a regression orthogonal experiment to study the heat dissipation effect of helical gears under different injection parameter combinations. Under constant rotational speed, I used the average tooth surface temperature and temperature difference as evaluation indices and carried out regression analysis, single-factor analysis, and response surface analysis. I identified the influence of injection angle, injection velocity, injection distance, and their interactions on tooth surface heat dissipation. The results showed that with the increase of injection angle, distance, and velocity, the average tooth surface temperature first decreased and then increased, while the tooth surface temperature difference first increased and then decreased. The injection velocity and injection distance significantly affected the average tooth surface temperature and temperature difference, respectively. When the injection angle was 9.212°, the injection distance was 54.514 mm, and the injection velocity was 35.561 m/s, the tooth surface heat dissipation effect was good. The helical gear injection heat dissipation experiment showed that the experimental values of the average tooth surface temperature and temperature difference were slightly smaller than the simulation values, with an error range of 0.67% to 7.28%. After optimizing the injection parameters, the average tooth surface temperature decreased by 0.28%, and the tooth surface temperature difference increased by 6.93%. The proposed strategies and methods provide theoretical support for the heat dissipation research and injection system design of helical gears.
Fluid Governing Equations
The injection lubrication process of a helical gear is a two-phase flow problem. Therefore, I selected the volume of fluid (VOF) model. I assumed that the oil and gas phases were uniformly mixed, and I ignored the thermal radiation effect of the gears and the heat change caused by the change of fluid kinetic energy. The fluid flow governing equations are described as follows. The flow of air and lubricating oil in the helical gearbox must satisfy the mass and momentum conservation laws. To study the change of tooth surface temperature, I also considered the energy conservation equation. For oil-gas two-phase flow, the conservation equation of the flowing phase must be satisfied. In addition, I applied the turbulent transport equation and considered the convective heat transfer between the tooth surface and the oil.
The continuity equation is expressed as:
$$
\frac{\partial \rho}{\partial t} + \nabla \cdot (\rho \mathbf{u}) = 0
$$
where \(\rho\) represents the fluid density, \(t\) is the calculation time, and \(\mathbf{u}\) is the velocity vector.
The momentum conservation equation is given by:
$$
\frac{\partial}{\partial t}(\rho \mathbf{u}) + \nabla \cdot (\rho \mathbf{u} \mathbf{u}) = -\nabla P + \nabla \cdot \boldsymbol{\tau} + \rho \mathbf{g} + \mathbf{F}
$$
where \(P\) represents the static pressure, \(\mathbf{g}\) is the gravitational body force, and \(\mathbf{F}\) is the external body force. \(\boldsymbol{\tau}\) is the stress tensor.
The conservation equation of the flowing phase is written as:
$$
\sum_{\beta=1}^{N} r_{\beta} = 1
$$
where the subscript \(\beta\) denotes the fluid phase, \(r_{\beta}\) is the fluid volume fraction, and \(N\) is the number of fluid phases. In my study, the fluid phases are air and lubricating oil.
Considering the computational efficiency, robustness, and accuracy of the turbulence model, the standard \(k\)-\(\varepsilon\) model was widely used. The turbulent viscosity is defined as:
$$
\mu_t = \rho C_{\mu} \frac{k^2}{\varepsilon}
$$
where \(C_{\mu}\) is a model constant equal to 0.09. \(k\) represents the turbulent kinetic energy, and \(\varepsilon\) represents the turbulent dissipation rate, which are solved by their differential transport equations:
$$
\frac{\partial (\rho k)}{\partial t} + \frac{\partial (\rho k u_j)}{\partial x_j} = \frac{\partial}{\partial x_j}\left[ \left( \mu + \frac{\mu_t}{\sigma_k} \right) \frac{\partial k}{\partial x_j} \right] + P_k + P_{kb} – \rho \varepsilon + S_k
$$
$$
\frac{\partial (\rho \varepsilon)}{\partial t} + \frac{\partial (\rho \varepsilon u_j)}{\partial x_j} = \frac{\partial}{\partial x_j}\left[ \left( \mu + \frac{\mu_t}{\sigma_{\varepsilon}} \right) \frac{\partial \varepsilon}{\partial x_j} \right] + C_{\varepsilon 1} \frac{\varepsilon}{k}(P_k + C_{\varepsilon 3} P_{kb}) – C_{\varepsilon 2} \rho \frac{\varepsilon^2}{k} + S_{\varepsilon}
$$
where \(C_{\varepsilon 1}\) and \(C_{\varepsilon 2}\) are usually taken as 1.44 and 1.92. \(P_k\) is the turbulent kinetic energy generated by the average velocity gradient, and \(P_{kb}\) is the turbulent kinetic energy generated by buoyancy. \(\sigma_k\) and \(\sigma_{\varepsilon}\) represent the Prandtl numbers for the \(k\) and \(\varepsilon\) equations. \(S_k\) and \(S_{\varepsilon}\) are user-defined source terms.
The energy conservation equation is as follows:
$$
\frac{\partial (\rho T)}{\partial t} + \nabla \cdot (\rho \mathbf{u} T) = \nabla \cdot \left( \frac{k}{c_p} \nabla T \right) + S_T
$$
where \(T\) is the temperature, \(c_p\) is the specific heat capacity, and \(S_T\) is the viscous dissipation term.
Injection lubrication can be used for both lubrication and heat dissipation of gears. During the injection process, the gear mainly dissipates heat through convective heat transfer between the oil and the tooth surface. When the oil flows over the gear surface, the heat transfer is convective heat transfer, which can be solved by Newton’s law of cooling:
$$
q = h (t_w – t_f)
$$
where \(q\) is the heat flux density, \(h\) is the convective heat transfer coefficient, \(t_w\) is the gear surface temperature, and \(t_f\) is the oil-gas temperature.
Overset Mesh Method
The overset mesh method uses overlapping and sharing technology to exchange information. The computational domain consists of two parts: a component domain and a background domain. The component domain is composed of the fluid domain rotating with the gears, and the background domain is the gearbox region without gears. The two regions exchange cell information through the created overset interface. The calculation steps of the overset mesh method include hole cutting, overlap minimization, and donor search. Hole cutting is the process of marking cells inside the body and outside the computational domain as hole cells. Overlap minimization is achieved by converting additional solver cells into receptor cells. Donor search is the search for other grids to obtain valid solver cells for each receptor. Each receptor must have at least one valid donor cell. The overset mesh method is implemented by four types of grid cells: active cells, receptor cells, donor cells, and hole cells. Active cells participate in the solution of the governing equations. Receptor cells receive information from donor cells. Donor cells provide interpolation information for the grid receptor cells. Hole cells do not participate in the calculation. After searching and matching donor cells, data are transferred between boundary points and donor cells. I used the boundary exchange method for interpolation management. Cell data are transferred between the component mesh and the background mesh. Each active cell corresponds to an adjacent receptor cell. Based on the information provided by the receptor cell, the center value of the active cell is calculated, and the surface flux between the solving cell and the receptor cell is solved. In addition, several donor cells are used to determine the contribution value of the receptor cell.
Sliding Mesh Method
The unsteady problems simulated by the sliding mesh method are mostly time-periodic, and this method can effectively analyze the transient distribution of the gear flow field and temperature field. Unlike the dynamic mesh method, the sliding mesh method does not need to rebuild the mesh when constructing the helical gear fluid domain. The sliding mesh method realizes motion through the rotation of related components and realizes timely information transfer through the interaction interface. The sliding mesh cell region and its interaction region can be of any shape, as long as the boundaries of the two regions are based on the same shape. When a pair of gears meshes, it can be divided into two sliding cell regions. The sliding mesh method allows the meshes on both sides of the interaction interface to slide relative to each other, but it does not require the mesh nodes on both sides of the interaction interface to overlap. The interaction interface between the two cell regions is the hub for data transfer. The sliding mesh method is mainly used for two or more cell regions. It must be merged at the beginning of the calculation to establish the interfaces between the individual cell regions. The meshes of the individual cell regions translate or rotate relative to each other along the sliding interaction interface, thereby transferring flow field and temperature information. The sliding mesh computational domain mainly includes a stationary region, a moving region, and a sliding interaction interface between them. During model calculation, the moving region performs rotational motion, and information is transferred between the moving region and the stationary region through the sliding interaction interface.
Heat-Flow Coupling Method
During the injection lubrication process of a helical gear, the injected oil interacts with the rotating tooth surfaces. The oil-gas state near the gear teeth and the tooth surface temperature distribution affect each other. I used a finite element analysis platform to study the heat dissipation effect of helical gear tooth surfaces during injection lubrication by coupling the flow field and temperature field. The heat-flow coupling analysis process is mainly divided into the settings of a temperature field module, a flow field module, and a coupling module. The heat dissipation simulation of the helical gear tooth surface under injection lubrication mainly obtains the average temperature and temperature difference of the tooth surface. The transient temperature field module mainly loads the gear heat source, the flow field module simulates the injection lubrication process and the convective heat transfer between the gear and the surrounding air, and the coupling module transfers data between the flow field and the temperature field. In my study, the heat source term was a fixed temperature source. The flow field module simulated the injection lubrication process. The VOF model and the \(k\)-\(\varepsilon\) turbulence model were used to analyze the injection heat dissipation process under different injection angles, distances, and velocities. The interaction between temperature data and fluid data occurred in the coupling module.
| Parameter | Air | Lubricating oil |
|---|---|---|
| Density \(\rho\) (kg/m³) | 1.255 | 910.5 |
| Kinematic viscosity \(\nu\) (m²/s) | 1.2894×10⁻⁵ | 5.5861×10⁻³ |
| Thermal conductivity (W/m·K) | 0.027 | 0.144 |
| Specific heat capacity (J/kg·K) | 1013 | 1600 |
CFD Model for Helical Gear Injection Lubrication
To better simulate the injection lubrication process of helical gears, I established a meshing helical gear pair model. The geometric and working parameters of the helical gear pair are listed in the table below. The injection lubrication CFD model was constructed using the overset mesh method. The entire computational domain consisted of two parts: a component domain composed of the gears and part of the fluid wrapping them, and a background domain simulating the flow field without gear rotation. For the convenience of subsequent calculations, I established a plane \(Y=0.05\) mm near the gear meshing region. Because the geometric shape of the helical gear injection lubrication CFD model is complex, I used unstructured tetrahedral meshes to divide it. The meshes at the nozzle and near the gear meshing point were refined.
| Parameter | Driving gear / Driven gear | Unit |
|---|---|---|
| Number of teeth \(z_1/z_2\) | 20/40 | — |
| Module \(m_n\) | 1 | mm |
| Pressure angle \(\alpha_n\) | 20 | ° |
| Helix angle \(\beta\) | 15 | ° |
| Center distance \(a’\) | 33.1013 | mm |
| Face width \(B\) | 10 | mm |
| Rotational speed \(n_1/n_2\) | 18000/9000 | r/min |
The main settings for the numerical simulation of helical gear injection lubrication were as follows. I used a pressure-based solver, and the time option was set to transient. I considered the influence of gravity. The multiphase flow model was set to the VOF model, with the primary phase set to air and the secondary phase set to lubricating oil. I activated the implicit body force option. The turbulence model was the standard \(k\)-\(\varepsilon\) model, and the standard wall function was used near the wall. The nozzle inlet was a velocity boundary, and the nozzle diameter was 2.5 mm. The outlet was a pressure boundary, and the reference pressure value was set to standard atmospheric pressure. All walls used no-slip boundary conditions, that is, the wall velocity was zero. In the solution method, the pressure-velocity coupling used the standard coupled algorithm, and the gradient difference used the least-squares cell-based method. Because of the high-speed flow of oil in the gearbox, the pressure staggering option (PRESTO) was selected for interpolation. The momentum term was solved by a second-order upwind scheme.
To ensure the reliability of the simulation results, I performed a mesh independence test on the helical gear injection lubrication CFD model. When the injection velocity was 30 m/s, the injection angle was 0°, and the injection height was 30 mm, I calculated the average oil pressure on the tooth surface along the face width direction at the \(Y=0.05\) mm plane when the helical gear operated for 0.0167 ms. The relationship between the total number of mesh cells and the corresponding average oil pressure is shown in the table. When the number of meshes increased to case 3, the average oil pressure on the tooth surface tended to be stable. Therefore, in all subsequent simulations, the total number of model meshes was controlled at about 720,000.
| Case | Total mesh cells | Average oil pressure (Pa) |
|---|---|---|
| 1 | 218194 | 1378.52 |
| 2 | 569782 | 2348.19 |
| 3 | 716824 | 1973.06 |
| 4 | 1018627 | 2015.64 |
| 5 | 1454923 | 1899.65 |
I also compared the overset mesh and dynamic mesh methods for solving the average oil volume fraction and oil pressure on the tooth surface when the driving gear rotated for one meshing cycle. The results show that the numerical differences between the two methods are very small, which proves that the overset mesh method is effective for solving the oil distribution problem of helical gears. In my computer configuration, the CPU was an Intel Core i7-3770 at 3.4 GHz, and the RAM was 8 GB. Compared with the dynamic mesh method, the calculation time of the overset mesh method was reduced by 52.89%.
| Method | Average oil volume fraction | Average oil pressure (Pa) | Calculation time (h) |
|---|---|---|---|
| Overset mesh | 0.34 | 1973.06 | 22.8 |
| Dynamic mesh | 0.32 | 1961.34 | 48.4 |
Oil Spreading Analysis
I analyzed the oil spreading on the tooth surface at different times. When the helical gear operates, the oil ejected from the nozzle splashes around the gear teeth. Due to the centrifugal force and axial force of the gear, the lubricating oil sprayed onto the tooth surface deposits and diffuses along the inclined direction of the tooth surface, resulting in uneven oil distribution on the tooth surface. Blocked by the high-speed airflow near the gear teeth, the momentum and energy of the oil decrease, so a small amount of lubricating oil enters the gear meshing area. In addition, the oil distribution under the nozzle becomes denser and denser, and the lubricating oil is rarely distributed on both sides of the face width. I also analyzed the oil distribution along the face width direction of the driving gear and driven gear at different gear rotation angles. The results show that the oil volume fraction on the driven gear tooth surface is slightly higher than that on the driving gear. The distribution of oil volume fraction on the tooth surface is similar to a normal distribution, large in the middle and small on both sides. The oil is mainly distributed on the tooth surface below the nozzle and gradually decreases along both sides of the face width. There is even no lubricating oil distribution at the tooth profile edges, showing oil starvation. As the gear rotates, the lubricating oil on the tooth surface first increases slowly and then increases rapidly.
Injection Parameter Optimization
To improve the tooth surface lubrication performance under helical gear injection lubrication, I studied the oil volume fraction and oil pressure distribution under different injection angles during one gear meshing cycle. The relevant parameter settings were as follows: injection velocity 30 m/s, time step \(3.34×10^{-7}\) s, and iteration steps 500. Because of the high-speed airflow blocking near the gear teeth, lubricating oil is difficult to enter the gear meshing area, resulting in oil shortage on the tooth surface. Therefore, I tilted the injection direction toward the driving gear side and selected five injection angles (0°, 2.5°, 5°, 7.5°, and 10°) for numerical simulation to obtain the optimal injection angle and improve poor gear lubrication.
| Injection angle (°) | Driving gear average oil volume fraction | Driven gear average oil volume fraction |
|---|---|---|
| 0 | 0.686 | 0.831 |
| 2.5 | 0.701 | 0.912 |
| 5 | 0.723 | 0.958 |
| 7.5 | 0.739 | 0.983 |
| 10 | 0.712 | 0.946 |
I found that the oil distribution along the face width is similar to a normal distribution. The oil volume fraction on the tooth surface is the largest at the position below the nozzle and gradually decreases along both sides of the face width. With the increase of injection angle, the oil volume fraction on the driving gear tooth surface first decreases and then increases, while the lubricating oil on the driven gear decreases with the increase of injection angle. Among the five given injection angles, it is difficult to select an optimal angle that makes both the driving gear and driven gear have large oil volume fractions. Therefore, I also considered the oil pressure distribution on the tooth surface. I used the oil pressure near the gear meshing area as a criterion for judging the gear lubrication performance. I established a plane \(Y=0.05\) mm near the meshing area for flow characteristic analysis. The oil pressure peak appeared near \(Z=-1\) mm, and the maximum oil pressure along the face width direction appeared near \(Z=-1\) mm. Under the extrusion of lubricating oil, the oil pressure deposited at \(Z=1\) mm. When the injection angle was 7.5°, the oil pressure was the largest and the distribution along the face width direction was wider. Under different injection angles, the oil pressure extreme value appeared on the plane \(Y=0.05\) mm near the meshing area. When the injection angle was 7.5°, the maximum positive pressure of the driven gear and the maximum negative pressure of the driven gear were the largest, which were 270965 Pa and -5266.33 Pa, respectively. The maximum negative pressure of the driving gear and the maximum positive pressure of the driven gear were also relatively large. Therefore, combining the conclusions of oil volume fraction and oil pressure, I obtained that when the injection angle was 7.5°, the tooth surface lubrication performance was good.
I also studied the oil volume fraction and oil pressure distribution of helical gears under different injection velocities (25, 30, 35, 40, and 45 m/s) when the gear speed was constant. The results show that the oil volume fraction on the driving gear increases with the increase of injection velocity, and the lubricating oil on the driven gear also increases with the increase of injection velocity. The oil volume fraction reached its maximum value when the injection velocity was 45 m/s. The reason may be that with the increase of injection velocity, the momentum and energy of the lubricating oil increase, which can improve the deflection of the lubricating oil to the driven gear. The ability of the injection jet to resist the high-speed airflow near the gear teeth is enhanced, and the lubricating oil enters the gear meshing area more smoothly, thereby improving the lubrication performance of the tooth surface. When the gear rotated for one meshing cycle, the oil volume fraction on the driving gear tooth surface was the largest at an injection velocity of 45 m/s, and the oil volume fraction on the driven gear tooth surface also reached the maximum at 45 m/s. I also plotted the oil pressure distribution along the face width direction. The oil pressure directly below the nozzle was the largest and decreased along both sides of the face width. When the injection velocity was 45 m/s, the oil pressure peak and density distribution were the largest. Based on the analysis of oil volume fraction and oil pressure, I concluded that when the injection velocity was 45 m/s, the lubrication performance of the tooth surface was enhanced.
| Injection velocity (m/s) | Driving gear maximum oil volume fraction | Driven gear maximum oil volume fraction |
|---|---|---|
| 25 | 0.529 | 0.755 |
| 30 | 0.686 | 0.831 |
| 35 | 0.721 | 0.902 |
| 40 | 0.754 | 0.928 |
| 45 | 0.779 | 0.947 |
Flow Field Characteristics
According to the analysis in the previous sections, I selected an injection angle of 7.5° and an injection velocity of 45 m/s within the tested range. To study the influence of optimized injection parameters on oil flow characteristics and gear lubrication performance, I studied the streamline distribution and oil distribution in the helical gearbox during one full rotation of the gear. The streamline distribution can intuitively reflect the movement of the lubricating oil entering the entire helical gearbox from the injection port. The oil distribution in the helical gearbox can reflect whether there is swirl and poor circulation. I found that the lubricating oil is sprayed from the nozzle onto the tooth surface at high speed. Under the action of the gear centrifugal force, the lubricating oil is thrown to both sides of the gear teeth. Because the speed of the driving gear exceeds that of the driven gear, most of the lubricating oil is thrown near the driven gear, and the oil splashing phenomenon is obvious. Blocked by the high-speed airflow, the oil path near the gear teeth is cut off, and a large amount of lubricating oil appears near the driving gear. Due to the rotation of the gear, the oil near the driven gear is blocked, and a large amount of oil deposits below the driving gear. After the gear rotates one full circle, a swirl is found below the driving gear. Because the rotation of the gear and the surrounding airflow hinder the oil flow, a large amount of lubricating oil cannot be sprayed onto the tooth surface, resulting in oil deposition below the driving gear. The maximum oil volume fraction appeared in the gear meshing area. Affected by the gear centrifugal force and the speed difference, the flow direction of the lubricating oil deviated from the injection direction, forming oil deflection. The lubricating oil in the helical gearbox gradually increased with the rotation of the gear. Due to the blocking of the high-speed airflow near the gear teeth, a small amount of lubricating oil entered the gear meshing area. In addition, the lubricating oil deposited below the driving gear. After the gear rotated a full circle, the lubricating oil was rarely distributed on the driven gear side. A swirl appeared below the driving gear, causing a large amount of lubricating oil to deposit.
| Case | Injection angle (°) | Injection velocity (m/s) | Maximum oil volume fraction (driving) | Maximum oil volume fraction (driven) | Improvement (%) |
|---|---|---|---|---|---|
| 1 | 0 | 30 | 0.686 | 0.831 | — |
| 2 | 7.5 | 30 | 0.739 | 0.983 | 7.726 (driving), 18.291 (driven) |
| 3 | 7.5 | 25 | 0.529 | 0.755 | — |
| 4 | 7.5 | 45 | 0.779 | 0.947 | 47.259 (driving), 25.430 (driven) |
Flow Field Experimental Verification
I designed an injection lubrication test rig. The test gear material was PA6, with a density of 1.13 g/cm³, an elastic modulus of 2.23 GPa, a shear modulus of 0.97 GPa, and a Poisson’s ratio of 0.34. A high-speed digital camera was used to capture the helical gear injection process, with a shooting frequency of 5000 frames per second and a resolution of 1024×1024 pixels. The injection height was fixed, and the oil distribution on the tooth surface was observed through an endoscope. A universal fixture was used to adjust the injection angle, and the injection velocity was controlled by an oil-gas velocity adjustment knob. The injection lubrication experiment aimed to study the injection process of helical gears and the influence of injection parameters on gear lubrication. The gear and injection parameters were consistent with the settings in the numerical simulation. The high-pressure lubricating oil was sprayed onto the tooth surface, and due to the rapid rotation of the gear, the oil was thrown to both sides of the gear teeth. Under the influence of the centrifugal force, axial force, and the surrounding high-speed airflow, the oil splashed above the meshing area, and the oil spreading and deposition on the tooth surface were less. Therefore, the conclusion that the oil spreading on the tooth surface was poor was verified.
I used image recognition technology to identify the oil distribution on the helical gear tooth surface. The calculation principle is as follows. Based on the single-tooth region image, I studied the oil distribution and oil pixels along the vertical direction and the face width direction of the gear. The pixel grid was established according to the pixel matrix in Matlab. First, I segmented the gear image to obtain the single-tooth region, then performed preprocessing, binarization, and background removal to extract oil pixels. Then, I calculated the oil pixel ratio in each grid according to the following equation:
$$
\phi_{ij} = \frac{P_{ab}}{S}
$$
where \(\phi_{ij}\) is the oil volume fraction in the pixel grid, and \(S\) is the area of the single-tooth region. \(a\) and \(b\) are the length and width of the pixel grid, respectively, and \(P_{ab}\) is the oil pixel in the single pixel grid region. Finally, the average oil volume fraction of a single tooth was calculated by:
$$
\phi_{\text{Ave}} = \frac{1}{n m} \sum_{i=1}^{n} \sum_{j=1}^{m} \phi_{ij}
$$
where \(\phi_{\text{Ave}}\) is the average oil volume fraction on the tooth surface. \(n\) and \(m\) represent the number of pixel grids in the face width and vertical directions, respectively. I compared the average oil volume fraction of the tooth surface obtained by simulation and experiment. The experimental value of the average oil volume fraction of a single tooth was slightly smaller than the simulation value, with an error range of 1.67% to 5.97%. These findings verified the reliability and adaptability of the helical gear injection lubrication model.
Static Heat-Flow Coupling
I analyzed the injection heat dissipation of helical gears. The lubrication and heat dissipation method commonly used in helical gear transmission systems is circulating injection lubrication. High-pressure oil is sprayed radially onto the tooth surface, and all meshing surfaces of the gear undergo one injection lubrication in any rotation cycle. Under the combined action of transient heat conduction and forced convection heat transfer, intermittent projection heat dissipation occurs on the tooth surface. Using the characteristics of large curvature radius and low curvature of the gear tooth surface, I converted the tooth surface heat transfer into a plane problem. The oil droplets hit the tooth surface at a high speed and spread rapidly on the tooth surface. Because the injected oil droplets have high speed and large kinetic energy, their penetration ability is strong, and they can take away a large amount of heat, enhancing the heat dissipation effect of the tooth surface.
For the static heat-flow coupling simulation, I established a calculation model for static tooth surface injection heat dissipation. The nozzle was a circular aperture as the inlet of lubricating oil, and the nozzle aperture was 0.0025 m. Because the lubricating oil splashes in the gear contact area during real injection, I set the four walls of this model as open walls. The bottom of the model was the heat-generating tooth surface in the meshing area, and it was set as a temperature boundary. I used unstructured tetrahedra to mesh it and refined the mesh in the injection port area. I used the oil-gas two-phase flow lubrication method, with air as the primary phase and CD40 lubricating oil as the secondary phase. The thermal property parameters are listed in the table.
| Parameter | Air | Lubricating oil (CD40) |
|---|---|---|
| Density (kg/m³) | 1.09 | 883 |
| Thermal conductivity (W/m·K) | 0.027 | 0.144 |
| Specific heat capacity (J/kg·K) | 1013 | 1600 |
| Kinematic viscosity (m²/s) | 1.95×10⁻⁵ | 5.56×10⁻² |
To study the influence of injection parameters on tooth surface heat dissipation, I studied the flow characteristics and temperature distribution of static gears under a set of injection parameters (injection angle 60°, injection velocity 30 m/s, and injection distance 60 mm) using the static heat-flow coupling method. The streamline distribution of the injection jet showed that two vortices formed on both sides of the injection jet, and the oil velocity gradually decreased along the injection direction. The velocity vector distribution of the injection jet showed that the oil velocity was the largest at the injection point and gradually decreased with the increase of the injection distance. The convective heat transfer coefficient distribution on the tooth surface decreased gradually from the center below the oil injection to the surrounding sides. The tooth surface temperature distribution showed that the oil velocity in the central part of the tooth surface was relatively large, and the oil splashed to both sides of the tooth surface. The tooth surface temperature gradually decreased along both sides of the injection point, and the temperature dropped fastest in the central part of the injection.
I established a static gear injection heat dissipation test rig to explore the influence of injection parameters (injection angle, injection distance, and injection velocity) on tooth surface heat dissipation. A K-type thermocouple was placed on the gear surface and connected to a temperature controller for tooth surface temperature measurement. The gear was fixed on the test rig and heated to a certain temperature (323.15 K) by a heating plate. While maintaining room temperature (293.15 K) and the injection point position unchanged, I measured the temperature change of the tooth surface within the same time (180 s). The test rig included five parts: an air compressor, an injection system, a control device, a test system, and an oil return system. The air compressor was the power source of the injection system. The injection system included an oil tank, an injection pipeline, and an injection nozzle. The control device consisted of a solenoid valve, a pressure valve, and a universal fixture. The test system consisted of a temperature sensor and a temperature controller. The oil return system included an oil collection device, an oil return pipe, and an oil return pump. The specimen material was 17CrNiMo6 gear steel. Because metal materials conduct heat quickly, I placed a heat insulation board on the workbench to avoid direct contact with the workbench surface, which would otherwise adversely affect the test results. Because foam board has lower thermal conductivity than metal, I selected it as the heat insulation material. I marked the standard position of the injection point on the specimen surface. The gear was heated by a heating plate at 323.15 K. The thermocouple data were transmitted to the data processing system through the temperature controller. Finally, I measured the tooth surface temperatures under different injection angles, injection distances, and injection velocities and drew the corresponding tooth surface heat dissipation curves.
| Factor | Values | Other conditions |
|---|---|---|
| Injection angle (°) | 0, 10, 20, 30, 40 | Injection distance 60 mm; injection velocity 30 m/s |
| Injection distance (mm) | 30, 45, 60, 75, 90 | Injection angle 10°; injection velocity 30 m/s |
| Injection velocity (m/s) | 15, 20, 25, 35, 45 | Injection angle 10°; injection distance 60 mm |
To evaluate the influence of room temperature on gear heat dissipation, I conducted a natural heat dissipation experiment of the gear. Under the conditions of an injection angle of 10°, an injection velocity of 30 m/s, and an injection distance of 60 mm, I measured the tooth surface heat dissipation curve within 900 s. The natural cooling rate of the gear at room temperature was significantly lower than the injection cooling rate. Therefore, the influence of room temperature during the injection heat dissipation process can be ignored. I also studied the tooth surface heat dissipation curves under different injection angles. When the injection angle was 0°, the gear surface heat dissipation effect was the worst. This is because the nozzle was located directly above the meshing area, and the injection jet flowed along the gear axis. The oil could only contact the gear end face, thereby shortening the contact time between the oil and the tooth surface. That is, the heat exchange time of the tooth surface was reduced, resulting in an unsatisfactory gear heat dissipation effect. When the injection angle was greater than 0° and biased toward the driving gear side, as the injection angle decreased, the convective heat transfer between the tooth surface and the oil accelerated, and the gear heat dissipation effect was enhanced. The reason is that when the injection angle decreases, the tangential component velocity of the injection jet increases, the flow velocity of the oil on the tooth surface increases, the normal component velocity decreases, and the oil splashing is less. The oil flow rate on the entire tooth surface increases, and the tooth surface heat dissipation is accelerated.
I also studied the tooth surface heat dissipation curves under different injection distances. In the same time, the contact time between the oil and the tooth surface decreased with the increase of the injection distance, and the heat exchange time of the tooth surface decreased, resulting in poor tooth surface heat dissipation. When the injection distance was small, the loss along the oil jet was small, the oil velocity reaching the tooth surface was large, and the diffusion degree was small, so it could better perform convective heat transfer with the tooth surface, thereby improving the tooth surface heat dissipation effect. I also studied the tooth surface heat dissipation curves under different injection velocities. With the increase of injection velocity, the tooth surface temperature gradually decreased. This is because with the increase of injection velocity, the lubricating oil has more momentum and kinetic energy, which increases the heat exchange rate between the oil and the tooth surface. At the same time, the smaller the diffusion degree of the oil, the easier it is for the lubricating oil to contact the tooth surface, which is more conducive to tooth surface heat dissipation. The simulation results of the heat dissipation rate under different injection angles, distances, and velocities were basically consistent with the experimental results, which verified the reliability of the static gear heat dissipation model.
Dynamic Heat-Flow Coupling
During the gear meshing process, the flow field and temperature field distribution inside the gearbox are complex, and the interaction between the lubricating oil and air affects the heat dissipation of the gear surface. In the previous section, I used the static heat-flow coupling method to study the influence of injection parameters on the heat dissipation of static gears. In this section, I used the dynamic heat-flow coupling method to explore the flow characteristics and temperature distribution of helical gears under conventional injection parameters (injection angle 0°, injection distance 60 mm, injection velocity 25 m/s), providing guidance for exploring the influence of injection parameters on the heat dissipation of helical gears.
For the temperature field module, I used a pair of meshing helical gears. The geometric and working parameters are listed in the table. The material parameters of the helical gear are also listed. After using local mesh refinement on the gear surface and performing mesh independence verification, I obtained a tetrahedral mesh model with a minimum size of 0.04 mm, a unit size of 1 mm, and a maximum size of 4 mm. The flow field module simulated the process of lubricating oil being injected from the nozzle into the meshing area. Because the temperature module already existed independently, this module retained the flow field calculation by suppressing the solid part of the gear. I modeled it using the sliding mesh method. The model was mainly composed of a gearbox region and a gear region. The gear region was the moving region, and the gearbox region was the stationary region. I established interaction interfaces between the driving gear and the gearbox and between the driven gear and the gearbox, respectively, to conduct information transfer and interaction. I used the unstructured tetrahedral mesh method to mesh the fluid domain model of helical gear injection heat dissipation. The gear domain, especially near the meshing area, was refined.
| Geometric and working parameter | Value | Unit |
|---|---|---|
| Number of teeth \(z_1/z_2\) | 20/40 | — |
| Module \(m_n\) | 2 | mm |
| Normal pressure angle \(\alpha_n\) | 20 | ° |
| Helix angle \(\beta\) | 15 | ° |
| Face width \(B\) | 8/8 | mm |
| Rotational speed \(n_1/n_2\) | 12000/6000 | r·min⁻¹ |
| Parameter | Value | Unit |
|---|---|---|
| Gear material | 17CrNiMo6 | — |
| Specific heat capacity \(c_g\) | 477 | J·kg⁻¹·K⁻¹ |
| Elastic modulus \(E_g\) | 210 | GPa |
| Density \(\rho_g\) | 7850 | kg·m⁻³ |
| Thermal conductivity \(k_g\) | 42.7 | W·m⁻¹·K⁻¹ |
| Poisson’s ratio \(\gamma\) | 0.3 | — |
The main settings for the numerical simulation of helical gear injection heat dissipation were as follows. The injection hole was a velocity boundary condition, and the nozzle aperture was 2.5 mm. The meshing tooth surface was a friction heat generation surface, and the tooth surface temperature was set to 323.15 K. All other walls used no-slip boundary conditions, that is, the wall velocity was zero. In the solution method, I used the standard coupled algorithm for pressure-velocity coupling, and used the least-squares cell-based method, PRESTO, and second-order upwind discretization to solve the gradient, pressure term, and momentum term, respectively. Finally, I initialized the entire fluid domain temperature to 293.15 K using the standard method, initialized the pressure in the entire model to normal atmospheric pressure, and initialized the lubricating oil volume fraction to 0. To ensure the reliability of the simulation results, I performed a mesh independence verification on the model. I extracted the average temperature and temperature difference of the tooth surface with the number of mesh cells as the only independent variable. When the number of meshes increased to \(1.5×10^6\), the average temperature and temperature difference of the tooth surface tended to be stable. At this time, the error of the average tooth surface temperature was 0.10%, and the error of the tooth surface temperature difference was 0.95%. Therefore, in the subsequent solution, the total number of mesh cells of the model was controlled at about 1.5 million. I also compared the solution results of the dynamic mesh and sliding mesh methods. The results show that the average temperature and temperature difference of the tooth surface obtained by the two methods were not much different, which proved that the sliding mesh method is effective for constructing the helical gear injection heat dissipation model. Compared with the dynamic mesh method, the calculation time of the sliding mesh was reduced by 33.49%.
| Method | Average temperature (K) | Temperature difference (K) | Calculation time (h) |
|---|---|---|---|
| Dynamic mesh | 306.5 | 29.9 | 62.4 |
| Sliding mesh | 306.4 | 30.1 | 41.5 |
I analyzed the velocity vector distribution of the helical gearbox. During the process of lubricating oil being injected into the gearbox, the flow velocity increased relatively smoothly. The velocity vectors were denser near the gear teeth and in the meshing area, and the flow velocity at some tooth roots was zero. The maximum flow velocity region was located below the nozzle and on the left side of the gearbox. The streamline distribution of the helical gearbox intuitively reflected the movement of the lubricating oil entering the entire helical gearbox. The lubricating oil was sprayed from the nozzle to the tooth surface. With the rotation of the gear, the flow field inside the helical gearbox changed greatly. Due to the rapid rotation of the gear, oil splashing occurred above the gear, and most of the lubricating oil was thrown to the upper and lower sides of the gear. The surrounding flow field hindered the flow of the lubricating oil, resulting in a large amount of lubricating oil not being sprayed onto the tooth surface. Because the speed of the driving gear was greater than that of the driven gear, a large amount of lubricating oil was thrown off the driving gear. A swirl appeared at the lower part of the driving gear, the oil fluidity was poor, and local oil deposition occurred. The oil volume fraction of the gear was mostly between 0.25 and 0.5. Due to the centrifugal force of the gear and the obstruction of the high-speed airflow around the gear teeth, the flow direction of the lubricating oil deviated from the injection direction. With the rapid rotation of the gear, the oil distribution on the tooth surface was very small. The maximum temperature region was distributed above the gear, and the temperature difference of the driven gear was greater than that of the driving gear. The reason is that the speed of the driving gear was higher than that of the driven gear, and most of the oil injected into the driving gear was thrown to the driven gear. Blocked by the high-speed oil-gas near the gear, the heat exchange times between the lubricating oil and the tooth surface were reduced, and the tooth surface cooling effect was not good. I concluded that due to the obstruction of high-speed airflow, most of the oil rarely entered the gear meshing area. Due to the axial force and centrifugal force of the gear, the lubricating oil injected into the tooth surface was also thrown to both sides of the gear, resulting in poor fluidity of the lubricating oil. In general, the injection angle of the gear was 0°, and the injection velocity and injection distance were also determined by experience, which led to poor injection lubrication effect of the gear and unsatisfactory heat dissipation of the tooth surface.
Regression Orthogonal Design
Based on the simulation and experimental results of static gear injection heat dissipation, I found that changes in injection angle, injection distance, and injection velocity can all affect the change of tooth surface temperature. Optimizing injection parameters can improve the heat dissipation performance of the tooth surface. Under conventional injection parameter combinations, I analyzed the flow field and temperature field distribution characteristics of helical gear injection lubrication. The results showed that when the gear speed was too high and the injection parameters were unreasonable, it was difficult for the lubricating oil to enter the gear meshing area, the convective heat transfer ability between the lubricating oil and the tooth surface was weak, and the lubrication and heat dissipation effects of the gear were poor. However, the adjustment of a single injection parameter is not easy to operate for the injection cooling system, and its influence on the tooth surface temperature difference is also small. Therefore, under multi-parameter conditions, there is an urgent need to find a reasonable combination of injection parameters to improve the heat dissipation performance of the gear transmission system. I explored the influence of different injection angles, injection distances, and injection velocities and their interactions on the heat dissipation effect of the tooth surface. All experimental operations kept the gear speed, rotation time, and other factors constant, and the ambient temperature and inlet temperature were both 298.15 K.
I used the regression orthogonal experiment method to design the injection scheme and explored the influence of injection parameter combinations on the heat dissipation of helical gear tooth surfaces. I took the average tooth surface temperature (\(Y_1\)) and temperature difference (\(Y_2\)) as evaluation indices, and the injection angle (\(\alpha\)), injection distance (\(H\)), and injection velocity (\(V\)) as the main factors (denoted as \(X_1\), \(X_2\), and \(X_3\), respectively). I selected three different injection angles (0, 10, 20°), injection distances (30, 60, 90 mm), and injection velocities (25, 35, 45 m/s). The factor level coding is shown in the table.
| Factor | -1 | 0 | 1 |
|---|---|---|---|
| Injection angle (°) | 0 | 10 | 20 |
| Injection distance (mm) | 30 | 60 | 90 |
| Injection velocity (m/s) | 25 | 35 | 45 |
For quantitative research, I extracted two evaluation indices of tooth surface heat dissipation performance: the average tooth surface temperature and the tooth surface temperature difference, which were solved by the dynamic heat-flow coupling method. The experimental results were analyzed using the Box-Behnken design method. Design-Expert was used for regression analysis, single-variable analysis, and response surface analysis of the experimental data to explore the correlation between injection parameters and the influence of interaction effects. The experimental scheme and results are shown in the table.
| Model | \(X_1\) (°) | \(X_2\) (mm) | \(X_3\) (m/s) | \(Y_1\) (K) | \(Y_2\) (K) |
|---|---|---|---|---|---|
| 1 | 10 | 60 | 35 | 306.5 | 30.3 |
| 2 | 0 | 90 | 35 | 307.9 | 27.4 |
| 3 | 10 | 60 | 35 | 306.4 | 30.2 |
| 4 | 10 | 60 | 35 | 306.8 | 30.4 |
| 5 | 0 | 60 | 25 | 307.6 | 28.7 |
| 6 | 0 | 60 | 45 | 308.4 | 30.4 |
| 7 | 10 | 90 | 25 | 307.3 | 27.8 |
| 8 | 20 | 60 | 25 | 308.5 | 28.2 |
| 9 | 10 | 60 | 35 | 307.4 | 30.5 |
| 10 | 20 | 60 | 45 | 307.8 | 28.5 |
| 11 | 20 | 90 | 35 | 307.7 | 27.4 |
| 12 | 10 | 30 | 45 | 308.1 | 30.1 |
| 13 | 10 | 60 | 35 | 306.5 | 31.6 |
| 14 | 0 | 30 | 35 | 307.5 | 28.8 |
| 15 | 20 | 30 | 35 | 307.6 | 28.6 |
| 16 | 10 | 30 | 25 | 307.2 | 28.2 |
| 17 | 10 | 90 | 45 | 307.8 | 28.3 |
To verify the validity of the experimental results, I performed residual analysis and feasibility analysis on the calculated average tooth surface temperature and temperature difference data. The residual normal probability distribution plots of the average tooth surface temperature and temperature difference showed that the data points could be fitted by a straight line and were roughly distributed on both sides of the line. The residual versus predicted value plots showed that the data points were scattered and irregular, and all were between -4.81963 and 4.81963. The predicted values of the average tooth surface temperature and temperature difference were close to the actual experimental values, indicating that the predicted values of the average tooth surface temperature and temperature difference had a good correspondence with the actual values. These analyses proved the accuracy and reliability of the experimental results and showed that the injection heat dissipation scheme designed by the regression orthogonal method was feasible, providing a guarantee for the subsequent optimization design of injection parameters.
Regression Analysis
I performed quadratic nonlinear fitting on the average tooth surface temperature \(Y_1\) and temperature difference \(Y_2\) with the injection angle \(X_1\), distance \(X_2\), and velocity \(X_3\) and established regression equations. To ensure the credibility of the regression model, I performed variance analysis and model significance verification on the equations. The regression equations are:
$$
Y_1 = 306.72 + 0.025 X_1 + 0.0375 X_2 + 0.1875 X_3 – 0.075 X_2 X_3 – 0.375 X_2^2 – 0.1 X_3^2 + 0.715 X_1^2 + 0.24 X_1 X_2 + 0.64 X_1 X_3
$$
$$
Y_2 = 30.6 – 0.325 X_1 – 0.6 X_2 + 0.55 X_3 + 0.05 X_1 X_2 – 0.35 X_1 X_3 – 0.35 X_2 X_3 – 1.1 X_1^2 – 1.45 X_2^2 – 0.55 X_3^2
$$
The variance statistics of the average tooth surface temperature are shown in the table. The P-value of the regression model for the average tooth surface temperature was less than 0.05, indicating significance. The P-value of the lack-of-fit term was greater than 0.05, indicating that it was not significant, which means that the average tooth surface temperature model had good reliability. Through variance analysis, the mean squares of \(X_1\), \(X_2\), and \(X_3\) were 0.005, 0.01125, and 0.28125, respectively. The order of their influence on the average temperature was \(X_3 > X_2 > X_1\), that is, the order of influence of injection parameters on the average tooth surface temperature was injection velocity > injection distance > injection angle.
| Source | Sum of squares | Degrees of freedom | Mean square | F-value | P-value |
|---|---|---|---|---|---|
| \(X_1\) | 0.005 | 1 | 0.005 | 0.0364 | 0.8540 |
| \(X_2\) | 0.0112 | 1 | 0.01125 | 0.0820 | 0.7829 |
| \(X_3\) | 0.28125 | 1 | 0.28125 | 2.0497 | 0.1953 |
| \(X_1X_2\) | 0.0225 | 1 | 0.0225 | 0.1640 | 0.6976 |
| \(X_1X_3\) | 0.5625 | 1 | 0.5625 | 4.0994 | 0.0826 |
| \(X_2X_3\) | 0.04 | 1 | 0.04 | 0.2915 | 0.6060 |
| \(X_1^2\) | 2.15 | 1 | 2.15 | 15.6873 | 0.0055 |
| \(X_2^2\) | 0.2425 | 1 | 0.2425 | 1.7675 | 0.2254 |
| \(X_3^2\) | 1.72 | 1 | 1.72 | 12.5689 | 0.0094 |
| Regression model | 5.43 | 9 | 0.6039 | 4.4009 | 0.0318 |
| Total error | 0.9605 | 7 | 0.1372 | ||
| Lack of fit | 0.2925 | 3 | 0.0975 | 0.5838 | 0.6566 |
| Pure error | 0.668 | 4 | 0.167 | ||
| Total | 6.4 | 16 |
The variance statistics of the tooth surface temperature difference are shown in the table. The P-value of the regression model for the tooth surface temperature difference was less than 0.05, representing significance. The P-value of the lack-of-fit term was greater than 0.05, indicating that it was not significant. Therefore, the tooth surface temperature difference model had high reliability. Through variance analysis, the mean squares of \(X_1\), \(X_2\), and \(X_3\) were 0.845, 2.88, and 2.42, respectively. The order of their influence on the average temperature was \(X_2 > X_3 > X_1\), that is, the injection distance had the greatest influence on the average tooth surface temperature, followed by the injection velocity, and the injection angle had the smallest influence.
| Source | Sum of squares | Degrees of freedom | Mean square | F-value | P-value |
|---|---|---|---|---|---|
| \(X_1\) | 0.845 | 1 | 0.845 | 3.0411 | 0.1247 |
| \(X_2\) | 2.88 | 1 | 2.88 | 10.3650 | 0.0147 |
| \(X_3\) | 2.42 | 1 | 2.42 | 8.7095 | 0.0214 |
| \(X_1X_2\) | 0.01 | 1 | 0.01 | 0.0360 | 0.8549 |
| \(X_1X_3\) | 0.49 | 1 | 0.49 | 1.7635 | 0.2259 |
| \(X_2X_3\) | 0.49 | 1 | 0.49 | 1.7635 | 0.2259 |
| \(X_1^2\) | 5.0947 | 1 | 5.0947 | 18.3358 | 0.0036 |
| \(X_2^2\) | 8.8526 | 1 | 8.8526 | 31.8604 | 0.0008 |
| \(X_3^2\) | 1.2737 | 1 | 1.2737 | 4.5840 | 0.0695 |
| Regression model | 23.8562 | 9 | 2.6507 | 9.5397 | 0.0035 |
| Total error | 1.945 | 7 | 0.2779 | ||
| Lack of fit | 0.645 | 3 | 0.215 | 0.6615 | 0.6176 |
| Pure error | 1.3 | 4 | 0.325 | ||
| Total | 25.8012 | 16 |
After verifying the significance of the average tooth surface temperature model \(Y_1\) and the temperature difference model \(Y_2\), I substituted the injection parameter values into the regression equations to calculate the predicted average tooth surface temperature and temperature difference. By comparing the calculated average tooth surface temperature and temperature difference with the actual experimental values, I verified the accuracy of the average temperature and temperature difference regression models. The experimental and predicted values of the 17 groups of average tooth surface temperature models were not much different. The average error between the predicted average temperature and the experimental value was 0.06%, the maximum error was 0.22%, and the minimum error was only 0.01%, indicating that the average tooth surface temperature regression model had high reliability. The experimental and predicted values of the 17 groups of tooth surface temperature difference models were also not much different. The overall average error between the predicted temperature difference and the experimental value was 0.88%, and the maximum error did not exceed 3.5%, indicating that the tooth surface temperature difference regression model had high reliability.
Single-Factor Analysis
I analyzed the average temperature and temperature difference of the tooth surface under different injection angles. With the increase of the injection angle, the average tooth surface temperature first decreased and then increased, and the tooth surface temperature difference first increased and then decreased. The reason for these differences is that when the injection angle was 0° to 5°, the high-speed airflow around the gear had a great influence on the heat dissipation of the lubricating oil. Because the speed of the driving gear was greater than that of the driven gear, the lubricating oil deflected toward the driven gear near the meshing point. The lubricating oil sprayed from the nozzle was blocked by the gear teeth, and it was difficult for the lubricating oil to be injected into the meshing area for convective heat transfer with the tooth surface. The convective heat transfer ability between the lubricating oil and the tooth surface was weak, resulting in a high average tooth surface temperature and a small temperature difference. When the injection angle was too large (greater than 15°), most of the lubricating oil was directly sprayed onto the driving gear tooth surface first. Under the action of the gear centrifugal force, the lubricating oil splashed around the gear teeth and then reached the driven gear tooth surface and the gear meshing area, resulting in unsatisfactory tooth surface heat dissipation. When the injection angle was appropriate (5° to 10°), the airflow at the edges of the two gears had a similar effect on the lubricating oil, the oil deflection was small, and a certain amount of lubricating oil could overcome the obstruction of the high-speed airflow and the centrifugal force. The convective heat transfer between the oil and the tooth surface was good, the average tooth surface temperature was the lowest, and the tooth surface temperature difference was the largest. The 95% confidence interval was used to estimate the range of injection parameter values, which means that the probability that the injection parameters selected in the experiment were within the range of the overall injection parameters was estimated at 95%. The three injection angles selected were all within the 95% confidence interval, indicating that the reliability of using the selected three injection angle indices to estimate the overall injection angle range was good.
I also analyzed the oil streamline distribution under different injection angles. When the injection angle was 0°, the number of streamlines at the injection port and around the gear teeth was small. The lubricating oil was injected along the common tangent direction of the helical gear pitch circle. Before entering the gear meshing area, most of the lubricating oil was thrown to both sides of the gear, and the proportion of oil on the driving gear side was larger. When the injection angle was 10°, there was more oil distribution near the gear meshing area, and a large swirl appeared above the gear, causing oil deposition and dense streamline distribution. When the injection angle was 20°, a large amount of injected oil was thrown to the driven gear side, the oil splashing phenomenon was obvious, and the oil distribution near the gear meshing area was small. These conclusions proved that an injection angle that is too large or too small will affect the oil injection effect. Only a suitable injection angle can ensure effective tooth surface heat dissipation.
I analyzed the average temperature and temperature difference of the tooth surface under different injection distances. With the increase of injection distance, the tooth surface temperature difference first decreased and then increased, and the influence of injection distance on the average tooth surface temperature was small. The tooth surface temperature difference first increased and then decreased, and the decrease was relatively large. The reason is that when the injection distance was small (30 mm to 45 mm), the lubricating oil was directly blocked by the high-speed airflow near the gear teeth, and the oil was thrown to both sides of the gear teeth. Most of the lubricating oil was difficult to enter the gear meshing area, resulting in weakened cooling effect of the lubricating oil on the tooth surface. When the injection distance was large (greater than 75 mm), the velocity of the lubricating oil ejected from the injection port gradually decreased along the oil trace. The energy in the lubricating oil was weakened by the high-speed airflow around the gear, and the contact time between the lubricating oil and the tooth surface was reduced. As a result, the heat exchange times between the lubricating oil and the tooth surface were fewer, resulting in a lower average tooth surface temperature and a smaller temperature difference. When the injection distance was appropriate (45 mm to 75 mm), it could neutralize the energy loss along the lubricating oil and the obstruction of the high-speed airflow near the gear teeth, enhance the convective heat transfer ability between the tooth surface and the lubricating oil, reduce the average tooth surface temperature, and increase the temperature difference, so that the tooth surface heat dissipation effect was the best. The three injection distances selected were all within the 95% confidence interval, indicating that the reliability of using the selected three injection distance indices to estimate the overall injection distance range was good.
I analyzed the oil streamline distribution under different injection distances. When the injection distance was 30 mm, the number of streamlines at the injection port and around the gear teeth was very small. Most of the lubricating oil was thrown to the driving gear side, and only a small amount of oil entered the gear meshing area. When the injection distance was 60 mm, the oil splashing was not obvious, and the oil distribution near the gear meshing area was relatively large. When the injection distance was 90 mm, a large amount of injected oil was thrown to both sides of the gear, the oil splashing phenomenon was obvious, and large swirls appeared above both the driving gear and the driven gear, causing the oil to be unable to enter the gear meshing area. These conclusions show that an injection distance that is too large or too small will affect the oil injection effect. Only a suitable injection distance can ensure good tooth surface heat dissipation.
I analyzed the average temperature and temperature difference of the tooth surface under different injection velocities. The average tooth surface temperature first decreased and then increased with the increase of injection velocity. The tooth surface temperature difference first increased and then decreased with the increase of injection velocity. The reason for this difference is that when the injection velocity was large (greater than 40 m/s), the injection pressure was large, and the injected lubricating oil had greater momentum and kinetic energy. However, the obstruction by the high-speed airflow around the gear teeth was greater, and the oil splashing effect was more significant, which was not conducive to tooth surface heat dissipation. When the injection velocity was small (25 m/s to 30 m/s), the more energy the lubricating oil consumed to get rid of the gear centrifugal force, and the shorter the contact time between the lubricating oil and the tooth surface, the fewer heat exchange times between the tooth surface and the lubricating oil, resulting in unsatisfactory tooth surface heat dissipation. A suitable injection velocity (30 m/s to 40 m/s) could improve the deflection of the lubricating oil to the driven gear, enhance the ability to resist the influence of the high-speed airflow at the gear tooth edges, make the lubricating oil enter the gear meshing area more smoothly, and improve the tooth surface heat dissipation effect. The three injection velocities selected were all within the 95% confidence interval, indicating that the reliability of using the selected three injection velocity indices to estimate the overall injection velocity range was good.
I analyzed the oil streamline distribution under different injection velocities. When the injection velocity was 25 m/s, the number of streamlines at the injection port and around the gear teeth was very small. Most of the lubricating oil was thrown to the driven gear side, and only a small amount of oil entered the gear meshing area. When the injection velocity was 35 m/s, the oil splashing effect was weakened, and the oil distribution near the gear meshing area was dense. When the injection velocity was 45 m/s, a large amount of injected oil was thrown to both sides of the gear, the oil splashing phenomenon was obvious, and a large swirl appeared above the driving gear, causing the oil to be unable to enter the gear meshing area. These conclusions proved that an injection velocity that is too large or too small will affect the oil injection effect. Only a suitable injection velocity can ensure good tooth surface heat dissipation.
Response Surface Analysis and Optimization Results
I used response surface analysis to optimize the injection parameters by analyzing the regression models of the average tooth surface temperature and temperature difference. This method can explore the interaction effects of injection parameters on tooth surface temperature and makes up for the limitation of the ordinary orthogonal optimization method, which only considers the influence of a single injection parameter on the average tooth surface temperature and temperature difference. The three-dimensional response surface curves can more intuitively show the influence law between two injection parameters and can directly find the optimal injection parameter range.
The response surface curves of the interaction of injection angle, injection distance, and injection velocity on the average tooth surface temperature showed that when the injection angle was 8° to 11° and the distance was 55 to 65 mm, the average tooth surface temperature was relatively low. The contour lines were closed ellipses, and the response surface was concave, indicating that the interaction between injection angle and distance was strong and the average tooth surface temperature had a minimum value. The average tooth surface temperature first decreased and then increased with the increase of injection angle and velocity. The optimal range of injection distance was 55 to 65 mm, and the optimal range of velocity was 30 to 40 m/s. The contour lines were closed ellipses, and the response surface was concave, indicating that the average tooth surface temperature had a minimum value.
The response surface curves of the interaction of injection angle, injection distance, and injection velocity on the tooth surface temperature difference showed that the tooth surface temperature difference first increased and then decreased with the increase of injection angle and distance. When the injection angle was 4.89° to 13.67° and the injection distance was 50.14 to 60.66 mm, the average tooth surface temperature was relatively low. The optimal range of injection angle was 5.19° to 14.97°, and the optimal range of velocity was 30.13 to 38.17 m/s. The response surface was semi-convex, indicating that the interaction between injection angle and velocity was strong. When the injection distance was 49.79 to 69.69 mm and the velocity was 30.20 to 39.93 m/s, the tooth surface temperature difference was relatively suitable. The contour lines were semi-closed ellipses, and the response surface was semi-convex, indicating that the tooth surface temperature difference had a maximum value.
Based on the conclusions of the regression analysis, single-factor analysis, and response surface analysis, I found that optimizing injection parameters can improve the heat dissipation performance of the tooth surface. Taking the smaller average tooth surface temperature and the larger tooth surface temperature difference as the criterion, I calculated the optimal injection parameter combination according to the necessary condition for an extreme value:
$$
\frac{\partial Y_j}{\partial X_i} = 0, \quad i=1,2,3; \quad j=1,2
$$
The optimal injection angle was 9.212°, the injection distance was 54.514 mm, and the injection velocity was 35.561 m/s. The corresponding average tooth surface temperature was 306.75 K, and the tooth surface temperature difference was 30.72 K. By comparing the average tooth surface temperature and temperature difference before and after injection parameter optimization, I proved the effectiveness of the regression models \(Y_1\) and \(Y_2\). After optimization, the average tooth surface temperature decreased by 0.28%, and the tooth surface temperature difference increased by 6.56%. This verified that optimizing injection parameters can enhance tooth surface heat dissipation performance.
| Group | \(X_1\) (°) | \(X_2\) (mm) | \(X_3\) (m/s) | \(Y_1\) (K) | \(Y_2\) (K) |
|---|---|---|---|---|---|
| Before optimization | 0 | 60 | 25 | 307.61 | 28.73 |
| After optimization | 9.212 | 54.514 | 35.561 | 306.75 | 30.72 |
Temperature Field Experimental Verification
I used a helical gear injection heat dissipation test rig. The lubricating oil was sprayed onto the tooth surface at high speed, and the heat exchange between the oil and the tooth surface reduced the gear temperature. An infrared thermal imager was used to measure the tooth surface temperature. The parameters of the infrared thermal imager are listed in the table. The helical gear injection heat dissipation test system should have at least one pair of meshing helical gears, the injection angle, distance, and velocity should be adjustable, and the measurement and control system should be able to measure and control the tooth surface temperature, motor speed, injection velocity, distance, and angle. The entire injection heat dissipation test system and scheme were consistent with the settings in the simulation. Before installing the gear on the test rig, I cleaned the test gear and immersed it in lubricating oil. Under a constant torque load, I adjusted the injection angle through a universal fixture, and the injection velocity was controlled by a speed regulator. All parameter settings during the test were consistent with the simulation. In addition, I used the paint method to determine that the emissivity of the test gear was 0.93.
| Parameter | Value |
|---|---|
| Temperature measurement range | 253.15 K–773.15 K, expandable to 2273.15 K with filters |
| Detector type | MCT focal plane array, pixels ≥640×512, pixel pitch 15 μm |
| Spatial resolution | 0.3 mrad |
| Thermal sensitivity | <25 mK at 298.15 K, accuracy ±0.02 K |
| Field of view | 11°×8.8°/50 mm, minimum focus distance 0.5 m |
The infrared thermal imager captured the gear injection heat dissipation process. Before the test, the gear was heated to 323.15 K. As the high-speed oil was injected, the tooth surface temperature began to decrease slowly, and then the cooling range increased. The tooth surface temperature distributions before and after injection parameter optimization were obtained. Due to the gear centrifugal force and axial force, the heat dissipation effect on one side of the gear was better than that on the other side, and the heat dissipation effect on both sides of the gear was better than that at the tooth top and tooth root. Before injection parameter optimization, the average tooth surface temperature and temperature difference were 305.47 K and 26.78 K, respectively. After injection parameter optimization, the average tooth surface temperature was 304.72 K, and the tooth surface temperature difference was 28.81 K.
I compared the average tooth surface temperature and temperature difference obtained by simulation and experiment. Due to simulation and numerical calculation deviations, mesh discretization, and experimental instrument measurement errors, the experimental values of the average tooth surface temperature and temperature difference were slightly smaller than the simulation values, with an error range of 0.67% to 7.28%. The infrared temperature measurement experiment showed that after optimizing the injection parameters, the average tooth surface temperature decreased by 0.28%, and the tooth surface temperature difference increased by 6.93%. These findings verified the usability of the injection lubrication heat dissipation model and the reliability of the optimal injection parameters.
| Condition | Average temperature (K) | Temperature difference (K) | Error range |
|---|---|---|---|
| Simulation before optimization | 307.61 | 28.73 | — |
| Experiment before optimization | 305.47 | 26.78 | 0.67%–7.28% |
| Simulation after optimization | 306.75 | 30.72 | — |
| Experiment after optimization | 304.72 | 28.81 | 0.67%–7.28% |
Conclusions
I have drawn the following main conclusions from my study on the injection lubrication and heat dissipation of helical gears. First, the overset mesh method was used to establish the CFD model of a helical gear, and the oil spreading and diffusion under different gear rotation angles were analyzed. Compared with the dynamic mesh method, the overset mesh method reduced the calculation time by 52.89% while maintaining the same solution accuracy, proving that the overset mesh method can be effectively used for the flow analysis of helical gear transmission. The oil volume fraction on the tooth surface increased with the increase of the gear rotation angle. Both simulation and experiment showed that the oil distribution on the helical gear tooth surface was uneven because the high-speed airflow near the gear meshing area disturbed the oil distribution, and the oil diffusion degree depended on the interference of the gear centrifugal force and axial force.
Second, I studied the influence of injection angle and velocity on the spreading and deposition of the helical gear tooth surface. The results showed that when the injection angle was 7.5° and the injection velocity was 45 m/s, the tooth surface lubrication performance was the best. The influence of injection velocity on gear lubrication was greater than that of injection angle. By optimizing the injection angle and velocity, the tooth surface lubrication performance improved by 7.726% and 47.259%, respectively. I designed an injection experiment to study the influence of the injection oil flow. The experiment showed that due to the obstruction of high-speed airflow and the gear speed difference, swirl and oil deposition appeared below the driving gear. Based on image recognition technology, I measured the experimental tooth surface oil volume fraction and compared it with the simulation results. The experimental value of the average oil volume fraction of a single tooth was slightly smaller than the simulation value, with an error range of 1.67% to 5.97%. These results verified the reliability of the helical gear injection lubrication model.
Third, I constructed a gear heat dissipation model under injection lubrication and studied it using static and dynamic heat-flow coupling methods. The static heat-flow coupling simulation results showed that the gear heat dissipation performance increased with the decrease of injection angle and injection distance and the increase of injection velocity. The static injection heat dissipation experiment proved the correctness of the static gear injection heat dissipation model. The dynamic heat-flow coupling simulation results showed that due to the gear centrifugal force, oil splashing, and the blocking effect of high-speed airflow, the influence of injection parameters on gear heat dissipation was as follows: with the increase of injection angle, injection distance, and injection velocity, the average tooth surface temperature first decreased and then increased, and the tooth surface temperature difference first increased and then decreased.
Fourth, I designed a regression orthogonal experiment to explore the influence of injection parameters on the average tooth surface temperature and temperature difference. The results showed that the injection velocity and injection distance had significant effects on the average tooth surface temperature and temperature difference, respectively. When the injection angle was 9.212°, the injection distance was 54.514 mm, and the injection velocity was 35.561 m/s, the heat dissipation effect of the tooth surface was good. The infrared temperature measurement experiment of helical gear injection lubrication showed that the experimental values of the average tooth surface temperature and temperature difference were slightly smaller than the simulation values, with an error range of 0.67% to 7.28%. Under the optimal injection scheme, the gear heat dissipation performance improved by 6.93%, verifying the usability of the injection heat dissipation model and the rationality of the injection parameter design scheme.
My work has made some progress in the flow field simulation and heat dissipation analysis of helical gear transmission under injection lubrication, providing theoretical support for high-performance gear design and injection parameter selection. Due to the urgency of the research process and objective factors, some shortcomings still need further study and improvement. In the simulation of helical gear injection lubrication, the atomization effect of the injected oil droplets has a certain influence on the flow field distribution in the helical gearbox. In future research, a particle model of oil droplets should be added to deeply analyze the atomization effect of oil droplets and the impact and fragmentation of the oil film. In the study of the helical gear heat-flow coupling temperature field, the heat source used was a fixed heat source, which is inconsistent with the actual gear operation. Therefore, in future research, the contact friction heat generation of the gears should be calculated and applied to the tooth surface as a thermal boundary condition to further improve the solution of the gear temperature field.