
1. Introduction and Research Framework
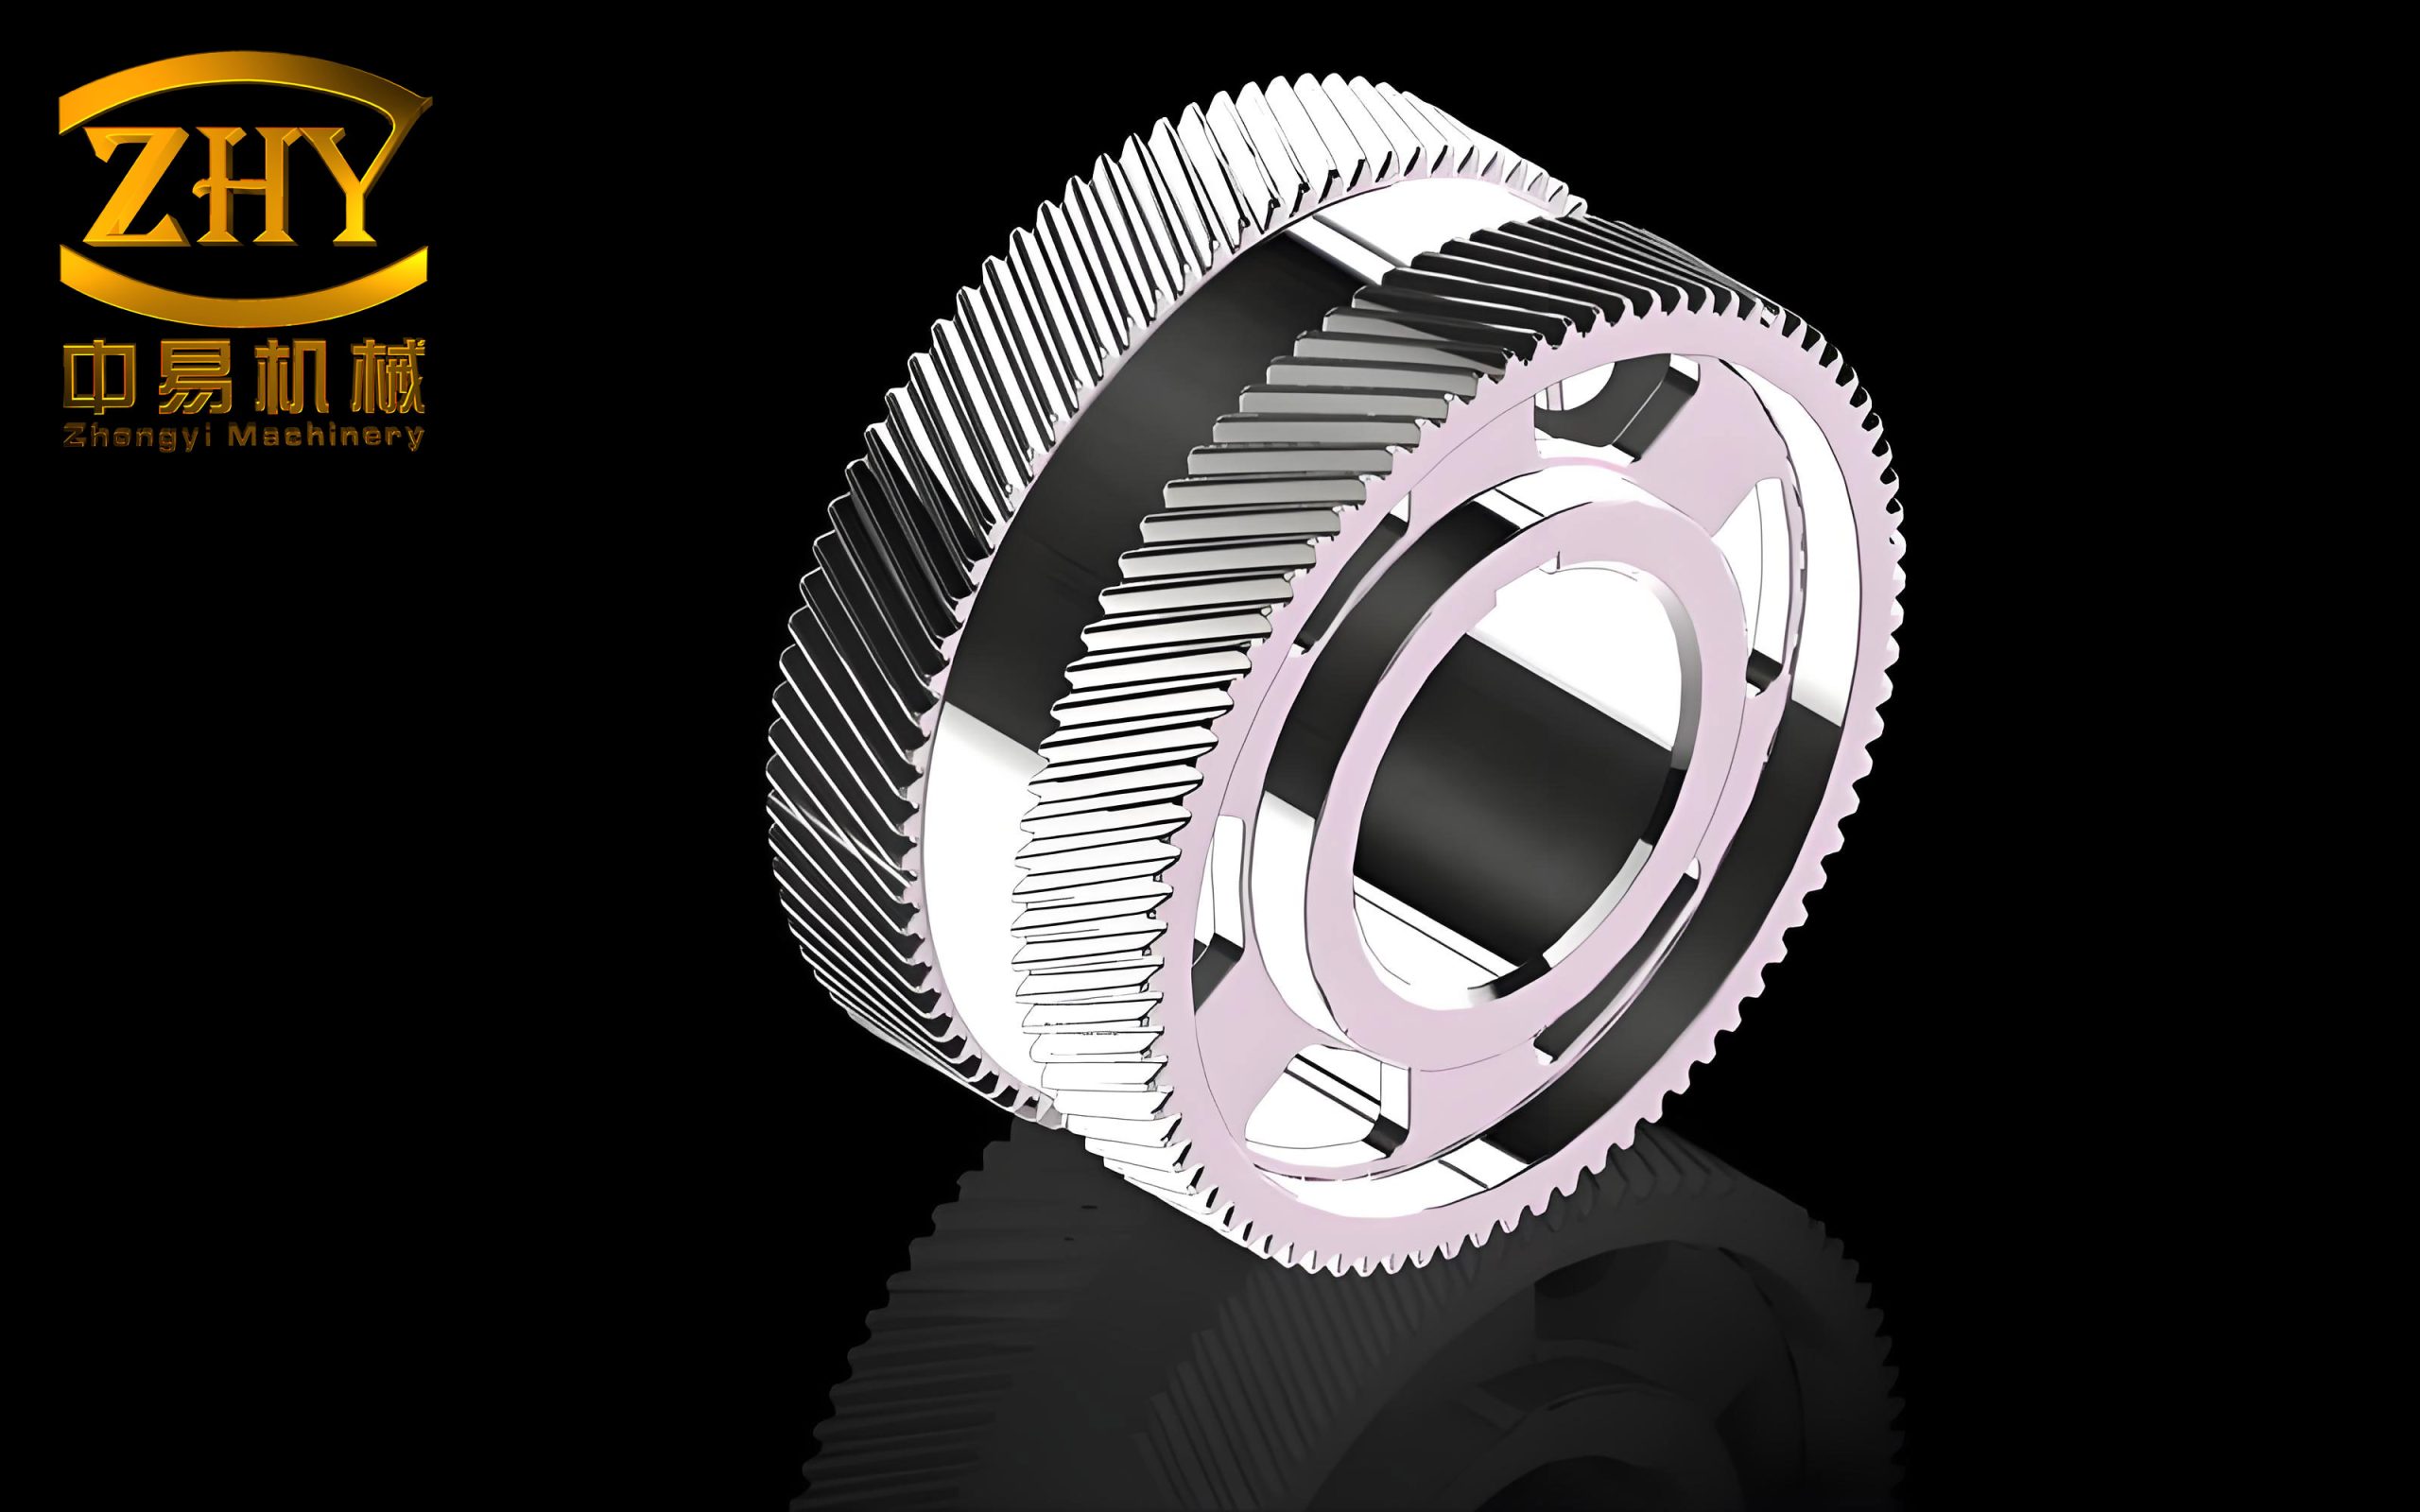
Herringbone gears are a type of gear that combines two opposite helical gears into one gear body, effectively eliminating axial forces. In my research, I focus on the lubrication characteristics of high-speed herringbone gears, which are critical components in aviation engines, helicopter transmissions, and heavy vehicles. The unique geometry of herringbone gears—with two mirrored helical halves—provides excellent stability under heavy loads and high rotational speeds. However, this same geometry also creates complex lubrication challenges. In my study, I systematically analyze the oil jet lubrication performance of herringbone gears under various operating conditions using computational fluid dynamics (CFD) techniques, thermal analysis, and experimental validation.
The lubrication state of herringbone gears is a decisive factor influencing transmission system performance. Effective lubrication reduces friction between tooth flanks, removes heat generated during meshing, and prevents catastrophic failures such as scuffing. In high-speed applications, the relative sliding velocity at the meshing zone generates significant heat, and without proper cooling, the gear tooth surface can exceed critical temperature limits, leading to premature failure. My research aims to establish a comprehensive understanding of how lubrication parameters—such as injection velocity, gear speed, and nozzle distance—affect the lubrication and cooling performance of high-speed herringbone gears.
2. Computational Model for Herringbone Gears
2.1 Three-Dimensional Modeling and Gear Modification
I established a three-dimensional model of a pair of herringbone gears based on the geometric parameters listed in Table 1. To ensure the accuracy of subsequent CFD and thermal analyses, the gears were modeled using a programming approach rather than traditional CAD tools, which often produce interference issues in gear tooth profiles.
| Parameter | Value | Parameter | Value |
|---|---|---|---|
| Number of teeth (driving gear) | 40 | Transverse pressure angle (°) | 25.573 |
| Number of teeth (driven gear) | 37 | Addendum coefficient | 1.297 |
| Normal module (mm) | 3.5 | Material | 18CrNiMo7-6 |
| Normal pressure angle (°) | 23 | Density (kg/m³) | 7870 |
| Helix angle (°) | 27.5 | Specific heat (J/kg·K) | 460 |
| Addendum clearance coefficient | 0.25 | Thermal conductivity (W/m·K) | 38 |
| Face width (mm) | 60 | Elastic modulus (Pa) | 2.1×10¹¹ |
| Center distance (mm) | 170.42 | Poisson’s ratio | 0.30 |
Gear modification is essential to improve meshing performance and avoid edge contact. I evaluated various tooth profile and lead modification methods, ultimately selecting crown (drum) modification for the herringbone gears. This modification transforms the tooth contact from line contact to point contact, which helps distribute the load more uniformly and improves the lubrication condition at the tooth surfaces. The modification amount was set to 20 µm.
2.2 Contact Analysis of Herringbone Gears
For the thermal analysis of herringbone gears, I first performed a detailed contact analysis to determine the time-varying contact line length, radius of curvature, entrainment velocity, normal contact force, and slide-to-roll ratio at different meshing points. The contact analysis was simplified by considering the equivalent single-side helical gear meshing, since a herringbone gear is essentially two helical gears with opposite helix angles.
The time-varying contact line length can be expressed as:
$$L = \sum_{i=1}^{K} l_i$$
where K is the number of simultaneous time-varying contact lines in the meshing zone. The contact line length distribution is shown in the analysis results. The radius of curvature in the x-direction is given by:
$$R_x^\prime = \frac{R_{x1}^\prime R_{x2}^\prime}{R_{x1}^\prime + R_{x2}^\prime}$$
$$R_{x1}^\prime = R_1 \pm \frac{N_1 B_l}{2 \sin \beta_b}, \quad R_{x2}^\prime = R_2 \mp \frac{N_2 B_l}{2 \sin \beta_b}$$
where B is the gear face width, β_b is the base helix angle, N₁ and N₂ are constants dependent on gear geometry, and lᵢ is the instantaneous contact line length. The entrainment velocity U and slide-to-roll ratio s were calculated using:
$$U = \frac{U_1 + U_2}{2}, \quad s = \frac{U_1 – U_2}{U}$$
where U₁ and U₂ are the rolling velocities at the meshing point for the driving and driven gears, respectively. Table 2 summarizes the key values at five representative meshing points (O₁ to O₅) during one meshing cycle.
| Meshing Point | Contact Line Length (mm) | Entrainment Velocity (m/s) | Slide-to-Roll Ratio | Normal Force (N) |
|---|---|---|---|---|
| O₁ (Engage start) | 8.2 | 18.6 | 0.42 | 1105 |
| O₂ (Engage mid) | 15.4 | 16.8 | 0.28 | 1850 |
| O₃ (Pitch point) | 22.6 | 15.2 | 0.02 | 2860 |
| O₄ (Disengage mid) | 15.8 | 16.5 | 0.26 | 1745 |
| O₅ (Disengage end) | 7.6 | 18.9 | 0.44 | 1020 |
With an input power of 70 kW and driving gear speed of 8000 r/min, the analysis reveals that the normal contact force reaches its maximum value near the pitch point where the load distribution ratio is highest. The slide-to-roll ratio exhibits a characteristic decrease from the engagement side to the pitch point, followed by an increase toward the disengagement side, which is consistent with typical helical gear behavior modified by the herringbone gear’s geometric characteristics.
2.3 CFD Model Establishment
For the CFD analysis, I built a computational fluid dynamics model of the herringbone gear lubrication system. Due to the extremely small gap at the gear meshing point, direct meshing simulation often results in negative volume cells during mesh updating. To address this issue, I adopted the tooth surface movement method, shifting the driven gear along the positive x-axis by 1.5 mm, increasing the center distance to 171.92 mm. This approach effectively prevents mesh distortion and ensures computational stability.
The fluid domain model includes the gear box space, a pair of herringbone gears, and the nozzle area. For mesh generation, I used triangular surface meshes and unstructured tetrahedral volume meshes. The gear mesh size was set to 1 mm, while the fluid domain mesh size was 3 mm, with local refinement near the nozzle and gear tooth surfaces. The final mesh contains approximately 906,000 cells.
The multiphase flow model for the lubrication simulation was established using the Volume of Fluid (VOF) method. The governing equations include the volume fraction conservation equation:
$$\sum_{a=1}^{n} r_a = 1$$
where n is the number of phases. For the oil-air two-phase system considered in this study:
$$r_o + r_a = 1$$
The continuity and momentum equations are expressed as:
$$\frac{\partial (r_o \rho_o)}{\partial t} + \nabla \cdot (r_o \rho_o U_o) = 0$$
$$\frac{\partial (r_o \rho_o U_o)}{\partial t} + \nabla \cdot (r_o \rho_o U_o U_o) = -r_o \nabla p + \nabla \cdot [r_o \mu_o (\nabla U_o + \nabla U_o^T)] + M_o$$
where ρ_o is the oil density, U_o is the oil velocity, p is the pressure, μ_o is the oil dynamic viscosity, and M_o represents interfacial forces between phases.
For turbulence modeling, I selected the k-ε model, which provides an optimal balance between computational efficiency and accuracy:
$$\mu_t = \rho C_\mu \frac{k^2}{\varepsilon}$$
where C_μ = 0.09, k is the turbulent kinetic energy, and ε is the turbulent dissipation rate. The transport equations for k and ε are solved with model constants C_ε1 = 1.44, C_ε2 = 1.92. The oil properties used in the simulation were: density 860 kg/m³, dynamic viscosity 0.039 Pa·s, and surface tension coefficient 0.071 N/m.
The transient simulation was performed with a time step of 1×10⁻⁵ s, convergence residual of 1×10⁻⁴, and a total of 1000 time steps. The gear tooth surfaces were set as no-slip rotating walls, the nozzle as a velocity inlet, and other boundaries as open boundary conditions.
3. Numerical Results and Analysis
3.1 Selection of Injection Method
In the lubrication of high-speed herringbone gears, the injection method is critical for achieving effective lubrication and cooling. I compared two approaches: injection at the mesh entry side (engagement side) and injection at the mesh exit side (disengagement side). The jet trajectories were analyzed under different gear speeds and injection velocities.
Figure 3.1 in my analysis shows the jet trajectories at different rotational speeds (2800 r/min to 10000 r/min) with a fixed injection velocity of 35 m/s. At low speeds (below 5000 r/min), the jet trajectory is virtually unaffected by the rotating flow field. However, as speed increases, the jet gradually deviates due to the rotating flow field. At 10000 r/min, significant deviation occurs, resulting in very little oil reaching the meshing zone. The influence of injection velocity at a fixed gear speed of 6900 r/min shows that at v ≥ 20 m/s, the jet trajectory remains relatively stable. When the injection velocity decreases to 10 m/s, the jet deviates considerably.
For the injection at the mesh exit side, I observed a critical phenomenon known as the “gas barrier effect”. The rotating flow field creates a high-pressure zone that impedes the oil jet penetration, causing reverse flow of the jet. In my simulations at v = 35 m/s and n = 2800 r/min, the oil volume fraction in the meshing zone was nearly zero, indicating complete jet reversal. This contrasts sharply with injection at the mesh entry side, where the oil reaches the meshing zone effectively.
| Injection Side | Flow Phenomenon | Oil Volume Fraction at Meshing Zone | Lubrication Effectiveness |
|---|---|---|---|
| Mesh entry side | Jet deviation | 0.15–0.30 | Acceptable |
| Mesh exit side | Gas barrier effect | <0.05 | Poor |
Based on these comparative analyses, I selected injection at the mesh entry side as the preferred method for the lubrication of high-speed herringbone gears in subsequent studies.
3.2 Oil Film Spreading Characteristics
The oil film spread behavior on the spatial meshing gear tooth surface is fundamental to understanding lubrication effectiveness. I established a numerical model for the oblique impact of oil droplets on a solid wall and the subsequent flow spreading of deposited oil film. To validate this model, I compared my simulation results with established experimental data in the literature under identical conditions (droplet diameter 2.84 mm, impact velocity 2.32 m/s, and incident angle 30°).
The comparison shows excellent agreement—the spreading oil film thickness trends and magnitudes closely match the reference experimental results, confirming the reliability and practical applicability of my numerical model. This validation provides confidence in applying the model to analyze oil film formation on herringbone gear tooth surfaces under different injection conditions.
Using the initial simulation parameters (nozzle diameter 2 mm, distance to meshing point 56 mm, injection velocity 35 m/s, driving gear speed 8000 r/min, driven gear speed 8649 r/min), I analyzed the deposition and spreading process over time. The oil film thickness reaches a maximum of approximately 640 nm at t = 1.5 ms when the oil initially contacts the gear tooth surface. Subsequently, the film spreads until reaching an equilibrium thickness of approximately 67 nm at t = 4 ms.
3.3 Single-Factor Effects on Lubrication
I systematically investigated how individual parameters affect the oil film thickness on the tooth surface of high-speed herringbone gears. The experimental design varied one parameter at a time while keeping others constant.
3.3.1 Injection Velocity Effect
Varying the injection velocity from 24 to 40 m/s in increments of 4 m/s reveals clear trends (Table 4). Higher injection velocities result in earlier oil arrival at the tooth surface, larger initial film thickness, shorter stabilization time, and larger final equilibrium film thickness. This occurs because higher velocity delivers more oil volume per unit time through the same nozzle cross-section.
| Injection Velocity (m/s) | Arrival Time (ms) | Initial Film Thickness (nm) | Stabilized Film Thickness (nm) |
|---|---|---|---|
| 24 | 2.3 | 412 | 44 |
| 28 | 2.0 | 498 | 53 |
| 32 | 1.7 | 572 | 61 |
| 36 | 1.5 | 636 | 68 |
| 40 | 1.3 | 695 | 75 |
The relationship between injection velocity and film thickness is not perfectly linear because film thickness is determined by the equilibrium of inertial forces, viscous forces, surface tension, and contact line forces.
3.3.2 Gear Speed Effect
I simulated driving gear speeds from 4200 to 15400 r/min while keeping injection velocity at 35 m/s and injection distance at 56 mm. The results in Table 5 demonstrate that higher gear speeds reduce the oil film thickness because the meshing cycle becomes shorter, reducing the duration available for oil delivery to the tooth surface.
| Gear Speed (r/min) | Initial Film Thickness (nm) | Stabilized Film Thickness (nm) |
|---|---|---|
| 4200 | 724 | 82 |
| 7000 | 682 | 74 |
| 9800 | 618 | 65 |
| 12600 | 545 | 56 |
| 15400 | 468 | 47 |
3.3.3 Injection Distance Effect
I varied the nozzle distance from the meshing point from 28 to 76 mm (Table 6). Interestingly, the injection distance mainly affects the initial oil arrival time rather than the final film thickness. All tested distances produced stabilized film thickness values around 60 nm. This suggests that within the tested range, the injection distance has a minor influence on the equilibrium film thickness for herringbone gears, although an excessively short distance risks obstruction by rotating teeth, while very long distances reduce the oil quantity reaching the meshing zone.
| Injection Distance (mm) | Oil Arrival Time (ms) | Initial Film Thickness (nm) | Stabilized Film Thickness (nm) |
|---|---|---|---|
| 76 | 2.2 | 628 | 62 |
| 64 | 1.9 | 635 | 63 |
| 52 | 1.6 | 642 | 64 |
| 40 | 1.3 | 638 | 61 |
| 28 | 1.1 | 640 | 62 |
4. Coupled Effects of Dual Variables
Real lubrication conditions involve simultaneous variation of multiple parameters. I conducted a comprehensive study of pairwise coupled effects using two key performance indicators: oil-air ratio and total gas-liquid pressure at the meshing zone of high-speed herringbone gears.
4.1 Coupled Effect of Injection Velocity and Gear Speed
Fixing the injection distance at 56 mm, I varied both injection velocity (24–40 m/s) and gear speed (4200–15400 r/min). Table 7 and Table 8 present the oil-air ratio and total gas-liquid pressure results, respectively.
| Speed (r/min) | 24 m/s | 28 m/s | 32 m/s | 36 m/s | 40 m/s |
|---|---|---|---|---|---|
| 4200 | 24.56 | 24.98 | 25.23 | 25.99 | 26.40 |
| 7000 | 21.16 | 22.35 | 23.67 | 23.99 | 24.84 |
| 9800 | 19.68 | 20.05 | 21.39 | 21.96 | 23.31 |
| 12600 | 19.03 | 20.19 | 20.91 | 21.58 | 22.39 |
| 15400 | 17.30 | 17.98 | 18.83 | 19.27 | 20.84 |
| Speed (r/min) | 24 m/s | 28 m/s | 32 m/s | 36 m/s | 40 m/s |
|---|---|---|---|---|---|
| 4200 | 1987.82 | 3021.73 | 5063.97 | 6962.87 | 8054.23 |
| 7000 | 2450.52 | 3964.25 | 5445.63 | 7022.97 | 8705.65 |
| 9800 | 3123.27 | 4285.09 | 5831.78 | 7354.44 | 9603.21 |
| 12600 | 3507.92 | 4807.92 | 6470.06 | 7976.18 | 9914.89 |
| 15400 | 4723.42 | 5783.31 | 7098.47 | 8825.45 | 10189.24 |
From the data, I observe that increasing injection velocity and decreasing gear speed both contribute to higher oil-air ratios, indicating better lubrication performance for herringbone gears. The maximum oil-air ratio of 26.40% occurs at v = 40 m/s and n = 4200 r/min. Conversely, the total gas-liquid pressure increases with both parameters. The pressure is highest (10189.24 Pa) at v = 40 m/s and n = 15400 r/min, which impedes oil penetration into the meshing zone. The optimal combination in this coupled scenario is v = 40 m/s and n = 4200 r/min.
4.2 Coupled Effect of Injection Velocity and Injection Distance
With gear speed fixed at 8000 r/min, I varied both injection velocity (24–40 m/s) and injection distance (28–76 mm). Table 9 presents the oil-air ratio results, and Table 10 shows the total gas-liquid pressure data.
| Distance (mm) | 24 m/s | 28 m/s | 32 m/s | 36 m/s | 40 m/s |
|---|---|---|---|---|---|
| 28 | 28.96 | 30.11 | 37.19 | 42.98 | 48.12 |
| 40 | 26.35 | 28.54 | 34.25 | 37.54 | 41.44 |
| 52 | 23.82 | 22.65 | 30.08 | 33.15 | 40.25 |
| 64 | 23.03 | 23.97 | 27.82 | 30.19 | 36.58 |
| 76 | 19.05 | 20.30 | 22.14 | 26.48 | 31.61 |
| Distance (mm) | 24 m/s | 28 m/s | 32 m/s | 36 m/s | 40 m/s |
|---|---|---|---|---|---|
| 28 | 2465.16 | 2868.72 | 3648.53 | 4209.84 | 5758.64 |
| 40 | 2156.75 | 2702.31 | 3559.48 | 3995.42 | 5569.34 |
| 52 | 2005.51 | 2465.41 | 3184.73 | 3526.68 | 4827.43 |
| 64 | 1694.28 | 2263.15 | 2711.59 | 3658.29 | 4758.69 |
| 76 | 1163.49 | 1755.28 | 2025.48 | 2891.57 | 3995.88 |
The maximum oil-air ratio of 48.12% occurs at v = 40 m/s and d = 28 mm, identifying this as the optimal combination. Increasing injection velocity and reducing injection distance both improve the lubrication conditions of herringbone gears. Both the oil-air ratio and total pressure increase with injection velocity, but the rate of increase in oil-air ratio is faster, indicating that prioritizing high injection velocity and short distance yields better overall lubrication.
4.3 Coupled Effect of Gear Speed and Injection Distance
With injection velocity fixed at 35 m/s, I varied gear speed (4200–15400 r/min) and injection distance (28–76 mm). Tables 11 and 12 present the corresponding oil-air ratios and total gas-liquid pressures.
| Distance (mm) | 4200 r/min | 7000 r/min | 9800 r/min | 12600 r/min | 15400 r/min |
|---|---|---|---|---|---|
| 28 | 43.34 | 39.25 | 31.86 | 24.66 | 18.34 |
| 40 | 41.27 | 38.28 | 32.65 | 24.02 | 16.52 |
| 52 | 38.26 | 34.14 | 29.08 | 21.44 | 15.79 |
| 64 | 37.95 | 34.62 | 27.59 | 19.99 | 15.21 |
| 76 | 34.16 | 31.68 | 24.22 | 20.23 | 13.54 |
| Distance (mm) | 4200 r/min | 7000 r/min | 9800 r/min | 12600 r/min | 15400 r/min |
|---|---|---|---|---|---|
| 28 | 3128.95 | 2762.18 | 3038.29 | 3305.30 | 2923.24 |
| 40 | 2866.15 | 3466.22 | 2891.32 | 3496.09 | 3045.78 |
| 52 | 2568.27 | 4025.88 | 3225.43 | 4124.12 | 3489.67 |
| 64 | 3358.29 | 3662.63 | 3195.11 | 3513.14 | 2898.87 |
| 76 | 3046.64 | 3433.16 | 2995.57 | 3215.19 | 3321.34 |
For this coupled scenario, the oil-air ratio increases with decreasing gear speed and decreasing injection distance, confirming the beneficial effects of lower speeds and shorter distances for herringbone gear lubrication. However, the total gas-liquid pressure exhibits a non-monotonic relationship with these parameters, with multiple local maxima appearing in the parameter space. This indicates that the gas-liquid pressure response to coupled variations is more complex than the oil-air ratio response.
5. Thermal Analysis and Convective Heat Transfer
5.1 Friction Heat Generation Calculation
The friction heat generated at the tooth surfaces of herringbone gears was calculated based on the relative sliding velocity, friction coefficient, and normal contact force determined from the contact analysis. The relative sliding velocity between the two tooth surfaces at the meshing point can be calculated from the gear geometry and rotational speeds:
$$v_{sO} = v_{tO1} – v_{tO2}$$
where v_{tO1} and v_{tO2} are the tangential velocities of the driving and driven gear tooth surfaces at the meshing point, respectively. The friction coefficient was obtained using the Ree-Eyring model:
$$\mu = \frac{F_f}{F_n} = \frac{\int_{\Omega} \tau_0 \sinh^{-1}\left(\frac{\eta u}{\tau_0 h}\right) d\Omega}{F_n}$$
where τ₀ is the limiting shear stress of the lubricant (taken as 1.8×10⁷ Pa), η is the dynamic viscosity, u is the sliding velocity, and h is the oil film thickness.
The transient friction heat generation rate is expressed as:
$$q_s = f F_n V_s$$
where f is the friction coefficient, F_n is the normal contact force, and V_s is the relative sliding velocity. To account for different thermal properties of the driving and driven gears, the heat partition coefficient κ is introduced:
$$\kappa = \frac{\sqrt{\lambda_1 \rho_1 c_1 u_1}}{\sqrt{\lambda_1 \rho_1 c_1 u_1} + \sqrt{\lambda_2 \rho_2 c_2 u_2}}$$
The friction heat distribution between the driving and driven gears of the herringbone gear pair follows:
$$q_{a1} = \kappa q_a, \quad q_{a2} = (1-\kappa)q_a$$
Table 13 presents the calculated steady-state friction heat power at the five representative meshing points.
| Meshing Point | Friction Coefficient | Sliding Velocity (m/s) | Heat Power (W) |
|---|---|---|---|
| O₁ | 0.045 | 8.2 | 292 |
| O₂ | 0.033 | 4.6 | 178 |
| O₃ | 0.012 | 0.3 | 8 |
| O₄ | 0.031 | 4.2 | 162 |
| O₅ | 0.047 | 8.6 | 305 |
The friction heat power of the driving gear is higher than that of the driven gear. The heat power shows a “V-shaped” variation from the engagement side to the disengagement side, with the pitch point exhibiting near-zero heat generation due to pure rolling conditions.
5.2 Bulk Temperature Field Analysis
The steady-state temperature field of the herringbone gear tooth was determined by solving the heat balance equation with appropriate boundary conditions. The governing equation for the gear body temperature field T_B is:
$$\frac{\partial^2 T_B}{\partial x^2} + \frac{\partial^2 T_B}{\partial y^2} + \frac{\partial^2 T_B}{\partial z^2} = 0$$
The boundary conditions at the tooth surface include the frictional heat flux q_F and convective heat transfer h_t:
$$-k \frac{\partial T_B}{\partial n} = h_t(T_B – T_a) – q_F$$
where k is the thermal conductivity, T_a is the ambient oil temperature, and n is the direction normal to the surface. For the tooth flank, tip, and end faces, distinct convective heat transfer coefficients were applied based on the local flow conditions.
Using the finite element method in Workbench, I constructed a single-tooth model of the herringbone gear and performed steady-state thermal analysis. The results show that the maximum bulk temperature of the herringbone gear tooth is approximately 60°C, located at the tooth tip. This finding aligns with the expectation that the tooth tip experiences the highest friction heat flux due to maximum sliding velocity and friction coefficient at that location.
5.3 Convective Heat Transfer Coefficient Analysis
To evaluate the cooling performance of the oil jet on high-speed herringbone gears, I established a simplified CFD model with multiple teeth retained around the meshing zone. The model was solved using the same multiphase flow approach described earlier. The convective heat transfer coefficient at the tooth surface was extracted for different injection parameters.
5.3.1 Effect of Injection Velocity
I simulated injection velocities of 24, 28, 32, 36, and 40 m/s with a fixed injection distance of 56 mm. The distributions of convective heat transfer coefficient on the tooth surfaces were visualized, and the average values are summarized in Table 14.
| Injection Velocity (m/s) | Average Heat Transfer Coefficient (W/m²·K) |
|---|---|
| 24 | 3450 |
| 28 | 4210 |
| 32 | 4990 |
| 36 | 5780 |
| 40 | 6650 |
The average convective heat transfer coefficient increases significantly with injection velocity, demonstrating that injection velocity is a dominant factor affecting the cooling effectiveness of herringbone gear lubrication. This confirms that in practical applications, increasing the injection velocity can markedly improve the heat dissipation capability at the tooth surfaces.
5.3.2 Effect of Injection Distance
I also simulated injection distances of 76, 64, 52, 40, and 28 mm with a fixed injection velocity of 35 m/s. The average heat transfer coefficients are presented in Table 15.
| Injection Distance (mm) | Average Heat Transfer Coefficient (W/m²·K) |
|---|---|
| 76 | 4870 |
| 64 | 5050 |
| 52 | 5320 |
| 40 | 5190 |
| 28 | 5280 |
The injection distance has a relatively minor effect on the average heat transfer coefficient compared to injection velocity. The highest value appears at d = 52 mm, after which the coefficient decreases slightly. This suggests that while adjusting the injection distance can provide some improvement in cooling performance, the primary control parameter for enhancing heat transfer in herringbone gear lubrication should be the injection velocity.
6. Experimental Validation
6.1 Test Platform Design
To validate the numerical simulation results, I designed and constructed a spray lubrication test platform specifically for herringbone gears. The test platform consists of a power-open gear test rig configuration, including a gear transmission unit, oil injection unit, and temperature measurement system. The test gears match the simulation parameters: driving gear with 40 teeth, driven gear with 37 teeth, normal module 3.5 mm, pressure angle 23°, helix angle 27.5°, face width 60 mm, and center distance 170.42 mm.
The drive system uses a YE2-90L-4 three-phase asynchronous motor rated at 300 kW and 1400 r/min. Since the high-speed condition of 8000 r/min is difficult to achieve in the laboratory environment, I scaled down both the gear speed and injection velocity proportionally while maintaining the same ratio, allowing meaningful comparisons of the flow phenomena.
For temperature measurement, I employed contact-type thermocouples connected to a temperature controller. This method was chosen over non-contact infrared thermometry because the oil mist environment inside the gearbox significantly interferes with infrared measurements. The thermocouple approach provides reliable, high-sensitivity temperature readings under the oil spray conditions.
6.2 Injection Jet Flow Pattern Tests
I first conducted experiments on the jet trajectory for injection at the mesh entry side. The test procedure involved marking the gear meshing area and measuring the jet deviation from the target region under different conditions. Table 16 presents the measured jet deviation under different gear speeds and injection velocities.
| Test Case | Gear Speed (r/min) | Injection Velocity (m/s) | Jet Deviation (mm) |
|---|---|---|---|
| 1 | 380 | 3.5 | 2.1 |
| 2 | 450 | 3.5 | 3.4 |
| 3 | 690 | 3.5 | 5.8 |
| 4 | 840 | 3.5 | 8.2 |
| 5 | 690 | 1.0 | 9.6 |
| 6 | 690 | 2.0 | 6.9 |
| 7 | 690 | 3.0 | 4.7 |
| 8 | 690 | 4.0 | 3.1 |
The experimental results demonstrate two clear trends: increasing gear speed increases jet deviation, while increasing injection velocity decreases jet deviation. These findings are consistent with my CFD simulation results in Section 3.1.1, confirming the accuracy of the numerical model.
For the mesh exit side injection tests, I reversed the motor direction to position the nozzle at the disengagement side. Observation of the jet behavior revealed a pronounced gas barrier effect. At low speeds, only a small portion of oil reaches the gear. As both gear speed and injection velocity increase, the jet reversal becomes more pronounced, with complete flow reversal observed in some test cases—leading to total lubrication failure. This confirms the CFD predictions and reinforces the decision to use mesh entry side injection for herringbone gear lubrication.
6.3 Cooling Performance Tests
The cooling performance tests were designed to indirectly evaluate the convective heat transfer coefficient under different injection parameters. Since directly measuring the convective heat transfer coefficient is challenging, I used the temperature decrease rate as a proxy—a higher heat transfer coefficient corresponds to faster cooling of the test specimen.
In the injection velocity test series, a test specimen was uniformly heated to 60°C and cooled by oil jets at velocities of 2, 4, 6, 8, and 10 m/s. The surface temperature was recorded after 30 seconds of cooling. In the injection distance test series, distances of 76, 64, 52, 40, and 28 mm were tested while keeping other conditions constant.
| Parameter | Value | Final Temperature (°C) | Cooling Rate (°C/s) |
|---|---|---|---|
| Injection velocity (m/s) | 2 | 48.2 | 0.39 |
| Injection velocity (m/s) | 4 | 42.5 | 0.58 |
| Injection velocity (m/s) | 6 | 38.1 | 0.73 |
| Injection velocity (m/s) | 8 | 34.6 | 0.85 |
| Injection velocity (m/s) | 10 | 31.8 | 0.94 |
| Injection distance (mm) | 76 | 43.2 | 0.56 |
| Injection distance (mm) | 64 | 42.1 | 0.60 |
| Injection distance (mm) | 52 | 40.8 | 0.64 |
| Injection distance (mm) | 40 | 41.5 | 0.62 |
| Injection distance (mm) | 28 | 41.9 | 0.60 |
The experimental results show that increasing injection velocity accelerates the cooling process, confirming enhanced heat convection with higher velocities. In contrast, the injection distance has a smaller and less systematic influence on cooling performance. Furthermore, the injection distance exhibits an optimal value around 52 mm, where cooling is slightly more efficient. These results are consistent with the numerical predictions, validating the simulation methodology and revealing essential design guidelines for the lubricating and cooling system of herringbone gears.
7. Conclusions and Engineering Implications
Through comprehensive CFD simulations, thermal analysis, and experimental validation, I have drawn the following key conclusions regarding the lubrication characteristics of high-speed herringbone gears:
(1) Injection method selection: For high-speed herringbone gears, injection at the mesh entry side is significantly superior to injection at the mesh exit side. The rotating flow field at the exit side creates a gas barrier effect that causes jet reversal, severely compromising lubrication. At the entry side, although jet deviation occurs at high speeds, sufficient oil can still reach the meshing zone under proper parameter selection.
(2) Oil film formation: The oil film thickness on herringbone gear tooth surfaces is primarily influenced by injection velocity and gear speed. Increasing injection velocity from 24 to 40 m/s increases the stabilized film thickness from 44 to 75 nm. Conversely, increasing gear speed from 4200 to 15400 r/min decreases the stabilized film thickness from 82 to 47 nm. The injection distance shows minimal influence on the equilibrium film thickness within the tested range.
(3) Coupled parameter effects: For dual-parameter combinations, the optimal lubrication conditions for herringbone gears are: (a) highest injection velocity (40 m/s) combined with lowest gear speed (4200 r/min) for velocity-speed coupling; (b) highest injection velocity (40 m/s) combined with shortest injection distance (28 mm) for velocity-distance coupling; and (c) lower gear speeds and shorter injection distances for speed-distance coupling, although the gas-liquid pressure response is non-monotonic.
(4) Thermal characteristics: The steady-state friction heat power of the driving gear in the herringbone gear pair exceeds that of the driven gear, with maximum values at the tooth engagement and disengagement zones. The bulk temperature of herringbone gear teeth reaches a maximum at the tooth tip (approximately 60°C under the tested conditions). The convective heat transfer coefficient increases nearly linearly with injection velocity but exhibits a weak and non-monotonic dependence on injection distance.
(5) Design recommendations: For engineering applications involving high-speed herringbone gears, prioritizing the adjustment of injection velocity yields more substantial improvements in both lubrication and cooling effectiveness compared to adjusting the injection distance or other parameters. The mesh entry side injection method combined with higher injection velocity and appropriate nozzle positioning (near 52 mm) provides the most favorable conditions for maintaining an adequate lubricating film and ensuring effective thermal management of the gear transmission system.
Future research should extend this work to include additional influencing factors such as nozzle diameter, injection angle, lubricant temperature, and more complex real-world boundary conditions. The interaction between convective heat transfer and gear bulk temperature should be further investigated through coupled thermal-fluid-structure analysis. Additionally, the effect of tooth surface modifications and micro-texturing on the lubrication performance of herringbone gears warrants deeper exploration. These extensions will enable more comprehensive and accurate predictions for the design of high-speed herringbone gear lubrication systems in demanding applications such as aviation and heavy machinery.