
Hydraulic systems have become an indispensable part of modern industrial equipment, and the pump at the heart of such a system determines its efficiency, stability and reliability. Among the many displacement machines available, the circular-arc helical gear pump occupies a distinctive position because the arc-shaped flank combined with a helical tooth trace suppresses trapping, smooths the delivery flow and lowers the excitation level compared with a conventional involute spur gear pump. In my work I treat the helical gear pump as a strongly coupled multi-physics system in which the fluid film, the thermal field and the elastic structure interact continuously. My objective is to explain how this coupling reshapes the vibration signature of a high-speed circular-arc helical gear pump, and to quantify how rotational speed and pressure load modulate that signature.
The helical gear geometry is central to the argument. Because the contact line of a helical gear pair advances gradually along the tooth width, the load transfer is distributed in time rather than concentrated in a single instantaneous impact. When the axial overlap ratio of the helical gear exceeds unity, a new pair of teeth enters mesh before the previous pair separates, so the meshing stiffness never drops to zero and the flow pulsation of the pump is markedly reduced. The same geometry, however, introduces an axial force component and a coupled bending–torsional–axial vibration pattern that cannot be reproduced by a purely two-dimensional spur gear model.
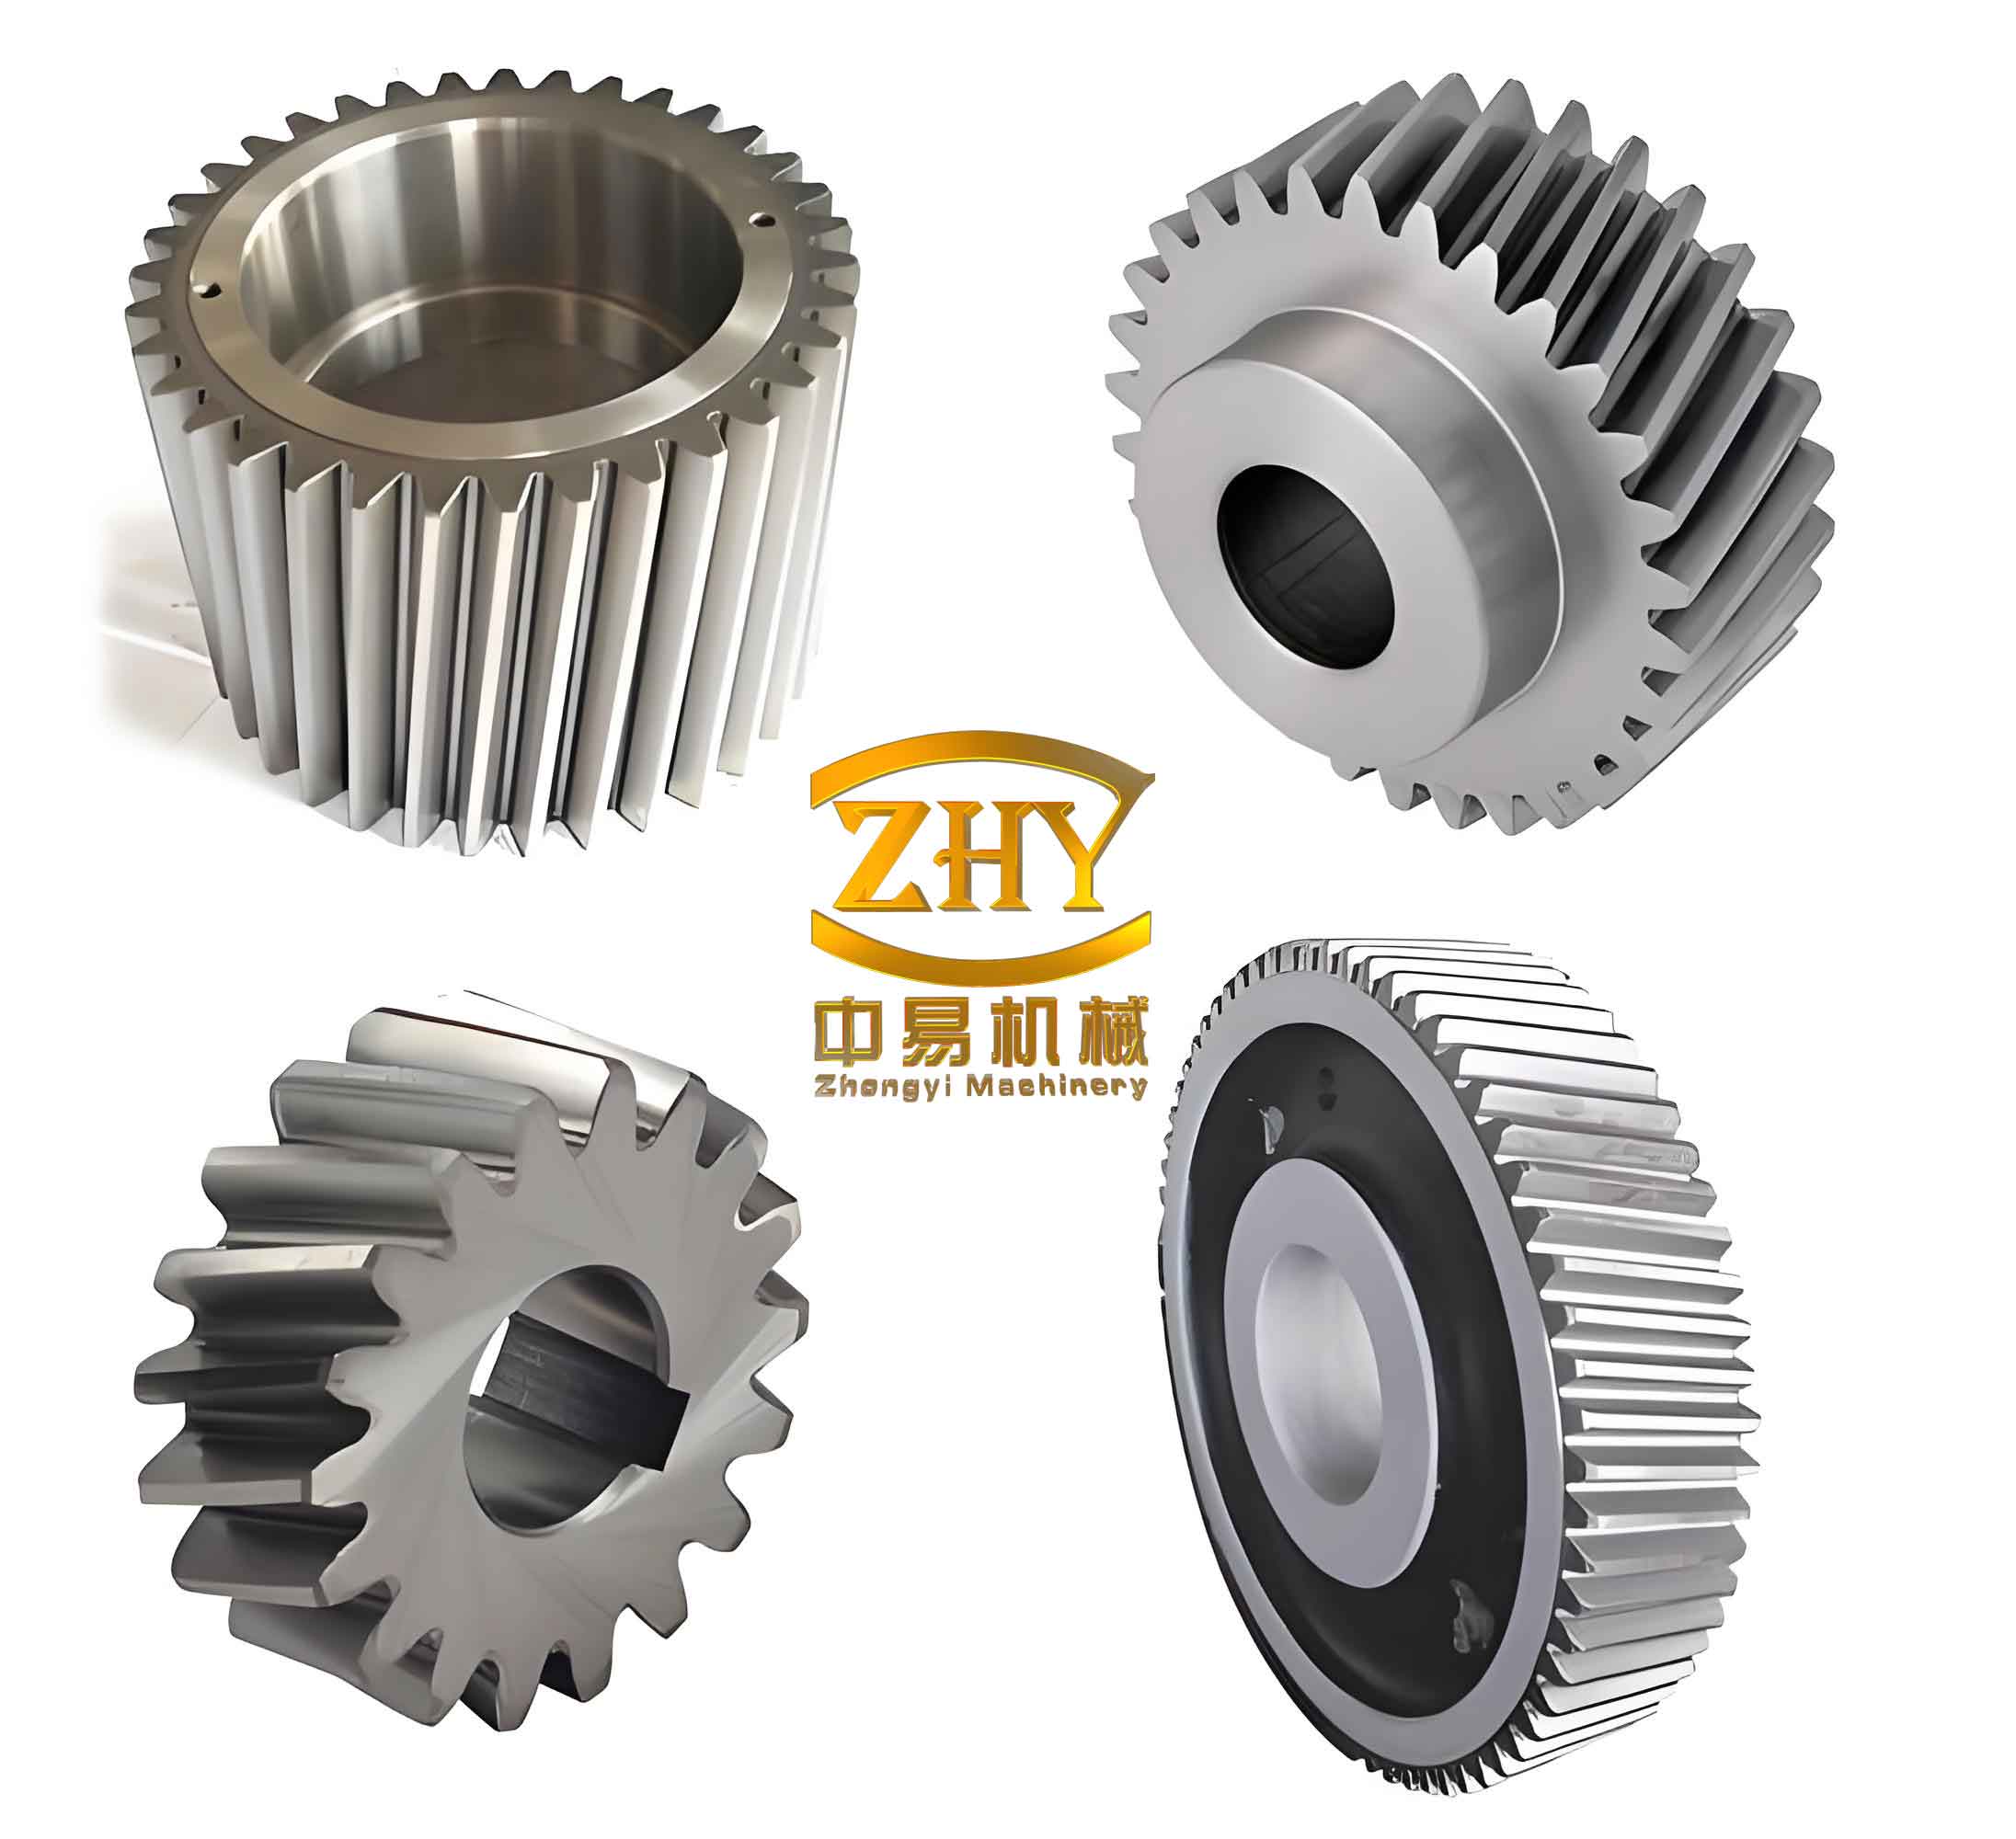
Design Baseline of the Investigated Helical Gear Pump
My study is built on a self-developed high-speed circular-arc helical gear pump whose tooth profile follows an arc–sine–arc composite curve. The transition segment of the rotor is a sinusoidal curve, which produces continuous point contact during meshing, while the helical wrap of the helical gear guarantees an axial overlap ratio greater than one. The nominal operating point that I used for every simulation and every experiment is summarized in the table below.
| Parameter | Symbol | Value |
|---|---|---|
| Number of teeth | $z$ | 7 |
| Module | $m$ | 3 mm |
| Pressure angle | $\alpha_0$ | 14.5° |
| Helix angle of the helical gear | $\beta$ | 31.3° |
| Face width | $B$ | 15.5 mm |
| Centre distance | $a$ | 21.01 mm |
| Shaft diameter | $d_s$ | 10 mm |
| Displacement | $q$ | 5 mL/r |
| Rated speed | $n$ | 10 000 r/min |
| Rated delivery pressure | $p_{out}$ | 25 MPa |
| Suction port diameter | $d_{in}$ | 16 mm |
| Delivery port diameter | $d_{out}$ | 11 mm |
A hydrostatic plain bearing fed from the delivery side balances the radial force acting on the helical gear rotor, and an axial groove machined in the front cover balances the axial thrust generated by the helical gear. This arrangement keeps the rotor centred and prevents the helical gear pair from being pushed out of alignment under high pressure.
Temperature Rise Model of the Helical Gear Pump
Heat generation inside a helical gear pump originates from viscous friction of the oil, from the pressure difference between the delivery and suction sides, and from the enthalpy difference between the fluid entering and leaving the control volume. I started from the conservation of mass for a control volume of the trapped fluid,
$$\frac{dm}{dt}=\sum_i \dot{m}_i$$
and expanded the density as a total differential in pressure and temperature,
$$\frac{d\rho}{dt}=\left(\frac{\partial \rho}{\partial p}\right)_T \frac{dp}{dt}+\left(\frac{\partial \rho}{\partial T}\right)_p \frac{dT}{dt}$$
Introducing the isothermal bulk modulus and the isobaric thermal expansion coefficient of the oil,
$$K_T=\rho\left(\frac{\partial p}{\partial \rho}\right)_T,\qquad \alpha_p=-\frac{1}{\rho}\left(\frac{\partial \rho}{\partial T}\right)_p$$
the density differential becomes
$$\frac{d\rho}{dt}=\frac{\rho}{K_T}\frac{dp}{dt}-\rho\,\alpha_p\frac{dT}{dt}$$
Substituting this relation into the mass balance of a control volume of instantaneous size $V$ gives the pressure evolution equation of the helical gear pump,
$$\frac{dp}{dt}=\frac{K_T}{V}\left[\frac{1}{\rho}\sum_i \dot{m}_i-\frac{dV}{dt}+\alpha_p V\frac{dT}{dt}\right]$$
which states that the local pressure rises when oil flows in, when the volume of the pocket shrinks, and when the temperature increases. The energy balance of the same control volume is written as
$$\frac{d(mu)}{dt}=\dot{Q}-\dot{W}+\sum_i \dot{H}_i,\qquad u=h-\frac{pV}{m}$$
and after eliminating the internal energy in favour of the specific enthalpy and using the differential form of the enthalpy,
$$dh=c_p\,dT+\frac{1-\alpha_p T}{\rho}\,dp$$
I obtain the temperature-rise control equation that governs the thermal state of the helical gear pump,
$$\frac{dT}{dt}=\frac{1}{c_p\rho V}\left[\dot{Q}+\sum_i \dot{m}_i\left(h_i-h\right)+V\alpha_p T\frac{dp}{dt}\right]$$
Three physical mechanisms can be read directly from this expression. First, viscous friction inside the oil raises the temperature. Second, a pressure rise or drop across the helical gear mesh changes the temperature through the expansion term. Third, the specific enthalpy difference between the inlet and the outlet of the tooth pocket drives an additional temperature change. The temperature field obtained from this equation is later mapped onto the solid domain as a body load, which is what makes the coupling non-trivial.
Full Cavitation Model of the Mixed Working Fluid
At high rotational speed the local pressure in the separating side of the helical gear mesh falls below the vapour pressure and cavitation appears. Because cavitation is strongly temperature dependent, I adopted a full cavitation model in which the oil is treated as a two-phase, three-component mixture of liquid oil, oil vapour and dissolved air. The Rayleigh–Plesset equation describes the radial motion of a spherical bubble,
$$r_B\frac{d^2r_B}{dt^2}+\frac{3}{2}\left(\frac{dr_B}{dt}\right)^2=\frac{P_B-P}{\rho_l}-\frac{4\nu_l}{r_B}\frac{dr_B}{dt}-\frac{2\sigma}{\rho_l r_B}$$
Neglecting the viscous term, the surface tension term and the second-order term, the net phase-change rate of the mixture becomes
$$R=\left(\frac{2}{3}\frac{P_B-P}{\rho_l}\right)^{1/2}\frac{4}{3}\pi n_0 r_B^2\,\rho_v \approx \left(\frac{2}{3}\frac{P_B-P}{\rho_l}\right)^{1/2}\frac{4}{3}\pi n_0\left(\frac{3\alpha}{4\pi}\right)^{2/3}\left(1-\alpha\right)\rho_v$$
The continuity equations of the liquid phase, the vapour phase and the mixture are
$$\frac{\partial}{\partial t}\left[(1-\alpha)\rho_l\right]+\nabla\cdot\left[(1-\alpha)\rho_l\mathbf{u}\right]=-R$$
$$\frac{\partial}{\partial t}\left(\alpha\rho_v\right)+\nabla\cdot\left(\alpha\rho_v\mathbf{u}\right)=R$$
$$\frac{\partial \rho}{\partial t}+\nabla\cdot\left(\rho\mathbf{u}\right)=0$$
with the mixture density and mixture viscosity evaluated as weighted averages of the two phases,
$$\rho_m=\left(1-\phi_v\right)\rho_l+\phi_v\rho_v,\qquad \mu_m=\left(1-\phi_v\right)\mu_l+\phi_v\mu_v$$
The momentum equation of the mixture retains the effective viscosity composed of a molecular and a turbulent part,
$$\frac{\partial(\rho\mathbf{u})}{\partial t}+\nabla\cdot(\rho\mathbf{u}\mathbf{u})=-\nabla p+\nabla\cdot\left[\mu_{\mathrm{eff}}\left(\nabla\mathbf{u}+\nabla\mathbf{u}^{\mathrm{T}}-\frac{2}{3}\nabla\cdot\mathbf{u}\,\mathbf{I}\right)\right]+\rho\mathbf{g}$$
and the turbulence is closed with the RNG $k$–$\varepsilon$ model, whose two transport equations are
$$\frac{d(\rho k)}{dt}=\frac{\partial}{\partial x_j}\left(\alpha_k\mu_{\mathrm{eff}}\frac{\partial k}{\partial x_j}\right)+G_k+G_b-\rho\varepsilon-Y_M$$
$$\frac{d(\rho\varepsilon)}{dt}=\frac{\partial}{\partial x_j}\left(\alpha_\varepsilon\mu_{\mathrm{eff}}\frac{\partial\varepsilon}{\partial x_j}\right)+C_{1\varepsilon}\frac{\varepsilon}{k}\left(G_k+C_{3\varepsilon}G_b\right)-C_{2\varepsilon}\rho\frac{\varepsilon^2}{k}-R_\varepsilon$$
The effective viscosity follows from the molecular and turbulent contributions,
$$\mu_{\mathrm{eff}}=\mu+\mu_t,\qquad \mu_t=\rho C_\mu\frac{k^2}{\varepsilon}$$
Because the RNG variant adds a strain-rate-dependent term to the dissipation equation, it reproduces the strong streamline curvature present between the helical gear teeth far better than the standard $k$–$\varepsilon$ closure, and it also predicts the near-wall behaviour more accurately, which matters for the leakage path at the tooth tip.
Thermal-Fluid-Solid Coupling Formulation
The coupled problem is closed by the interface conditions that must hold on every wetted surface of the helical gear rotor and housing,
$$\boldsymbol{\tau}_f\cdot\mathbf{n}_f=\boldsymbol{\tau}_s\cdot\mathbf{n}_s,\qquad q_f=q_s,\qquad T_f=T_s,\qquad l_f=l_s$$
meaning that traction, heat flux, temperature and displacement are continuous across the interface. The structural response inside the solid domain is governed by the thermo-elastic constitutive law
$$\boldsymbol{\sigma}=\mathbf{D}\left(\boldsymbol{\varepsilon}-\boldsymbol{\varepsilon}_0\right)$$
where the initial strain induced by the temperature change of the helical gear rotor is
$$\boldsymbol{\varepsilon}_0=\alpha_T\Delta T\begin{bmatrix}1&1&1&0&0&0\end{bmatrix}^{\mathrm{T}}$$
and the strain is related to the nodal displacement by the strain–displacement matrix,
$$\boldsymbol{\varepsilon}=\mathbf{B}\boldsymbol{\delta}_e,\qquad \mathbf{Q}_r=\mathbf{K}\boldsymbol{\delta}_e$$
Writing the total strain as the superposition of the elastic and thermal parts gives the form that I actually used in the finite-element solver,
$$\boldsymbol{\varepsilon}=\mathbf{D}^{-1}\boldsymbol{\sigma}+\boldsymbol{\varepsilon}_{th},\qquad \boldsymbol{\varepsilon}_{th}=\begin{bmatrix}\alpha_x^s\Delta T & \alpha_y^s\Delta T & \alpha_z^s\Delta T & 0 & 0 & 0\end{bmatrix}^{\mathrm{T}}$$
Because the density of the metallic helical gear rotor is nearly three orders of magnitude larger than that of the oil, the structural deformation feeds back only weakly into the flow field. I therefore adopted a one-way, loosely coupled scheme: the flow field is solved first, the resulting wall temperature and wall pressure are transferred to the solid, and the structural solution is then obtained. This sequence is repeated until the transferred quantities no longer change between successive passes.
Meshing Excitation of the Helical Gear Pair
The dominant excitation of a helical gear pump is the time-varying meshing stiffness, supplemented by the transmission error, the impact at the beginning of contact and the axial component created by the helix angle. I described the helical gear rotor pair with a six-degree-of-freedom generalised displacement vector that combines translation in two directions and rotation about the axis for each rotor,
$$\boldsymbol{\delta}=\left\{y_1,\;z_1,\;\theta_1,\;y_2,\;z_2,\;\theta_2\right\}^{\mathrm{T}}$$
where $y$ is the direction normal to the meshing line in the transverse plane and $z$ is the axial direction of the helical gear. Applying Newton’s second law to the driving and driven rotors yields
$$m_1\ddot{y}_1+c_{1y}\dot{y}_1+k_{1y}y_1=-F_y$$
$$m_1\ddot{z}_1+c_{1z}\dot{z}_1+k_{1z}z_1=-F_z$$
$$I_1\ddot{\theta}_1=F_yR_1-T_1+F_s(t)R_1$$
for the driving helical gear and
$$m_2\ddot{y}_2+c_{2y}\dot{y}_2+k_{2y}y_2=F_y$$
$$m_2\ddot{z}_2+c_{2z}\dot{z}_2+k_{2z}z_2=-F_z$$
$$I_2\ddot{\theta}_2=-F_yR_2+T_2+F_s(t)R_2$$
for the driven helical gear. The meshing stiffness and the meshing damping are projected onto the transverse meshing line and the axial direction through the helix angle,
$$k_{my}=k_m\cos\beta,\qquad k_{mz}=k_m\sin\beta$$
$$c_{my}=c_m\cos\beta,\qquad c_{mz}=c_m\sin\beta$$
To capture the influence of temperature on the meshing behaviour, I modelled each tooth of the helical gear as a cantilever beam clamped at the root circle and divided the beam into slices along the face width. The bending stiffness contributed by one slice of thickness $dy$ is
$$dk_b=\left[\int_0^{d(y)}\frac{\left[d(y)-x\right]^2}{E\,I_x(y)}\,dx\right]^{-1}$$
and summation over all slices of the helical gear tooth gives the total bending stiffness
$$k_b=\frac{1}{2}\int_0^{K}\left[\frac{3A}{E z^3}+\frac{3B}{E x^3}+\frac{C}{E y^3}\right]^{-1}dy$$
with the geometric coefficients
$$A=x_m-z_m\tan\alpha_m,\qquad B=\left(R_f-u_f\right)\cos\alpha_m,\qquad C=\left(R_b-u_b\right)\cos\alpha_m$$
In the same way I derived the shear stiffness and the axial compression stiffness of the helical gear tooth,
$$k_a=\sum_{i=1}^{N}\int_0^{K}\left[\frac{\sin^2\alpha_m}{E z(y)}+\frac{D}{E x(y)}\right]^{-1}dy$$
$$k_s=\sum_{i=1}^{N}\int_0^{K}\left[\frac{\left(1.2+1.2v\right)\cos^2\alpha_m}{E z(y)}+\frac{1.2\cos^2\alpha_m}{E x(y)}\right]^{-1}dy$$
so that the meshing stiffness of the temperature-affected helical gear pair becomes
$$k_m=\left[\frac{1}{k_b}+\frac{1}{k_s}+\frac{1}{k_a}\right]^{-1}$$
When the tooth flanks expand thermally, the backlash of the helical gear shrinks, the contact region grows and the mean deformation over the contact region decreases. The consequence is a systematic increase of the meshing stiffness of the helical gear pair over the whole cycle from engagement to disengagement, which shifts the excitation spectrum of the pump towards higher frequencies and simultaneously reduces the peak-to-peak amplitude of the dynamic meshing force.
The dynamic meshing force in the transverse meshing line and in the axial direction of the helical gear reads
$$F_y=c_m\cos\beta\left(\dot{y}_1-\dot{y}_2+R_1\dot{\theta}_1-R_2\dot{\theta}_2\right)+k_m\cos\beta\left(y_1-y_2+R_1\theta_1-R_2\theta_2\right)$$
$$F_z=c_m\sin\beta\left[\dot{z}_1-\dot{z}_2+\tan\beta\left(\dot{y}_1-\dot{y}_2+R_1\dot{\theta}_1-R_2\dot{\theta}_2\right)\right]+k_m\sin\beta\left[z_1-z_2+\tan\beta\left(y_1-y_2+R_1\theta_1-R_2\theta_2\right)\right]$$
Finally, the vibration displacement of the helical gear rotor in the two principal directions obeys a single-degree-of-freedom oscillator equation,
$$F_y=m_y\frac{d^2x_y}{dt^2}+c_y\frac{dx_y}{dt}+k_mx_y,\qquad F_z=m_z\frac{d^2x_z}{dt^2}+c_z\frac{dx_z}{dt}+k_mx_z$$
These two relations are the design lever that I later used for structural optimisation. For a given meshing force, a larger rotor mass reduces the acceleration of the vibration displacement, while a larger stiffness and a larger damping reduce the vibration displacement itself.
Cavitation-Induced Excitation
The second excitation mechanism is cavitation in the separating region of the helical gear mesh. I tracked the vapour volume fraction through the transport equation
$$\frac{\partial\left(\rho_v\phi_v\right)}{\partial t}+\nabla\cdot\left(\rho_v\phi_v\mathbf{u}\right)=\dot{m}_{lv}-\dot{m}_{vl}$$
The heat generated by cavitation is the sum of the pressure work, the viscous dissipation, the tooth friction and the latent heat of the phase change,
$$Q_{cav}=\dot{m}_{lv}L_{ev},\qquad Q_{vd}=\boldsymbol{\tau}:\nabla\mathbf{u},\qquad Q_f=\frac{f_0F_mv_s}{V_f}$$
The energy conservation of the mixture therefore takes the form
$$\frac{\partial\left(\rho_m c_{pm}T\right)}{\partial t}+\nabla\cdot\left(\rho_m c_{pm}T\mathbf{u}\right)-\nabla\cdot\left(k_m\nabla T\right)=Q_{vd}+Q_f+Q_{cav}+Q_{p}$$
with the pressure work term
$$Q_p=\alpha_p T\left(\frac{\partial p}{\partial t}+\mathbf{u}\cdot\nabla p\right)$$
The Zwart–Gerber–Belamri model supplies the mass transfer rate and links the bubble radius growth to the local temperature,
$$\frac{dR_B}{dt}=\frac{\rho_l}{\rho_v}\frac{c_{pl}T}{\rho_lL_{ev}}\sqrt{\frac{2}{3}\frac{p_B-p}{\rho_l}}$$
When a bubble collapses, the impulse that it delivers to the surrounding oil is the source of the high-frequency vibration of the helical gear pump. The pressure at an arbitrary point at distance $l$ from the bubble wall is
$$P_H=\frac{\rho_m}{4\pi\left(l+R_B\right)}\frac{d^2V(t)}{dt^2}$$
and the impulse of a single collapsing bubble follows as
$$I=\int P_H\,dt$$
For a cloud of $n$ bubbles collapsing per unit time the total impulse intensity is additive,
$$I_{sum}=n\cdot I$$
The characteristic collapse time obtained from the Rayleigh solution is
$$T_c\approx 0.915\,R_B\sqrt{\frac{\rho_l}{p_\infty}}$$
so the cavitation-induced vibration frequency of the helical gear pump is
$$f_c=\frac{1}{T_c}\approx\frac{1.093}{R_B}\sqrt{\frac{p_\infty}{\rho_l}}$$
From the last two expressions I conclude that a local temperature rise accelerates the growth of the bubble radius and therefore lowers the cavitation vibration frequency, whereas a local temperature drop accelerates collapse and raises the frequency. This prediction is one of the few that can be checked directly against the measured spectra of the helical gear pump.
Fluid Domain Construction and Mesh Generation
I built the solid model of the circular-arc helical gear pump, extracted the internal flow volume by a Boolean operation, and split the boundary into a pressure inlet, a pressure outlet, stationary walls, the driving helical gear rotation boundary and the driven helical gear rotation boundary. Because the smallest gap at the helical gear mesh is only about 0.02 mm while the pocket size is of the order of millimetres, the mesh has to accommodate an extreme size gradient. I therefore generated a two-dimensional surface mesh first and then converted it into a three-dimensional polyhedral mesh. The polyhedral cell count is about one third of that of an equivalent tetrahedral mesh, which shortens the solution time and improves the orthogonality of the cells at the moving boundary of the helical gear. Negative-volume cells must be eliminated before the transient run, otherwise the solver aborts when the helical gear teeth sweep across the deforming mesh.
Boundary Conditions of the Flow Model
Since the working oil is treated as weakly compressible, I used the pressure-based solver in a transient formulation. The RNG $k$–$\varepsilon$ model was selected because it handles the swirling and jet-like flow produced by the rotating helical gear teeth better than the standard closure, and the energy equation with viscous heating was activated so that the temperature field of the helical gear pump could be extracted. The working fluid was a mineral hydraulic oil with density 870 kg/m³, specific heat 1687 J/(kg·K), thermal conductivity 0.12 W/(m·K) and dynamic viscosity 0.0225 kg/(m·s).
The rotation of the helical gear rotors was imposed through a user-defined function. The driving helical gear rotates clockwise and the driven helical gear rotates counter-clockwise, both at the rated speed. Because the solver expects angular velocity in radians per second, the values applied to the two rotors were $-1046$ rad/s and $+1046$ rad/s respectively. The inlet pressure was set to the atmospheric value and the outlet pressure to the working pressure of 25 MPa. The pressure–velocity coupling used the coupled scheme with a least-squares cell-based gradient, and the under-relaxation factors for pressure, momentum and energy were set to 0.5.
| Boundary condition | Type | Value |
|---|---|---|
| Inlet | pressure inlet | 0.1 MPa |
| Outlet | pressure outlet | 25 MPa |
| Driving helical gear speed | UDF wall motion | −1046 rad/s |
| Driven helical gear speed | UDF wall motion | +1046 rad/s |
| Turbulence model | RNG $k$–$\varepsilon$ | with viscous heating |
| Energy equation | enabled | on |
| Pressure–velocity coupling | coupled | least-squares gradient |
| Under-relaxation factors | pressure, momentum, energy | 0.5 |
Flow Field Results of the Helical Gear Pump
The pressure field of the helical gear pump rises monotonically from the suction port to the delivery port. Each tooth pocket forms a closed chamber between the rotor flanks and the casing, and the pressure inside a single pocket is almost uniform while the pressure from pocket to pocket increases in a staircase manner. The lowest pressure, and the largest negative value, occurs in the region where the helical gear teeth begin to separate on the suction side. The highest pressure occurs in the pocket that is already connected to the delivery port.
The temperature field follows a different pattern. The lowest temperature is found at the inlet, the outlet temperature is only slightly higher, and the temperature difference along the flow path inside the pockets is small. The pronounced temperature rise is confined to the meshing region of the helical gear pair, especially on the side close to the inlet, because that is where the sliding velocity between the flanks and the local shear rate of the oil reach their maximum. This observation confirms that the meshing zone is both the mechanical and the thermal hot spot of the helical gear pump.
Cavitation is localised in the same region in which the teeth separate. As the helical gear pair leaves contact, the volume of the pocket increases abruptly, the pressure collapses and the oil vaporises. The vapour volume fraction is highest in a narrow band adjacent to the separation point and decays rapidly towards the delivery side, which means that the cavitation excitation of the helical gear pump is a strongly localised, transient phenomenon rather than a distributed one.
Structural Model and Loading of the Helical Gear Pump
For the structural solution I assigned 20CrMnTi alloy steel to the driving and driven helical gear shafts, aluminium alloy ZL111 to the housing, the front cover and the rear cover, 7068 aluminium alloy to the hydrostatic plain bearings, plain carbon steel to the bolts and nitrile rubber to the seals. The material data used throughout the coupled analysis are collected below.
| Component | Material | Density (kg/m³) | Yield strength (MPa) | Thermal conductivity (W/m·K) |
|---|---|---|---|---|
| Driving and driven helical gear shafts | 20CrMnTi | 7850 | 850 | 44.5 |
| Front and rear covers | ZL111 | 2700 | 260 | 130 |
| Housing | ZL111 | 2700 | 260 | 130 |
| Hydrostatic bearings | 7068 aluminium | 2850 | 603 | 140 |
| Hexagonal bolts | 35 carbon steel | 7580 | 355 | 50 |
| Seals and oil seals | NBR | 1200 | — | 0.2 |
The contact between the two helical gear rotors was defined as frictionless because a continuous oil film separates the flanks. The contact between each helical gear shaft and its hydrostatic bearing was defined as frictional with a coefficient of 0.01 to represent the lubricating film. Bonded contacts were used between the bearings and the housing, between the covers and the housing, and between the bolts and the washers, while frictionless contacts were used between the bolts and the clamped parts and between the seals and their grooves. Every bolt carried a preload of 100 N. The loading applied to the structural model is listed in the next table.
| Load case | Value |
|---|---|
| Motor torque | 10 000 N·mm |
| Compensating force on driving helical gear bearing | 4957 N |
| Compensating force on driven helical gear bearing | 6667 N |
| Axial compensating force on driving shaft | 1133 N |
| Fluid pressure on wetted surfaces | from CFD solution |
| Temperature on wetted surfaces | from CFD solution |
Static Response of the Coupled Helical Gear Pump
Under the rated condition of 10 000 r/min and 25 MPa, the equivalent stress of the helical gear pump is concentrated at the hydrostatic bearings and along the interface between the fluid domain and the solid domain. The suction region carries an equivalent stress of about 55 MPa and the delivery region about 80 MPa. The contact patch between the bearing and the driving helical gear shaft reaches 236.1 MPa, and the global maximum of 493.4 MPa occurs on the contact patch between the bearing and the driven helical gear shaft. Since the bearing material has a yield strength of 603 MPa, the peak stress remains below the yield limit and no plastic deformation occurs in the helical gear pump.
The deformation field shows a different critical location. The largest displacement, 0.036 mm, appears on the front cover on the driving shaft side. This is the region where the thermal expansion of the helical gear rotor and the pressure load of the delivery pocket act in the same direction, and it is therefore the region in which the vibration amplitude of the helical gear pump is expected to be largest. I selected this area as one of the measurement points in the experimental campaign.
Dry Modal Analysis of the Helical Gear Pump
I first performed a dry modal analysis, in which the pump is surrounded by vacuum, to check the intrinsic stiffness distribution of the structure. The first two modes involve bending of the driving shaft, the first mode oscillating laterally and the second mode oscillating vertically. The third mode separates the diagonal fillets of the rear cover into two groups that swing in opposite directions along the axis of the helical gear. The fourth mode groups the two long fillets and makes them swing along the axis. The fifth mode makes all four fillets oscillate in phase along the axis, and the sixth mode is essentially the counterpart of the fourth mode with the short fillets grouped instead. The key observation from the dry analysis is that the keyway of the driving shaft and the fillets of the rear cover are the vibration-sensitive features of the helical gear pump.
Wet Modal Analysis under Thermal-Fluid-Solid Coupling
The wet modal analysis, in which the oil surrounding the helical gear rotor and the pressure and temperature fields of the coupled solution are included, produces a completely different set of mode shapes. The first wet mode is an axial stretching of the front cover and the housing. The second and third wet modes are tilting of the front cover and the housing in the plane perpendicular to the axis, in two mutually perpendicular directions. The fourth wet mode is a torsional oscillation of the front cover and the housing in the same perpendicular plane. The fifth and sixth wet modes are in-plane oscillations of the rear cover about its centre, again separated by ninety degrees.
The contrast with the dry modes is explained by the constraints that the coupled model imposes on the bolt holes of the rear cover and on the keyway. Once these features are constrained, their vibration is suppressed and the remaining flexible regions of the helical gear pump dominate the mode shapes. This result is important because it shows that a dry modal analysis of a helical gear pump can point to the wrong critical region.
Natural Frequency Comparison of the Helical Gear Pump
The natural frequencies obtained from the two modal analyses are compared in the following table.
| Order | Dry natural frequency (Hz) | Wet natural frequency (Hz) | Change (%) |
|---|---|---|---|
| 1 | 2686 | 1016 | 62.19 |
| 2 | 2705 | 1802 | 33.38 |
| 3 | 5802 | 2713 | 53.24 |
| 4 | 8371 | 5960 | 28.80 |
| 5 | 8480 | 6598 | 22.19 |
| 6 | 8774 | 7929 | 9.63 |
Every wet frequency is lower than the corresponding dry frequency, and the reduction is largest for the first mode, where it reaches 62.19 %. This behaviour is consistent with the added-mass effect of the oil: the fluid increases the total mass of the vibrating helical gear pump without contributing stiffness, and the viscous damping of the oil provides an additional energy-dissipation path. As the mode order increases, the participation of the fluid in the motion decreases, and the difference between the dry and wet frequencies shrinks accordingly.
Fatigue Life of the Coupled Helical Gear Pump
I predicted the fatigue life with the stress–life approach combined with the linear cumulative damage rule of Palmgren and Miner,
$$D=\sum_i\frac{n_i}{N_i}$$
where $n_i$ is the number of cycles actually applied at stress level $i$ and $N_i$ is the number of cycles that the material can sustain at that level. Failure is assumed when the accumulated damage reaches unity. The life contour of the helical gear pump shows that most of the structure belongs to the long-life region with a predicted life of roughly $4\times10^{11}$ s, while the short-life regions are the contact patches between the bearings and the two helical gear shafts and the neighbourhood of the bolt holes in the rear cover.
| Location | Minimum fatigue life (s) | Maximum fatigue damage |
|---|---|---|
| Driving helical gear shaft – bearing | $1.8479\times10^{10}$ | $5.4061\times10^{-10}$ |
| Driven helical gear shaft – bearing | $2.5289\times10^{10}$ | $3.9543\times10^{-10}$ |
| Rear cover bolt holes | $3.1356\times10^{10}$ | $3.1893\times10^{-10}$ |
The shortest life of the original helical gear pump, located at the junction of the driving helical gear rotor, the bearing and the housing, corresponds to a service duration of about 3.52 years at the rated speed. This satisfies the minimum requirement of three years of continuous operation but leaves little margin.
Structural Optimisation of the Helical Gear Pump
The theoretical relations derived for the meshing excitation indicate that increasing the mass of the helical gear rotor reduces the acceleration of the vibration displacement, and that increasing the stiffness and the damping reduces the displacement itself. Guided by these relations I increased the shaft diameter of both helical gear rotors from 10 mm to 12 mm while keeping it below the root circle diameter, and I replaced the shaft material with a higher-stiffness, higher-toughness alloy steel. The resulting changes in the delivery characteristics are summarised below.
| Time (s) | Mean flow after optimisation (L/min) | Mean flow before optimisation (L/min) | Pulsation after optimisation (%) | Pulsation before optimisation (%) | Volumetric efficiency after optimisation (%) | Volumetric efficiency before optimisation (%) |
|---|---|---|---|---|---|---|
| 0.2 | 45.5964 | 46.3414 | 10.11 | 22.82 | 91.66 | 91.37 |
| 0.4 | 45.7945 | 45.7365 | 12.96 | 18.26 | 91.58 | 91.38 |
| 0.6 | 45.8401 | 45.7165 | 5.08 | 7.53 | 91.59 | 91.36 |
| 0.8 | 45.7965 | 45.5873 | 18.06 | 24.97 | 91.65 | 91.36 |
| 1.0 | 45.8079 | 45.7165 | 17.69 | 22.65 | 91.62 | 91.42 |
The optimised helical gear pump delivers a mean flow of 45.8079 L/min, which is 0.2 % higher than the original design. The flow pulsation drops from 22.65 % to 17.69 %, a reduction of 28.05 %, and the volumetric efficiency rises by 0.2 % to 91.62 %. The fatigue hot spots remain at the same locations, but the minimum life increases to $1.9423\times10^{10}$ s, which corresponds to a service duration of about 3.69 years, an improvement of 4.8 % over the original helical gear pump. The simultaneous improvement of pulsation and life confirms that suppressing the meshing excitation of the helical gear is beneficial for both the hydraulic and the structural performance.
Rotor Response under Different Coupling Conditions
The helical gear rotor is the component that carries the torque, transmits the meshing force and is wetted by the hot oil, so I examined its deformation under four different load cases: torque only, fluid–solid coupling, thermal–solid coupling and full thermal–fluid–solid coupling. The results are collected in the next table.
| Load case | Maximum deformation (mm) | Location of maximum deformation |
|---|---|---|
| Torque only | 0.0010 | Keyway and meshing flank |
| Fluid–solid coupling | 0.0028 | Meshing flank and tooth surface |
| Thermal–solid coupling | 0.0083 | Meshing flank and tooth tip |
| Thermal–fluid–solid coupling | 0.0090 | Meshing flank and tooth tip |
Torque alone produces a very small deformation concentrated at the keyway and at the meshing point. Adding the fluid pressure spreads the deformation over the whole tooth surface and roughly triples the peak value. Replacing the pressure load with the temperature load, however, increases the peak deformation by a factor of almost three again, which demonstrates that the thermal field is a far stronger driver of deformation than the pressure field. The fully coupled case produces the largest deformation of all, confirming that pressure and temperature act cumulatively on the helical gear rotor.
Modal Behaviour of the Rotor
Without prestress the modes of the helical gear rotor are dominated by bending and torsion of the toothed section, forming composite shapes. The first and third modes bend about one transverse axis, with the third mode showing the larger amplitude. The second mode combines bending about the other transverse axis with torsion about the shaft axis, and the amplitudes of the driving helical gear exceed those of the driven one. The fourth mode combines bending and torsion in the same direction for both rotors, the fifth mode combines bending with the largest torsional amplitude in opposite directions for the two rotors, and the sixth mode is essentially an axial expansion.
Under thermal–fluid–solid coupling the mode shapes change considerably. The first mode becomes an axial expansion whose amplitude grows towards the keyway. The second, third and sixth modes are composite vibrations whose amplitude peaks near the middle of the helical gear shaft. The fourth and fifth modes are both torsional about the shaft axis, differing in the direction along which the maximum bending amplitude occurs. In general the deformation of the helical gear rotor is concentrated on the shaft, and the bending and torsional amplitudes are much larger than in the unstressed case.
| Order | Natural frequency without prestress (Hz) | Natural frequency under thermal–fluid–solid coupling (Hz) | Change (%) |
|---|---|---|---|
| 1 | 4344 | 1610 | 62.93 |
| 2 | 4502 | 2305 | 48.80 |
| 3 | 5639 | 2461 | 56.35 |
| 4 | 5650 | 4043 | 28.43 |
| 5 | 6061 | 4405 | 27.32 |
| 6 | 6450 | 4811 | 25.40 |
The average natural frequency of the helical gear rotor falls by 41.53 % when the thermal and fluid loads are applied, and the first mode is the most affected. Because the first natural frequency governs the transition from a rigid rotor to a flexible rotor, this reduction has direct consequences for the allowable operating speed of the helical gear pump.
Critical Speed of the Helical Gear Pump
The critical speed of the rotor is related to its first natural frequency by
$$n=60f$$
Using this relation, the critical speed of the helical gear rotor is 260 640 r/min without prestress and 96 600 r/min under thermal–fluid–solid coupling. The rated speed of the helical gear pump is 10 000 r/min, which is well below 0.6 times the coupled critical speed. The shaft frequency is
$$f_1=\frac{10\,000}{60}=166.7\ \text{Hz}$$
and, with seven teeth on each helical gear, the delivery pulsation frequency is
$$f_2=zf_1=7\times166.7=1166.9\ \text{Hz}$$
Both the shaft frequency and the delivery pulsation frequency are far below the first natural frequency of the coupled rotor, so the helical gear pump operates as a rigid rotor and no resonant amplification of the meshing excitation is expected at the rated condition.
Experimental Platform for the Helical Gear Pump
I built a dedicated test rig consisting of a hydraulic workstation and a vibration data acquisition system. The workstation comprises an 800 L stainless-steel reservoir, suction and return filters, an air breather, a level gauge, pressure gauges and the associated valves. The helical gear pump is coupled to a servo motor through a diaphragm coupling. Three accelerometers with a sensitivity of 10.18 mV/(m/s²), a measuring range of ±961 m/s² and a frequency response from 0.3 Hz to 6 kHz were mounted on the suction port, the delivery port and the rim of the front cover. A temperature sensor was placed on the front cover to monitor the thermal state. The signals were recorded by a dynamic signal acquisition system with an industrial computer, a shock-mounted high-capacity storage unit, a gigabit Ethernet interface and a battery pack, which makes the system suitable for measurements in harsh environments.
| Device | Type | Measurement position |
|---|---|---|
| Accelerometer | LW 204165 | Suction port of the helical gear pump |
| Accelerometer | LW 146976 | Rim of the front cover |
| Accelerometer | LW 204182 | Delivery port of the helical gear pump |
| Turbine flow meter | LWY-WB15, DN15, 25 MPa | Return line of the workstation |
| Pressure transmitter | TY-811-A1, 0–40 MPa, ±0.2 % | Return line of the workstation |
I selected the three measurement positions because the flow-field solution shows a large pressure difference between the suction and delivery ports and because the static analysis identifies the rim of the front cover as the region of maximum deformation. The test matrix combined three rotational speeds, 4000, 6000 and 8000 r/min, with four delivery pressure loads, 0, 5, 10 and 15 MPa, so that the influence of each variable could be isolated.
Signal Decomposition with the Improved Complete Ensemble Empirical Mode Decomposition
The raw acceleration signals of the helical gear pump are non-stationary and contaminated by noise, so I decomposed them with the improved complete ensemble empirical mode decomposition with adaptive noise, which suppresses the residual noise that remains in the earlier variants of the method and avoids the spurious modes that appear at the beginning of the decomposition. The recursive steps of the algorithm are
$$x_i(t)=x(t)+\beta_0 E_1\left(w_i(t)\right)$$
$$r_1=M\left(x_i(t)\right),\qquad IMF_1=x(t)-r_1$$
$$r_k=M\left(r_{k-1}+\beta_{k-1}E_k\left(w_i(t)\right)\right),\qquad IMF_k=r_{k-1}-r_k$$
where $E_k$ denotes the operator that extracts the $k$-th empirical mode, $M$ denotes the operator that produces the local mean of the signal, $w_i$ is a realisation of zero-mean unit-variance white noise and $\beta$ controls the signal-to-noise ratio at each stage. This scheme guarantees that the sum of the resulting intrinsic mode functions and the residue reproduces the original signal of the helical gear pump exactly.
Selection of the Dominant Intrinsic Mode Function
To decide which intrinsic mode function carries the physically meaningful information about the helical gear pump, I combined two indicators. The fuzzy entropy quantifies the uncertainty of the sample set, and the kurtosis quantifies the impulsiveness of the signal. I defined the composite index
$$K=Y_{FE}+\frac{1}{K_{ur}}$$
with the fuzzy entropy $Y_{FE}$ and the kurtosis
$$K_{ur}=\frac{\sum_i\left(IMF_i-\mu_i\right)^4}{\sigma_i^4}$$
A smaller value of $K$ indicates a component that is both impulsive and well correlated with the original signal, which is exactly what is needed when the objective is to identify the excitation of the helical gear pump. The values obtained for the operating point of 6000 r/min and 15 MPa are listed below.
| Component | Fuzzy entropy $Y_{FE}$ | Kurtosis $K_{ur}$ | Composite index $K$ |
|---|---|---|---|
| IMF1 | 4.1446 | 0.4742 | 6.2534 |
| IMF2 | 3.8272 | 0.3169 | 6.9828 |
| IMF3 | 5.3870 | 0.5209 | 7.3068 |
| IMF4 | 6.4688 | 0.6370 | 8.2187 |
| IMF5 | 6.1537 | 0.4969 | 8.1662 |
| IMF6 | 3.5575 | 0.1190 | 11.9609 |
| Residue | 2.1096 | 0.0023 | 436.89 |
The first intrinsic mode function has the smallest composite index, and its dominant frequency band coincides with that of the original acceleration signal, so all subsequent vibration analyses of the helical gear pump were carried out on IMF1.
Spatial Distribution of the Vibration of the Helical Gear Pump
Comparing the three measurement positions reveals a clear hierarchy. At 4000 r/min and zero delivery pressure the three acceleration traces are similar and the amplitudes are small, which indicates that the helical gear pump behaves almost as a rigid body and that the excitation is weak. As the speed increases to 6000 and 8000 r/min, the amplitudes grow and the three positions diverge. At zero pressure the delivery port shows the largest amplitude, while the suction port and the front cover rim are comparable. At 15 MPa the front cover rim slightly exceeds the suction port, which shows that the pressure load redistributes the vibration of the helical gear pump rather than simply scaling it.
| Operating point | Suction port (m/s²) | Delivery port (m/s²) | Front cover rim (m/s²) |
|---|---|---|---|
| 4000 r/min, 0 MPa | 1.02 | 1.18 | 1.05 |
| 6000 r/min, 0 MPa | 2.41 | 2.86 | 2.47 |
| 8000 r/min, 0 MPa | 5.02 | 6.34 | 5.18 |
| 6000 r/min, 15 MPa | 4.33 | 4.91 | 4.52 |
| 8000 r/min, 15 MPa | 8.16 | 8.74 | 8.39 |
Because the delivery port is the junction between the internal flow field of the helical gear pump and the external circuit, it is the most informative single location, and I focused the subsequent analysis on that position.
Influence of Rotational Speed on the Vibration of the Helical Gear Pump
At a constant pressure load the vibration amplitude of the helical gear pump grows monotonically with rotational speed, and the rate of growth itself increases with speed. The measured peak amplitudes of IMF1 at zero pressure are 2.63, 5.26 and 11.36 m/s² at 4000, 6000 and 8000 r/min respectively, so doubling the speed from 4000 to 8000 r/min multiplies the amplitude by more than four. The same trend appears at 15 MPa, where the amplitudes are larger at every speed.
| Speed (r/min) | Peak frequency at 0 MPa (Hz) | Peak amplitude at 0 MPa | Peak frequency at 15 MPa (Hz) | Peak amplitude at 15 MPa |
|---|---|---|---|---|
| 4000 | 642.9 | 0.23 | 634.8 | 0.17 |
| 6000 | 651.3 | 0.23 | 634.8 | 0.51 |
| 8000 | 683.7 | 0.67 | 634.8 | 1.07 |
Under zero pressure the dominant frequency shifts upwards as the speed rises, from 642.9 to 651.3 to 683.7 Hz, whereas under 15 MPa the dominant frequency remains fixed at 634.8 Hz and only the amplitude grows. The fixed frequency under load indicates that the excitation is locked to a structural resonance or to a cavitation-driven frequency that depends on the delivery pressure through
$$f_c\approx\frac{1.093}{R_B}\sqrt{\frac{p_\infty}{\rho_l}}$$
rather than on the rotational speed alone. The growth of the amplitude with speed, on the other hand, follows from the quadratic dependence of the inertial excitation of the helical gear on the angular velocity.
Influence of Pressure Load on the Vibration of the Helical Gear Pump
The dependence of the vibration of the helical gear pump on the delivery pressure is not monotonic. At 6000 r/min the amplitude increases from 0 to 5 MPa, decreases slightly at 10 MPa and increases again at 15 MPa. At 8000 r/min the amplitude increases from 0 to 10 MPa and then decreases at 15 MPa. The pressure at which the amplitude reverses therefore depends on the rotational speed, which suggests that two competing mechanisms are at work.
| Speed (r/min) | Pressure (MPa) | Dominant frequency (Hz) | Peak amplitude |
|---|---|---|---|
| 6000 | 0 | 667.5 | 0.47 |
| 6000 | 5 | 667.5 | 0.91 |
| 6000 | 10 | 618.8 | 0.84 |
| 6000 | 15 | 683.7 | 1.30 |
| 8000 | 0 | 683.7 | 0.68 |
| 8000 | 5 | 634.8 | 1.12 |
| 8000 | 10 | 634.8 | 1.29 |
| 8000 | 15 | 683.7 | 1.01 |
On the one hand, a higher delivery pressure increases the meshing force of the helical gear, raises the bearing reaction and therefore increases the broadband excitation. On the other hand, the same pressure suppresses cavitation in the separating region of the helical gear mesh, because the local pressure remains above the vapour pressure for a longer part of the cycle. The competition between these two effects explains why the amplitude curve has a local minimum in the intermediate pressure range, and why the location of that minimum depends on speed: a higher speed increases the cavitation intensity and therefore shifts the balance point.
Root-Mean-Square Analysis of the Vibration of the Helical Gear Pump
The root-mean-square value of the acceleration is the most convenient single-number descriptor of the vibration energy of the helical gear pump,
$$RMS=\sqrt{\frac{1}{n}\sum_{i=1}^{n}x_i^2}$$
Applying this metric to the IMF1 component at every operating point gives the results in the following table.
| Pressure (MPa) | RMS at 4000 r/min | RMS at 6000 r/min | RMS at 8000 r/min |
|---|---|---|---|
| 0 | 0.61 | 1.18 | 2.74 |
| 5 | 0.79 | 1.66 | 3.31 |
| 10 | 0.68 | 1.42 | 3.58 |
| 15 | 1.07 | 2.15 | 3.02 |
At a fixed pressure the RMS value increases with speed, and the increase is steepest between 6000 and 8000 r/min at low and intermediate pressures. At 15 MPa the increase is steepest between 4000 and 6000 r/min and flattens at higher speed. At a fixed speed the RMS value first rises, then falls in the intermediate pressure range and then rises again at 4000 and 6000 r/min, while at 8000 r/min it rises up to 10 MPa and then falls at 15 MPa. The RMS results therefore reproduce the same non-monotonic behaviour that the time-domain and spectral analyses revealed, which strengthens the confidence in the interpretation.
Physical Interpretation of the Coupled Vibration Behaviour
Bringing the theoretical, numerical and experimental results together, I can state the mechanism that governs the vibration of the high-speed circular-arc helical gear pump as follows. The meshing of the helical gear pair generates a periodic force whose spectrum is determined by the tooth number and the rotational speed, and whose amplitude is set by the meshing stiffness. Temperature changes the meshing stiffness of the helical gear in two opposite ways that partly cancel: the tooth flank expands and reduces the backlash, which increases the contact area and the stiffness, while the elastic modulus of the material decreases with temperature, which reduces the stiffness. In my simulations the first effect dominates, so the meshing stiffness of the helical gear increases and the excitation spectrum shifts upwards.
Simultaneously, the temperature of the oil in the meshing zone rises and the local vapour pressure rises with it. A higher vapour pressure delays the onset of cavitation and reduces the number of collapsing bubbles per cycle, but the bubbles that do form grow faster, as shown by the temperature-dependent bubble growth rate. The net effect on the cavitation vibration frequency is a reduction, in agreement with the measured shift of the dominant peak towards lower frequencies under load at 6000 r/min.
The structural response amplifies whichever excitation falls closest to a natural frequency of the coupled helical gear pump. Because the wet natural frequencies are 60 % lower than the dry values, and because the operating excitation band lies between 500 and 800 Hz, the pump is not at risk of resonance at the rated speed but approaches the first wet natural frequency of the rotor at the highest speed and pressure tested. This is consistent with the observation that the amplitude growth with speed becomes steeper once the pressure load is high, and it identifies the first wet mode of the helical gear rotor as the design constraint that limits further speed increase.
Concluding Remarks
I investigated the vibration behaviour of a high-speed circular-arc helical gear pump under thermal-fluid-solid coupling by combining an analytical temperature-rise model, a full cavitation model, a coupled finite-element and finite-volume solution and a dedicated experimental campaign. The following conclusions follow from my work.
First, the temperature rise inside the helical gear pump is produced by three identifiable mechanisms, namely viscous friction of the oil, the pressure difference across the tooth pocket and the specific enthalpy difference between the inlet and the outlet. The corresponding control equation that I derived reproduces all three and provides the thermal boundary condition for the coupled solution.
Second, the meshing stiffness of the helical gear pair increases when the thermal expansion of the flanks is taken into account, whereas the cavitation frequency of the helical gear pump decreases because the local vapour pressure rises with temperature. These two effects act on different frequency bands and their superposition shapes the measured spectrum.
Third, the flow field of the helical gear pump exhibits a staircase pressure rise from suction to delivery, a temperature maximum concentrated in the meshing zone, and a cavitation region confined to the side on which the helical gear teeth separate. The static analysis shows that the equivalent stress stays below the yield strength of every material, and the fatigue analysis gives a minimum service duration of 3.52 years, which the geometric optimisation of the helical gear rotor extends to 3.69 years while simultaneously reducing the flow pulsation by 28.05 %.
Fourth, the dry and wet modal analyses of the helical gear pump differ substantially. The wet natural frequencies are lower at every order, the first wet frequency being reduced by 62.19 %, and the mode shapes migrate from the keyway and the rear cover fillets to the housing and cover edges once the bolt holes and the keyway are constrained. The rotor behaves in the same way, with the average natural frequency under thermal-fluid-solid coupling falling by 41.53 %.
Fifth, the rotor deformation is dominated by the thermal load rather than by the torque or the fluid pressure. The maximum deformation increases from 0.0010 mm under torque alone to 0.0090 mm under full coupling, and the critical speed falls from 260 640 r/min to 96 600 r/min. The rated speed of the helical gear pump is well below 0.6 times the coupled critical speed, and both the shaft frequency and the delivery pulsation frequency are far from the first natural frequency of the rotor.
Sixth, the experimental results show that the delivery port of the helical gear pump vibrates more strongly than the suction port and the front cover rim at low and intermediate pressures, while the front cover rim becomes comparable at high pressure. The vibration amplitude grows with rotational speed at every pressure, and the growth becomes steeper as the pressure rises. At constant speed the amplitude grows with pressure overall but displays a local reduction at a pressure that depends on the speed, reflecting the competition between the increased meshing force and the suppressed cavitation. The root-mean-square values reproduce the same trend and confirm that the vibration energy of the helical gear pump is governed jointly by the rotational speed and the delivery pressure.
The results that I obtained provide a quantitative basis for evaluating the performance of a circular-arc helical gear pump and for guiding further structural optimisation of the helical gear rotor, the housing and the hydrostatic bearings. They also indicate two directions that deserve further work: a fully two-way thermal-fluid-solid coupling formulation, in which the structural deformation modifies the flow field in return, and vibration measurements at the rated pressure so that the numerical predictions can be validated over the complete operating envelope of the helical gear pump.