
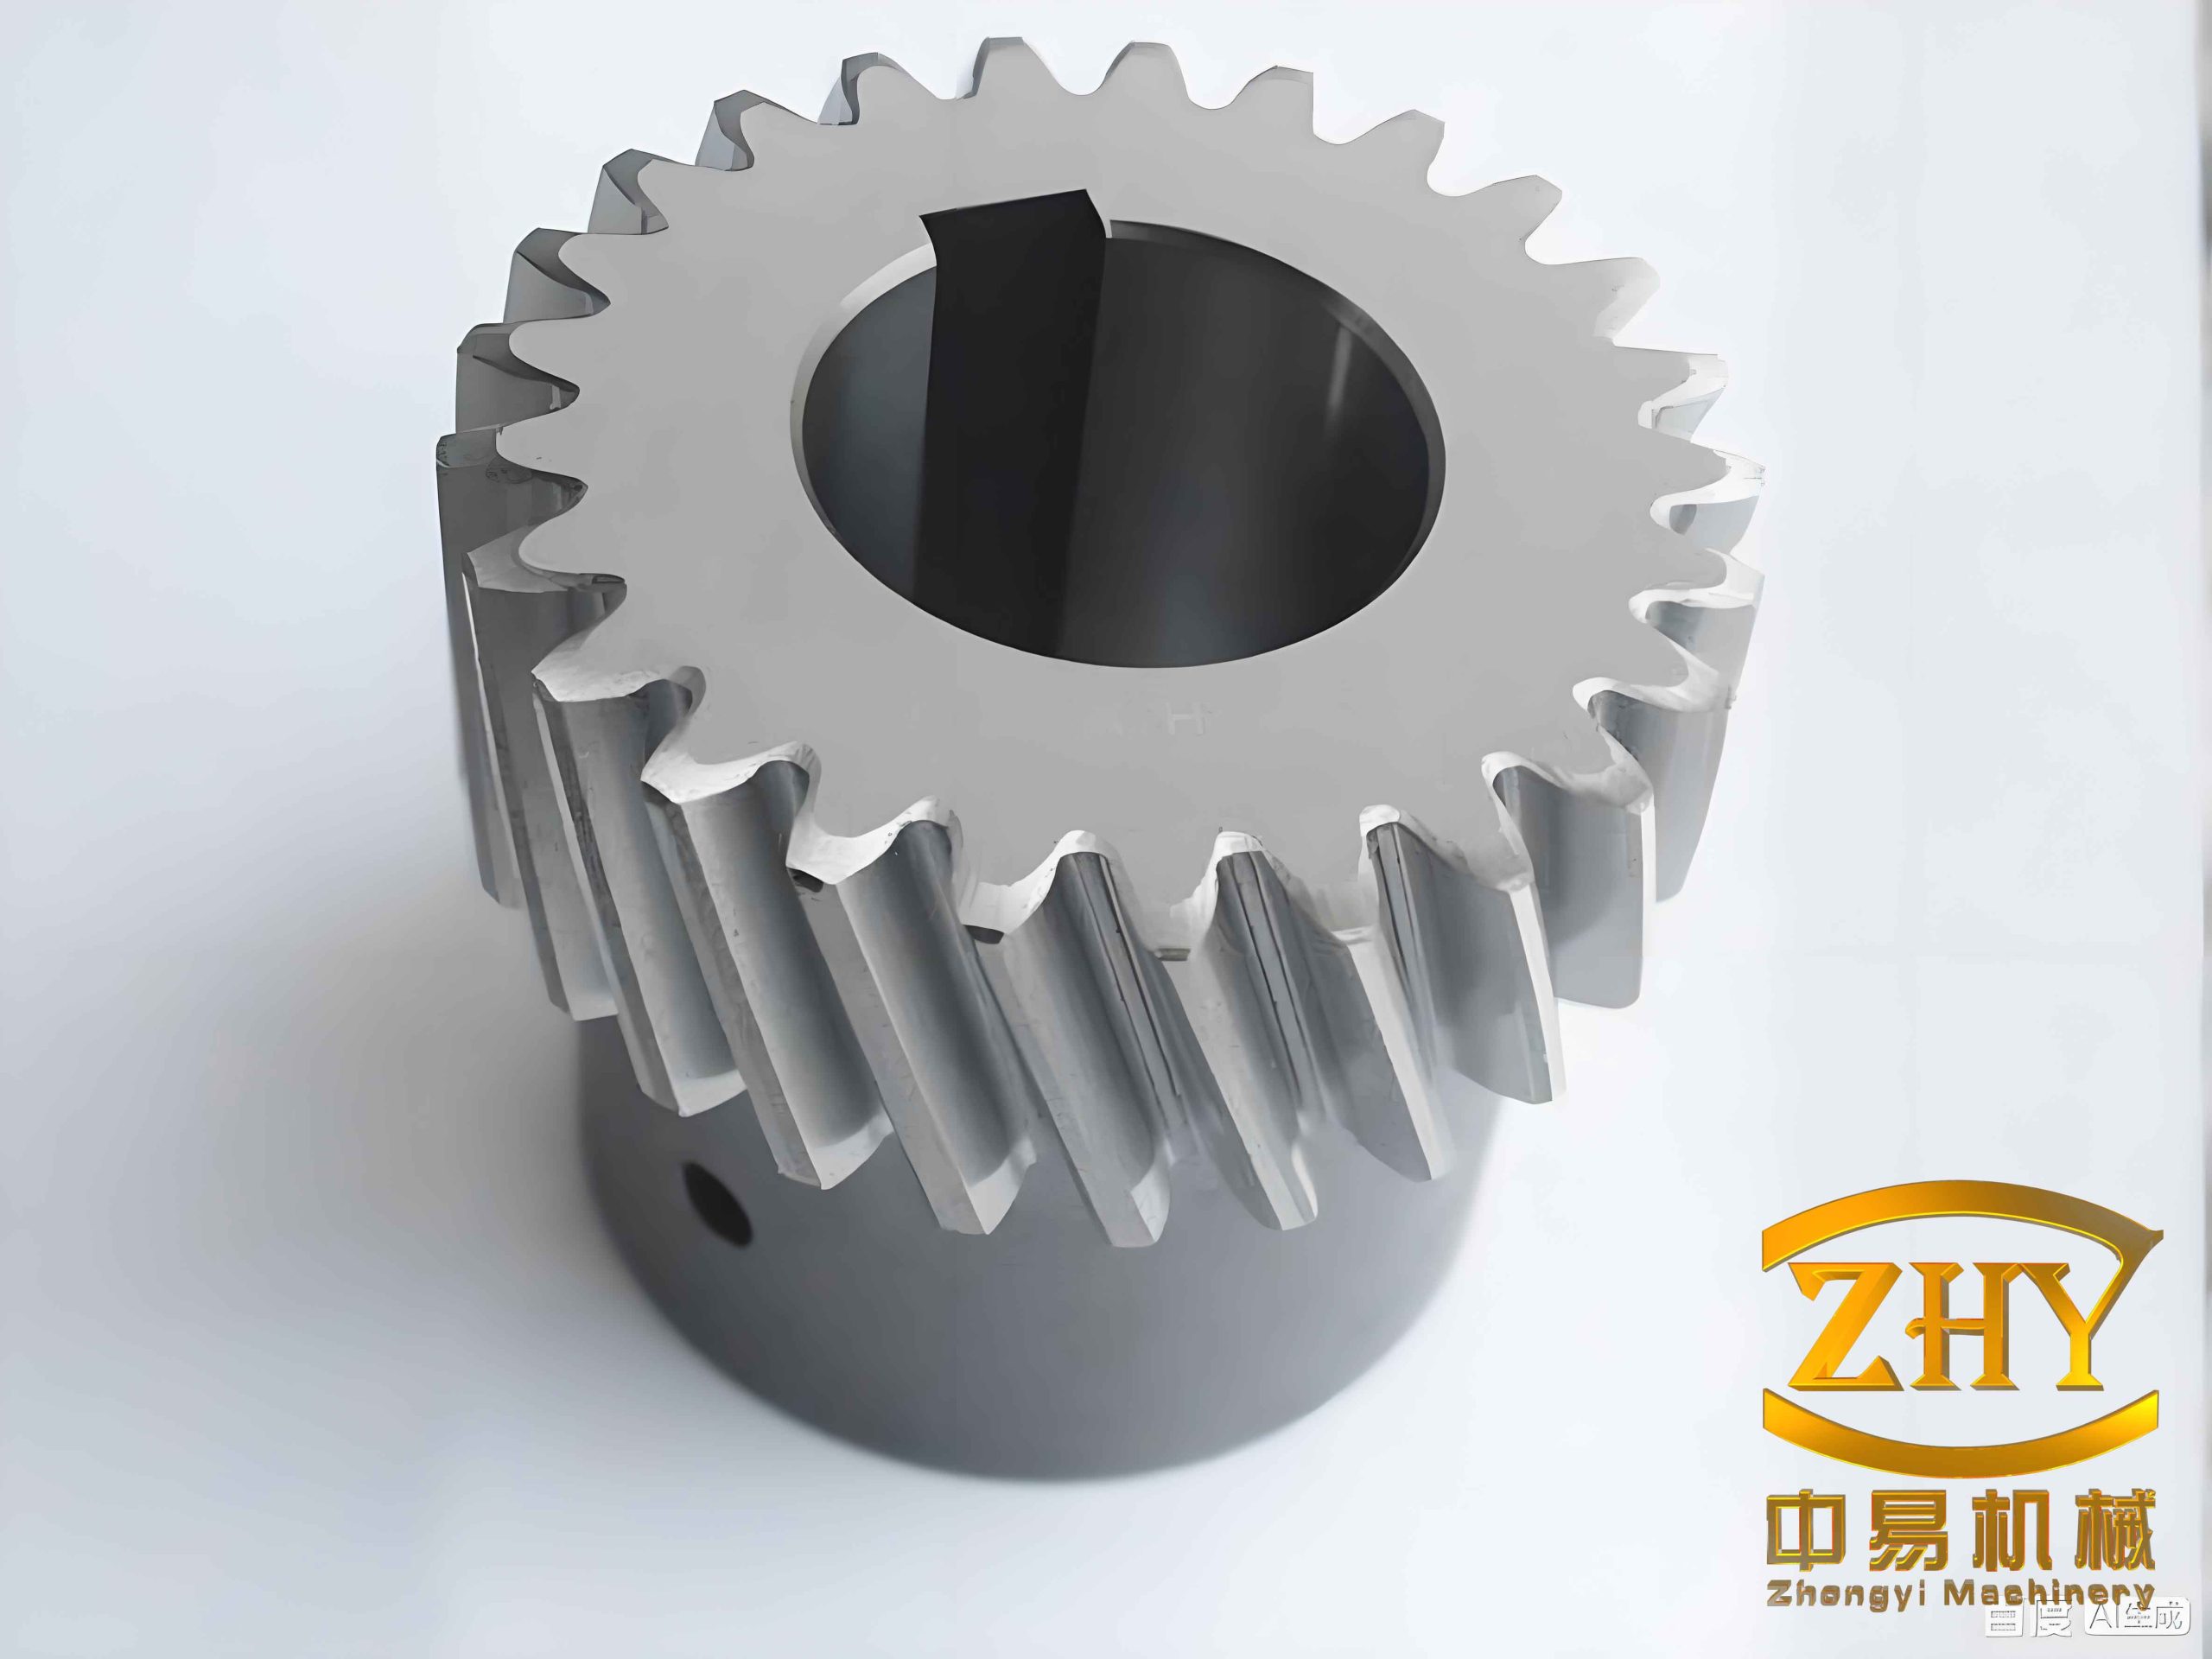
I studied the high-frequency moving induction quenching process of a helical gear because the surface integrity, tooth-profile hardness, and dimensional stability of a helical gear strongly influence the reliability of mechanical transmissions. A helical gear is widely used in engineering machinery, aerospace drives, reducers, and high-load transmission systems. Compared with a spur gear, a helical gear has a larger contact area, smoother meshing, lower noise, and better load-carrying capacity. However, the inclined tooth trace of a helical gear also makes uniform surface heating more difficult. I therefore focused on a moving induction heating strategy that combines axial translation and axial rotation so that a profiled induction coil can scan the helical gear tooth surface in a cyclic manner. My objective was to obtain a uniform temperature field, controlled austenite transformation, uniform martensite formation, and a hard surface layer on the helical gear without excessive cracking or distortion.
I began from the fundamental physics of induction heating. When an alternating current flows through a profiled induction coil, an alternating magnetic field is generated around the coil. For a conductive helical gear placed in this field, the changing magnetic flux induces an electromotive force and a closed eddy current. The eddy current generates Joule heat in the surface layer of the helical gear. Because the electrical resistivity of steel is relatively low and the induced current is concentrated near the surface, the heat is mainly generated within a thin surface zone. This is the basis of surface quenching of a helical gear by high-frequency moving induction heating.
The electromagnetic field in the helical gear and the profiled induction coil can be described by Maxwell equations. I used the differential form:
$$
\nabla \times \boldsymbol{H} = \boldsymbol{J} + \frac{\partial \boldsymbol{D}}{\partial t}
$$
$$
\nabla \times \boldsymbol{E} = -\frac{\partial \boldsymbol{B}}{\partial t}
$$
$$
\nabla \cdot \boldsymbol{D} = 0
$$
$$
\nabla \cdot \boldsymbol{B} = 0
$$
Here, \(\boldsymbol{H}\) is the magnetic field intensity, \(\boldsymbol{J}\) is the current density, \(\boldsymbol{D}\) is the electric displacement, \(\boldsymbol{E}\) is the electric field intensity, and \(\boldsymbol{B}\) is the magnetic flux density. The constitutive relations are:
$$
\boldsymbol{D} = \varepsilon \boldsymbol{E}
$$
$$
\boldsymbol{J} = \sigma \boldsymbol{E}
$$
$$
\boldsymbol{B} = \mu \boldsymbol{H}
$$
where \(\varepsilon\) is the permittivity, \(\sigma\) is the electrical conductivity, and \(\mu\) is the magnetic permeability. I also introduced the magnetic vector potential \(\boldsymbol{A}\) and the electric scalar potential \(\phi\) so that:
$$
\boldsymbol{B} = \nabla \times \boldsymbol{A}
$$
$$
\boldsymbol{E} = -\frac{\partial \boldsymbol{A}}{\partial t} – \nabla \phi
$$
Substituting these expressions into the current-density relation gives the equation that I used in the electromagnetic solver:
$$
\boldsymbol{J} = \sigma \boldsymbol{E} = -\sigma \frac{\partial \boldsymbol{A}}{\partial t} – \sigma \nabla \phi
$$
For high-frequency induction heating of a helical gear, the skin effect is dominant. The current density decays from the surface toward the interior. I described the current density at a distance \(x\) from the surface as:
$$
I_x = I_0 e^{-x/\delta}
$$
where \(I_0\) is the surface current density and \(\delta\) is the current penetration depth. I calculated the penetration depth from:
$$
\delta = \sqrt{\frac{\rho}{\pi f \mu}}
$$
In this expression, \(\rho\) is the electrical resistivity, \(f\) is the current frequency, and \(\mu\) is the magnetic permeability. The skin depth is therefore a function of material properties and frequency. For a helical gear, this means that the high-frequency current mainly heats the tooth flank, tooth tip, and tooth root surface, while the core remains relatively cool. I used this behavior to create a hard surface layer while retaining a tough core.
The volumetric heat source produced by the eddy current is:
$$
q_v = \rho J^2
$$
where \(q_v\) is the internal heat generation rate per unit volume and \(J\) is the eddy current density. The transient heat conduction equation for the helical gear during moving induction heating is:
$$
\rho c \frac{\partial T}{\partial t} = \frac{\partial}{\partial x}\left(k \frac{\partial T}{\partial x}\right) + \frac{\partial}{\partial y}\left(k \frac{\partial T}{\partial y}\right) + \frac{\partial}{\partial z}\left(k \frac{\partial T}{\partial z}\right) + q_v
$$
where \(T\) is temperature, \(c\) is specific heat capacity, \(\rho\) is density, and \(k\) is thermal conductivity. At the surface of the helical gear, I applied convection and radiation boundary conditions:
$$
-k \frac{\partial T}{\partial n} = h(T_w – T_f)
$$
$$
-k \frac{\partial T}{\partial n} = \varepsilon \sigma (T_w^4 – T_f^4)
$$
Here, \(h\) is the convective heat transfer coefficient, \(T_w\) is the workpiece surface temperature, \(T_f\) is the surrounding fluid temperature, \(\varepsilon\) is emissivity, and \(\sigma\) is the Stefan-Boltzmann constant. During induction heating, convection to air is small compared with the generated Joule heat. During quenching, however, convection to the cooling medium becomes the dominant heat-loss mechanism.
I also modeled phase transformations in the helical gear. For diffusion-controlled transformations such as the formation of austenite from pearlite and ferrite, I used the Avrami equation:
$$
\xi_{CP} = 1 – \exp\left[-b(T)t^{n(T)}\right]
$$
where \(\xi_{CP}\) is the transformed volume fraction, \(b(T)\) and \(n(T)\) are temperature-dependent coefficients, and \(t\) is time. For continuous heating and cooling, I wrote the equation in differential form:
$$
\frac{d\xi_{CP}}{dt} =
\left[
-\ln(1-\xi_{CP})
\right]^{\frac{n(T)-1}{n(T)}}
b(T)n(T)(1-\xi_{CP})
$$
For austenite formation under continuous heating, I used a Johnson-Mehl-Avrami-Kolmogorov form:
$$
\xi = 1 – \exp\left[-D_0 t^n \exp\left(-\frac{Q}{RT_{abs}}\right)\right]
$$
where \(D_0\) is a pre-exponential factor, \(Q\) is activation energy, \(R\) is the gas constant, and \(T_{abs}\) is absolute temperature. For the non-diffusion transformation from austenite to martensite, I used the Koistinen-Marburger equation:
$$
\xi_m = \xi_a \left[1 – \exp\left(-\Omega(T_{MS} – T)\right)\right]
$$
where \(\xi_m\) is the martensite volume fraction, \(\xi_a\) is the parent austenite volume fraction, \(T_{MS}\) is the martensite start temperature, and \(\Omega\) is a constant. I used these equations to track the evolution of pearlite, ferrite, austenite, martensite, and retained phases in the helical gear.
The total strain in the helical gear during induction quenching includes thermal strain, elastic strain, plastic strain, transformation strain, and transformation-induced plastic strain:
$$
\varepsilon^{total} = \varepsilon^{th} + \varepsilon^{e} + \varepsilon^{p} + \varepsilon^{tr} + \varepsilon^{tp}
$$
The thermal strain is calculated from the contributions of all phases:
$$
d\varepsilon^{th} = \sum_i \xi_i \alpha_i dT
$$
where \(\xi_i\) is the volume fraction of phase \(i\) and \(\alpha_i\) is its thermal expansion coefficient. The elastic and plastic parts are calculated using an elastoplastic constitutive model. I used a Prandtl-Reuss formulation of the form:
$$
d\varepsilon^{e} + d\varepsilon^{p} =
\frac{3}{2G}d\boldsymbol{\sigma} +
\frac{3}{2\sigma_{eff}}d\varepsilon^{p}\boldsymbol{\sigma}
$$
The transformation strain due to volume change is:
$$
d\varepsilon^{tr} = \sum_i \beta_i d\xi_i
$$
where \(\beta_i\) is the volume-change coefficient for phase \(i\). The transformation-induced plastic strain is represented by:
$$
d\varepsilon^{tp} = D(1-\xi_i)d\xi_i
$$
where \(D\) is a transformation plasticity parameter. These equations allowed me to evaluate residual stress and distortion after quenching of the helical gear.
I selected a 45 steel helical gear as the research object. The nominal chemical composition is summarized in Table 1. The material behavior changes strongly with temperature, especially near the Curie point, so I imported temperature-dependent thermal, electrical, and magnetic properties into the numerical model.
| Element | C | Si | Mn | Cr | Ni | Cu |
|---|---|---|---|---|---|---|
| Mass fraction (%) | 0.42-0.50 | 0.17-0.37 | 0.50-0.80 | ≤0.25 | ≤0.30 | ≤0.25 |
I established a three-dimensional finite element model of the helical gear and a profiled induction coil. The helical gear had a module of 6 mm, 12 teeth, a tooth width of 40 mm, and a helix angle of 10°. I designed a profiled induction coil with a hollow rectangular cross section. The coil was not a perfect copy of the tooth profile. Instead, I increased the clearance near the tooth tip to weaken the concentration of magnetic flux lines caused by the sharp corner effect. This local geometric adjustment was important for the helical gear because the tooth tip otherwise tended to overheat before the tooth flank reached the required quenching temperature.
| Parameter | Value | Parameter | Value |
|---|---|---|---|
| Module \(m\) | 6 mm | Coil-to-tip distance \(l\) | 5.5 mm |
| Number of teeth \(z\) | 12 | Coil-to-root distance \(h\) | 2 mm |
| Tooth width \(b\) | 40 mm | Coil cross-sectional area \(s\) | 3252.5 mm² |
| Helix angle \(\beta\) | 10° | Coil axial width | 10 mm |
| Pitch \(p\) | 18.6 mm | Current density \(\rho_J\) | \(7.5 \times 10^7\) A/m² |
| Pitch diameter \(d\) | 85.9 mm | Current frequency \(f\) | 80 kHz |
For the mesh, I used a layered optimization strategy. The tooth surface, tooth flank, and tooth root of the helical gear were meshed with fine hexahedral elements. The element size along the tooth width direction was kept uniform because the moving induction heating scans along this direction. The interior and core of the helical gear were meshed with tetrahedral elements, and the element size increased gradually from the surface toward the core. This reduced the total number of elements while preserving accuracy in the surface layer where phase transformation and hardness develop.
I proposed a cyclic scanning moving induction heating method. The helical gear moves along its axis and rotates around its axis at the same time. The instantaneous axial velocity \(v_t\) and the instantaneous angular velocity \(\omega_t\) are coupled by the helix angle \(\beta\):
$$
v_t = \omega_t r \tan\beta
$$
where \(r\) is the pitch radius of the helical gear. This kinematic relation ensures that the tooth surface remains at a nearly constant distance from the profiled induction coil during scanning. Because the helix angle is constant, a change in axial velocity requires a proportional change in angular velocity, and vice versa. I used this relationship to program the motion of the helical gear relative to the fixed induction coil.
| Motion stage | Axial speed \(v\) (mm/s) | Angular speed \(\omega\) (rad/s) |
|---|---|---|
| Entry segment 1 | 160 | 0.658 |
| Middle segment 1 | 240 | 0.985 |
| Exit segment 1 | 160 | 0.658 |
| Return entry segment | -160 | -0.658 |
| Return middle segment | -240 | -0.985 |
| Return exit segment | -160 | -0.658 |
The cyclic scanning strategy was designed to reduce the end-face effect. If the helical gear moves at a constant speed through the coil, the two end faces often receive less heat than the middle region. By slowing the motion near the entry and exit positions and accelerating it in the middle, I achieved a more balanced heat input along the tooth width. The helical gear passed through the profiled coil repeatedly. Each cycle added heat to the surface layer, while thermal conduction redistributed heat from hotter regions to cooler regions. This combination of electromagnetic heating and thermal conduction produced a more uniform temperature field on the helical gear.
I used a sequential multiphysics coupling approach. The electromagnetic field was solved first, and the eddy-current heat generation was transferred to the thermal solver. The thermal solver then updated the temperature field. The updated temperature changed the electrical resistivity, thermal conductivity, specific heat, and magnetic permeability. These changes were fed back into the electromagnetic solver. At the same time, the stress solver calculated thermal stress and transformation stress, and the phase transformation solver tracked austenite, pearlite, ferrite, and martensite fractions. The main assumptions I used were that the density of the helical gear remained constant, that the induction coil and surrounding air remained at a constant temperature, and that the coil was cooled internally so that its own Joule heating did not affect the helical gear surface temperature.
The simulation results showed that the magnetic field was concentrated in the surface layer of the helical gear. The magnetic field intensity was highest near the tooth flank and tooth tip, and it decayed rapidly toward the core. Because I increased the clearance near the tooth tip, the magnetic field intensity at the tooth tip was slightly lower than that at the middle of the tooth flank. This reduced the corner effect and helped avoid premature overheating of the tooth tip of the helical gear.
I extracted magnetic field intensity along three paths on the middle cross section of the helical gear: one path along the tooth profile, one path from the tooth tip toward the core, and one path across the tooth thickness at the pitch circle. The results can be summarized as follows. Along the tooth profile path, the magnetic field intensity increased rapidly from the tooth tip to the flank, reached a maximum near the middle of the flank, and then decreased toward the root. Along the radial path from the tooth tip to the core, the magnetic field intensity decreased approximately exponentially. Along the tooth-thickness path, the field intensity was nearly symmetric about the tooth center, although a small asymmetry appeared because of the helix angle. The effective magnetic penetration depth was about 3 mm for the helical gear under the selected frequency.
| Region of helical gear | Magnetic field behavior | Thermal consequence |
|---|---|---|
| Tooth tip | Moderate field, reduced by increased coil clearance | Lower corner-effect overheating |
| Tooth flank | Highest field intensity near mid-flank | Fast surface heating |
| Tooth root | Local field concentration | Higher root temperature but acceptable |
| Core | Field intensity near zero | Low core temperature, tough core retained |
The temperature field evolved gradually during cyclic scanning. In the first 0.5 s, the temperature increased rapidly because the surface-to-core temperature difference was still small and thermal conduction was limited. After that, the heating rate decreased because heat began to diffuse into the interior of the helical gear. When the surface temperature exceeded about 727 °C, the Curie point of 45 steel, the relative magnetic permeability dropped sharply. This reduced the eddy-current heat generation and further slowed the temperature rise. At the same time, the austenite transformation absorbed latent heat. As a result, the final stage of heating became more gradual and easier to control.
At the end of the moving induction heating stage, the temperature distribution on the helical gear tooth surface was quite uniform. The maximum temperature was about 883.6 °C at the middle of the tooth flank, while the minimum temperature was about 857.3 °C at the tooth root. The maximum temperature difference was only 26.3 °C, corresponding to a relative difference of about 2.98%. This was acceptable for surface quenching because the entire tooth profile fell within the austenitizing temperature range. I also found that the temperature variation along the tooth width direction was small after several cyclic scans. The temperature curves at different positions along the tooth width converged toward the same range, which confirmed that the cyclic scanning method improved temperature uniformity on the helical gear.
| Point on helical gear | Maximum temperature (°C) | Minimum temperature (°C) | Final temperature difference (°C) |
|---|---|---|---|
| Tooth tip | 875.2 | 860.1 | 15.1 |
| Mid-flank | 883.6 | 865.4 | 18.2 |
| Tooth root | 857.3 | 842.0 | 15.3 |
| Overall tooth profile | 883.6 | 857.3 | 26.3 |
The thermal stress during moving induction heating was closely related to the temperature gradient. The highest thermal stress appeared near the transition zone between the heated surface layer and the cooler interior. The tooth root region adjacent to the gear body had relatively high stress because the geometric constraint was strong and the temperature gradient was large. The maximum effective stress during heating was about 270 MPa. As the surface temperature increased and the temperature difference became more stable, the thermal stress gradually decreased. Before austenite formation became dominant, the stress rose quickly because the surface expanded faster than the core. After the surface reached the austenitizing range, transformation plasticity and phase-change volume effects altered the stress state.
After the heating stage, I imported the temperature and phase distribution into the quenching model. I used water as the cooling medium, with a constant temperature of 20 °C and a convective heat transfer coefficient of 6000 W/(m²·K). The cooling time was 20 s. During the first 2 s, the surface temperature of the helical gear dropped rapidly from about 870 °C to below 300 °C. The cooling rate was approximately 200 °C/s. From 2 s to 12 s, the cooling rate decreased to about 20 °C/s. After about 12 s, the surface temperature was below 50 °C. By 20 s, all measured surface points were near 30 °C. This rapid cooling suppressed diffusion-controlled transformation and promoted martensite formation.
| Quenching parameter | Value |
|---|---|
| Cooling medium | Water |
| Medium temperature | 20 °C |
| Convective heat transfer coefficient | 6000 W/(m²·K) |
| Cooling time | 20 s |
| Initial surface temperature | 840-880 °C |
| Final surface temperature | Approximately 30 °C |
The phase transformation results showed that the surface layer of the helical gear was fully austenitized after induction heating. The austenite volume fraction on the tooth surface was 1.0, and the austenite depth was about 3 mm at the tooth tip and about 2 mm on the flank. The core remained mainly pearlite and ferrite, with an austenite volume fraction near zero. After quenching, the surface austenite transformed into martensite. The martensite volume fraction on the tooth surface reached 1.0, and the effective martensite depth was slightly smaller than the austenite depth because the cooling rate in the deeper region was lower. The core remained soft and ductile. The phase distribution in the helical gear was therefore a hard martensitic surface layer over a tough ferrite-pearlite core.
| Phase | Before quenching | After quenching | Depth on tooth flank |
|---|---|---|---|
| Austenite | 1.0 at surface | Residual or transformed | About 2-3 mm |
| Martensite | 0 | 1.0 at surface | About 1.5-2.5 mm |
| Pearlite | Core phase | Core phase | Interior |
| Ferrite | Core phase | Core phase | Interior |
The residual stress after quenching was higher than the thermal stress during heating. The maximum effective residual stress reached about 550 MPa. The highest residual stress was located near the inner core adjacent to the tooth root, where the cooling rate was slower and the temperature difference persisted longer. The tooth surface itself had lower residual stress than the inner transition zone, but it still contained compressive stress components that are beneficial for fatigue resistance. The residual stress distribution followed the same general pattern as the temperature difference during quenching. The tooth root transition region was the most critical zone for cracking, so I monitored it closely in both simulation and experiment.
Hardness was calculated from the volume fractions of the phases. I assigned a hardness of 60 HRC to martensite, 30 HRC to pearlite, and 30 HRC to austenite at room temperature. The hardness of each element was computed as a weighted average:
$$
H = \sum_i \xi_i H_i
$$
where \(H\) is the local hardness, \(\xi_i\) is the volume fraction of phase \(i\), and \(H_i\) is the hardness of phase \(i\). The simulated hardness on the helical gear surface reached 60 HRC where martensite was fully formed. Along the radial direction from the tooth tip toward the core, the hardness remained above 60 HRC for about 2 mm and then dropped rapidly to about 30 HRC in the core. Along the tooth-thickness direction, the hardness was high near both flanks and lower in the middle of the tooth interior. The hardness distribution was consistent with the martensite distribution.
| Location on helical gear | Simulated hardness (HRC) | Martensite fraction |
|---|---|---|
| Tooth tip surface | 60 | 1.0 |
| Mid-flank surface | 60 | 1.0 |
| Tooth root surface | 60 | 1.0 |
| 2 mm below surface | 55-60 | 0.9-1.0 |
| Core | 30 | 0.0 |
I then studied how different process parameters affect the moving induction heating of the helical gear. I used a single-variable approach. The parameters included the axial motion speed, angular speed, current density, current frequency, and cooling medium. The goal was to identify conditions that produce a uniform surface temperature without overheating or underheating the helical gear.
For the motion parameters, I compared three different axial speed programs. In program 1, the entry and exit speeds were 120 mm/s and the middle speed was 200 mm/s. In program 2, the entry and exit speeds were 160 mm/s and the middle speed was 240 mm/s. In program 3, the entry and exit speeds were 200 mm/s and the middle speed was 280 mm/s. I performed 6, 7, and 8 cyclic scans for each program. The results showed that program 1 produced higher temperatures because the helical gear spent more time under the coil, but it also produced larger temperature differences. Program 3 produced lower temperatures and sometimes failed to reach the quenching range. Program 2 gave the best balance. After 7 cycles, the maximum temperature difference along the tooth width was only about 8.5 °C, and all surface points reached the quenching temperature range. I concluded that a helical gear moving too slowly receives excessive heat conduction and nonuniform heating, while a helical gear moving too quickly loses too much heat by convection and may not reach the required temperature.
| Motion program | Entry/exit speed (mm/s) | Middle speed (mm/s) | Best cycle number | Maximum temperature difference (°C) |
|---|---|---|---|---|
| Program 1 | 120 | 200 | 6 | 37.5 |
| Program 2 | 160 | 240 | 7 | 8.5 |
| Program 3 | 200 | 280 | 8 | 20.6 |
For current density, I tested \(4.5 \times 10^7\), \(6.0 \times 10^7\), \(7.5 \times 10^7\), \(9.0 \times 10^7\), and \(10.5 \times 10^7\) A/m². The overall surface temperature increased with current density. However, the maximum temperature difference first decreased and then increased. At a current density of \(7.5 \times 10^7\) A/m², the temperature distribution was the most uniform. At higher current densities, the tooth tip and flank edges overheated, and the temperature difference increased again. I therefore selected \(7.5 \times 10^7\) A/m² as a suitable current density for the helical gear.
| Current density (A/m²) | Average surface temperature (°C) | Maximum temperature difference (°C) | Observation |
|---|---|---|---|
| \(4.5 \times 10^7\) | 850-870 | 28.0 | Slightly low but acceptable |
| \(6.0 \times 10^7\) | 860-880 | 22.0 | Good uniformity |
| \(7.5 \times 10^7\) | 865-885 | 18.2 | Best uniformity |
| \(9.0 \times 10^7\) | 880-910 | 31.0 | Local overheating risk |
| \(10.5 \times 10^7\) | 900-940 | 41.0 | Excessive temperature difference |
For current frequency, I tested 80, 90, 100, 110, and 120 kHz. Increasing frequency decreased the skin depth and concentrated heat closer to the surface. The average surface temperature increased with frequency, but the maximum temperature difference also increased. At 80 kHz, the temperature distribution was the most uniform, although the average temperature was slightly lower. At 120 kHz, the surface heated quickly but the temperature difference became large. I concluded that a lower frequency is preferable when uniform heating of the helical gear is the primary goal, while a higher frequency may be used when a very shallow hardened layer is desired.
| Frequency (kHz) | Skin depth trend | Average surface temperature | Maximum temperature difference |
|---|---|---|---|
| 80 | Largest | Moderate | Smallest |
| 90 | Smaller | Higher | Moderate |
| 100 | Smaller | Higher | Moderate |
| 110 | Small | High | Large |
| 120 | Smallest | Highest | Largest |
I also compared three cooling media: water, oil, and a water-oil mixture. Water produced the fastest cooling rate. The oil-water mixture produced an intermediate cooling rate, and oil produced the slowest cooling rate. The martensite distribution after water quenching was the most uniform. Oil quenching produced a nonuniform martensite distribution and lower surface hardness. The water-oil mixture produced better results than oil but was still less uniform than water. Based on the CCT behavior of 45 steel, a cooling rate above about 200 °C/s is needed to transform austenite fully into martensite, while a cooling rate below about 21 °C/s produces pearlite and ferrite. Water quenching provided the required cooling rate for the helical gear surface.
| Cooling medium | Relative cooling rate | Martensite uniformity | Surface hardness |
|---|---|---|---|
| Water | Fastest | Most uniform | Highest |
| Water-oil mixture | Intermediate | Moderately uniform | Moderate |
| Oil | Slowest | Least uniform | Lowest |
After the numerical study, I validated the process experimentally. I used a high-frequency induction power supply with a maximum power of 60 kW and a frequency range of 40-100 kHz. I manufactured a profiled induction coil by metal 3D printing using a CuCr1Zr copper alloy. The coil width was 10 mm. I built a moving experimental platform with a synchronous belt, pulleys, a rotary motor, a three-jaw chuck, a lead screw slide, a support base, a cooling water tank, a lifting motor, and a machine frame. The helical gear was mounted on a shaft and held by the chuck. The profiled coil was fixed. The helical gear performed the required axial translation and rotation to realize the cyclic scanning motion.
I welded K-type thermocouples to six positions on the helical gear: three along the tooth profile and three along the tooth width. A temperature recorder collected the temperature data during heating and quenching. In the first cycle, a small amount of water vapor appeared because surface moisture evaporated. The surface color changed from bright steel to dark gray. During the second to fifth cycles, no obvious color change occurred. By the sixth cycle, the surface became bright red from the bottom upward. At the end of heating, all measured points reached the quenching temperature range.
The experimental heating curves followed the same overall trend as the simulated curves. The temperature rose quickly in the first 0.5 s, then more slowly, and finally became nearly flat after 2.5 s. The experimental temperatures were slightly lower than the simulated temperatures at the same time. At the end of the same heating time, the simulated temperature was about 43.8 °C higher than the experimental temperature, corresponding to an error of about 5.09%. This difference was caused by heat loss to the environment, slight instability of the power supply, and heat conduction through the thermocouple wires. In the experiment, the maximum temperature along the tooth profile was 879.1 °C at the mid-flank, and the minimum was 841.3 °C at the tooth root. The maximum temperature difference was about 37.8 °C. Along the tooth width, the maximum temperature was 879.6 °C at the middle point and the minimum was 856.3 °C at the end point. The maximum temperature difference was 23.3 °C. These results confirmed that the cyclic scanning moving induction heating method can produce a uniform temperature field on a helical gear.
| Measured point | Experimental maximum temperature (°C) | Simulated maximum temperature (°C) | Difference (°C) |
|---|---|---|---|
| Tooth tip | 868.5 | 875.2 | 6.7 |
| Mid-flank | 879.1 | 883.6 | 4.5 |
| Tooth root | 841.3 | 857.3 | 16.0 |
| Tooth-width middle | 879.6 | 883.6 | 4.0 |
| Tooth-width end | 856.3 | 865.4 | 9.1 |
During quenching, the experimental and simulated cooling curves also agreed well. The temperature dropped rapidly in the first 2 s and then more slowly. The tooth tip and mid-flank cooled faster than the tooth root because they were closer to the cooling water ring. The tooth root cooled more slowly at first, but heat conduction from the hotter interior helped it continue to cool. By 20 s, all measured points were near 30-40 °C. The slight deviation in the tooth root curve was caused by water flow distribution and the distance between the root and the water ring.
I performed metallographic examination after quenching. I cut a 10 mm thick specimen containing a complete tooth from the quenched helical gear. I sampled six regions: the outer and inner sides of the tooth tip, the outer and inner sides of the mid-flank, and the outer and inner sides of the tooth root. I mounted, ground, polished, and etched the specimens with 4% nital. The outer surface regions showed lath martensite and fine carbides. The inner regions showed pearlite and ferrite with no obvious martensite. The mid-flank outer region showed lath martensite that was slightly coarser than the tooth tip outer region. The tooth root outer region showed lath martensite together with some troostite-like constituents. These observations confirmed that the moving induction quenching process produced a martensitic surface layer on the helical gear while leaving the core unhardened.
| Sampling region | Microstructure | Phase interpretation |
|---|---|---|
| Tooth tip outer | Lath martensite + carbides | Fully hardened |
| Tooth tip inner | Pearlite + ferrite | Unhardened core |
| Mid-flank outer | Lath martensite, slightly coarser | Fully hardened |
| Mid-flank inner | Pearlite + ferrite | Unhardened core |
| Tooth root outer | Lath martensite + troostite-like constituent | Hardened with mixed product |
| Tooth root inner | Pearlite + ferrite | Unhardened core |
I measured microhardness using a Vickers hardness tester with a 500 g load and a 10 s dwell time. I converted the Vickers values to Rockwell C hardness. The surface hardness was higher than the simulated value because the actual quenched microstructure contained fine carbides in addition to martensite. The simulated hardness was based on a simple phase-mixture rule, so it gave a maximum of 60 HRC when martensite was fully formed. The experimental hardness reached about 62.5 HRC at the tooth tip and about 62.4 HRC at the mid-flank. The tooth root surface reached about 60.9 HRC. The inner regions remained at about 30-32 HRC. These results showed that the hardened layer on the helical gear satisfied the surface strengthening requirement.
| Region | Average Vickers hardness (HV) | Converted Rockwell C hardness (HRC) | Simulated hardness (HRC) |
|---|---|---|---|
| Tooth tip outer | 760.49 | 62.5 | 60.0 |
| Mid-flank outer | 757.06 | 62.4 | 60.0 |
| Tooth root outer | 716.70 | 60.9 | 60.0 |
| Tooth tip inner | 316.19 | 31.7 | 30.0 |
| Mid-flank inner | 312.04 | 31.2 | 30.0 |
| Tooth root inner | 303.79 | 30.3 | 30.0 |
From the overall study, I concluded that high-frequency moving induction quenching is a feasible and effective method for surface hardening a helical gear. The cyclic scanning motion, combined with a profiled induction coil, allows the helical gear tooth surface to be heated uniformly in both the tooth-profile and tooth-width directions. The moving heating strategy reduces the end-face effect and the corner effect. The process produces a fully austenitized surface layer, which transforms into martensite during water quenching. The resulting hardness is high and relatively uniform, while the core remains tough. The numerical model and experimental results agree well, which supports the use of this method for helical gear surface quenching.
For future work, I would refine the optimization of the process parameters. In this study, I used a single-variable approach and identified suitable ranges for motion speed, current density, and frequency. However, the interactions among these parameters are nonlinear. A multi-objective optimization method could be used to find the best combination for a given helical gear geometry and material. I would also extend the experimental study to include oil quenching and water-oil mixture quenching to compare cracking susceptibility and distortion. In addition, I would measure residual stress directly by X-ray diffraction or hole drilling and compare it with the simulated residual stress field. Finally, I would apply the same moving induction quenching framework to helical gears with different modules, helix angles, and tooth widths so that the method can be generalized for industrial production.
The main equations and process relations used in my study can be summarized as follows. The electromagnetic heat source is:
$$
q_v = \rho J^2
$$
The heat conduction equation is:
$$
\rho c \frac{\partial T}{\partial t} =
\nabla \cdot (k \nabla T) + q_v
$$
The skin depth is:
$$
\delta = \sqrt{\frac{\rho}{\pi f \mu}}
$$
The kinematic relation for the helical gear is:
$$
v_t = \omega_t r \tan\beta
$$
The Avrami transformation equation is:
$$
\xi = 1 – \exp\left[-b(T)t^{n(T)}\right]
$$
The Koistinen-Marburger martensite equation is:
$$
\xi_m = \xi_a \left[1 – \exp\left(-\Omega(T_{MS} – T)\right)\right]
$$
The hardness mixture rule is:
$$
H = \sum_i \xi_i H_i
$$
These relations formed the basis of my coupled numerical model and helped explain the measured temperature, microstructure, and hardness results for the helical gear. The use of a profiled induction coil and cyclic scanning motion was essential for uniform heating of the helical gear. The water-quenching step produced a hard martensitic surface layer with a depth of about 2 mm and a core hardness of about 30 HRC. The surface hardness reached about 60-62 HRC. The experimental results matched the simulation trends and confirmed that the proposed moving induction quenching process is suitable for surface strengthening of a helical gear.