
I investigated a severe fracture incident involving screw gears in a worm transmission used in an industrial reducer. The screw gears were part of a worm-drive system that had experienced repeated engagement and disengagement under high load. After approximately 55 operating cycles, several teeth of the worm-wheel screw gear broke away from the root region, and the adjacent teeth exhibited plastic deformation. Because the failure occurred after a relatively small number of cycles, I focused my study on low-cycle fatigue rather than on classical high-cycle fatigue. I combined experimental failure analysis with three-dimensional finite element analysis and fatigue-life prediction to identify the dominant mechanisms that caused the screw gears to fail. The central question I addressed was whether the initial crack observed at the tooth root of the screw gears could explain the transition from a high-cycle fatigue prediction to an actual low-cycle fatigue failure.
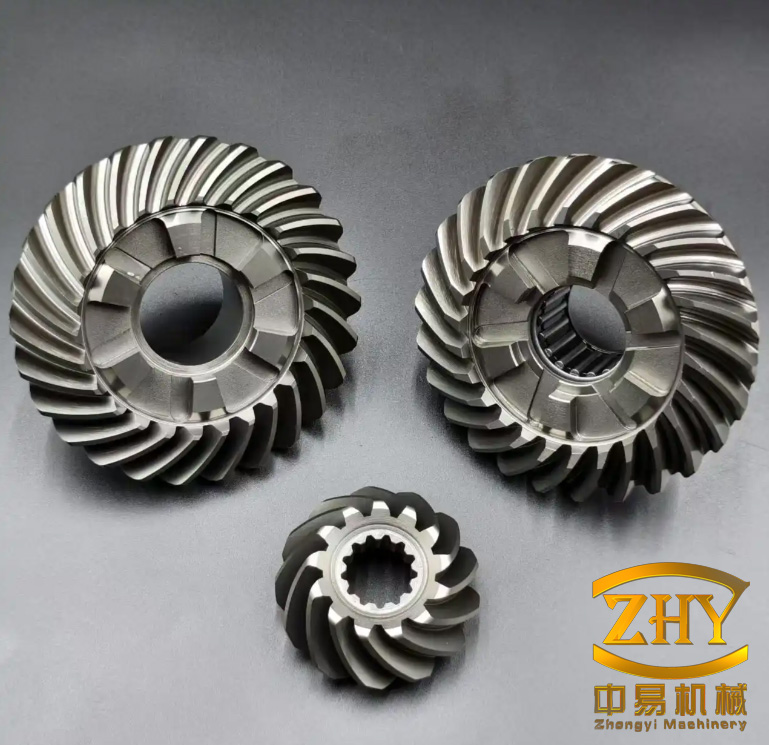
Worm transmissions are widely used in reducers, lifting equipment, machine tools, and power stations because screw gears provide large single-stage transmission ratios, compact structure, smooth meshing, and self-locking capability. In a typical worm drive, the worm is the driving screw gear, and the worm wheel is the driven screw gear. The tooth surfaces of these screw gears are complex spatial surfaces. The contact line moves continuously during meshing, and the relative motion contains both rolling and sliding. Because the worm is usually made of hard steel and the worm wheel is made of softer bronze, the screw gears in the worm wheel are more likely to suffer wear, plastic deformation, crack initiation, and fatigue fracture. In my case, the failed screw gears were made of tin bronze, and the worm was made of alloy steel. The hardness difference between the two screw gears was large, which promoted plastic deformation and crack initiation in the softer screw gears.
I structured my investigation around three tasks. First, I performed a failure analysis of the broken screw gears, including macroscopic fracture observation, chemical composition analysis, metallographic examination, hardness testing, and scanning electron microscopy. Second, I established three-dimensional solid models of the worm and the worm-wheel screw gears and imported them into a finite element environment to simulate the dynamic contact of the worm drive. Third, I used the computed stress and load spectra to predict the fatigue life of the screw gears and to study the influence of torque, rotational speed, tooth width, module, and initial crack size. I also derived the transition fatigue life of the screw gear material to determine whether the failure was low-cycle or high-cycle fatigue.
The chemical composition of the failed screw gears is summarized in Table 1. The measured tin content was high, and zinc, iron, aluminum, nickel, manganese, and antimony were also present. By comparing the measured values with the standard range for cast tin bronze, I identified the material as a 10-2 tin bronze, corresponding to ZCuZn10Sn2. This identification was consistent with the metallographic observations and with the mechanical properties measured from the failed screw gears.
| Element | Sn | Zn | Fe | Al | Ni | Mn | Sb |
|---|---|---|---|---|---|---|---|
| Measured screw gear | 10.098 | 1.252 | 0.043 | 0.005 | 0.360 | 0.012 | 0.048 |
| Standard ZCuSn10Zn2 | 2.0–11.0 | 1.0–3.0 | ≤0.5 | ≤0.02 | ≤2.5 | ≤0.2 | ≤0.3 |
I examined the fracture surface of the screw gears at both macroscopic and microscopic scales. The fracture was concentrated in one sector of the worm wheel. I counted twelve broken teeth in that sector. The tooth ends showed clear plastic deformation, and the middle teeth were severely damaged. The first broken tooth was located at the left side of the failure zone. As the worm continued to rotate, the middle teeth were subjected to repeated impact and eventually fractured. The tooth on the right side of the failure zone also showed slight deformation, which indicated that it had experienced a large impact but had not yet fractured. This damage sequence suggested that the screw gears failed progressively rather than instantaneously.
I measured the Brinell hardness of the failed screw gears and the mating worm. The results are given in Table 2. The average hardness of the failed screw gear was 75.5 HBW, which is below the minimum requirement of 80 HBW for ZCuSn10Zn2. The average hardness of the worm was 176.3 HBW. Therefore, the hardness of the worm was more than twice that of the worm-wheel screw gears. This large hardness mismatch increased the contact stress on the softer screw gears and made them more susceptible to plastic deformation and crack initiation.
| Specimen | Hardness values / HBW | Average / HBW |
|---|---|---|
| Failed screw gear tooth surface | 75.1, 75.9, 75.5 | 75.5 |
| Worm helical surface | 175.9, 177.2, 175.8 | 176.3 |
Metallographic analysis showed that the failed screw gears consisted of a white alpha solid solution matrix with gray-black tin-rich alpha solid solution at the dendrite boundaries. A gray lamellar eutectoid of (α + δ) was also present. In a sound tin bronze, the (α + δ) eutectoid should be distributed uniformly and in appropriate amounts. In the failed screw gears, however, the eutectoid was uneven in size and distribution. This microstructural inhomogeneity reduced the hardness of the screw gears and likely contributed to the early formation of fatigue cracks. The scanning electron microscopy images revealed a distinct crack at the tooth root of the failed screw gear. The crack was approximately 4×10⁻⁴ m in length. The presence of this initial crack was critical because it changed the fatigue behavior of the screw gears from crack initiation to crack propagation. In other words, the screw gears were already damaged before the final fracture.
I established a three-dimensional model of the worm and the worm-wheel screw gears using a parametric CAD environment. For the worm, I used the axial tooth profile of an Archimedes worm. The main geometric parameters are listed in Table 3. The module was 2.37 mm, the number of starts was one, the pressure angle was 20°, and the reference diameter was 30.4 mm. The addendum, working tooth height, axial pitch, clearance, and root fillet radius were also specified. I generated the helical tooth surface by sweeping the axial profile along a helical path. The worm body was then created by adding a cylinder of root diameter. This produced a solid model of the worm screw gear.
| Parameter | Unit | Value |
|---|---|---|
| Module | mm | 2.37 |
| Number of starts | — | 1 |
| Pressure angle | ° | 20 |
| Reference diameter | mm | 30.4 |
| Addendum | mm | 2.37 |
| Working tooth height | mm | 4.74 |
| Axial pitch | mm | 7.442 |
| Clearance | mm | 0.474 |
| Root fillet radius | mm | 0.711 |
For the worm-wheel screw gears, I used a bicubic B-spline surface to describe the tooth flank. The tooth surface equations for the worm wheel were derived from the meshing relationship between the worm coordinate system and the worm-wheel coordinate system. The trajectory of two key points on the hob tip was described by the following equations:
$$x_2 = (A_0 – R_1 \cos\varphi_1)\cos(\varphi_2 \pm \Delta\varphi_2)$$
$$y_2 = (A_0 – R_1 \cos\varphi_1)\sin(\varphi_2 \pm \Delta\varphi_2)$$
$$z_2 = R_1 \sin\varphi_1$$
$$\varphi_2 = \frac{\varphi_1}{i_{12}}$$
$$\Delta\varphi_2 = \frac{|k_1k_2|}{2\pi i_{12}}$$
Here, \(A_0\) is the center distance, \(R_1\) is the tip radius of the worm hob, \(\varphi_1\) is the rotation angle of the hob, \(\varphi_2\) is the rotation angle of the worm wheel, and \(i_{12}\) is the transmission ratio. Using these equations, I generated the trajectory points and constructed the transition surface between adjacent teeth. I then created a solid worm-wheel blank and performed a Boolean subtraction of the tooth grooves. The resulting three-dimensional model of the worm-wheel screw gears was assembled with the worm model at the correct center distance and pressure angle. This assembly formed the basis for the dynamic finite element simulation.
I imported the assembled screw gears into a finite element environment and simplified the model by retaining only the teeth that participated in meshing. This reduced the number of elements and nodes while preserving the contact behavior. The material parameters for the worm and the worm-wheel screw gears are listed in Table 4. The worm-wheel screw gears had an elastic modulus of 103 GPa, a density of 8820 kg/m³, a Poisson’s ratio of 0.34, a yield strength of 284 MPa, and a tangent modulus of 1102 MPa. The worm had an elastic modulus of 200 GPa, a density of 7850 kg/m³, a Poisson’s ratio of 0.30, a yield strength of 550 MPa, and a tangent modulus of 1450 MPa. The elastic modulus of the worm was 94.2% higher than that of the worm-wheel screw gears, which meant that the worm-wheel screw gears were much more compliant and more likely to deform under load. The yield strength of the worm was also much higher, so plastic deformation was expected to occur first in the worm-wheel screw gears.
| Parameter | Worm-wheel screw gears | Worm |
|---|---|---|
| Elastic modulus / GPa | 103 | 200 |
| Density / kg·m-3 | 8820 | 7850 |
| Poisson’s ratio | 0.34 | 0.30 |
| Yield strength / MPa | 284 | 550 |
| Tangent modulus / MPa | 1102 | 1450 |
I defined the contact pair between the worm and the worm-wheel screw gears. The worm helical surface was set as the target surface, and three meshing teeth of the worm-wheel screw gears were set as the contact surfaces. I used a frictional contact formulation with a friction coefficient of 0.1 and an augmented Lagrange contact algorithm. The geometric correction was set to add offset with no ramping. I used tetrahedral elements for the worm-wheel screw gears and hexahedral elements for the worm. The global element size was 2 mm, and the contact surfaces were refined to 0.5 mm. The transition was set to slow to maintain good element quality near the contact region. The final mesh contained 139,286 elements and 211,010 nodes. This mesh density provided sufficient resolution for the contact stress while keeping the computational cost within a practical range.
I applied boundary conditions and loads to reproduce the actual operating condition. The worm was connected to ground through a revolute joint and was driven at 1790 rpm. The worm-wheel screw gears were connected to ground through a revolute joint and were subjected to a constant torque of 572 N·m. I divided the simulation into three load steps. The first load step had an end time of \(1 \times 10^{-5}\) s, with an initial substep count of 5 and a substep range of 1 to 10. Its purpose was to establish stable contact between the screw gears. The second load step had an end time of \(1 \times 10^{-4}\) s, with an initial substep count of 20 and a substep range of 10 to 100. Its purpose was to transition from contact establishment to actual tooth engagement. The third load step had an end time of 0.123 s, with an initial substep count of 2000 and a substep range of 1000 to 10000. Its purpose was to simulate the dynamic meshing of the screw gears over several teeth. The load step settings are summarized in Table 5.
| Load step | End time / s | Initial substeps | Substep range | Purpose |
|---|---|---|---|---|
| Step 1 | 1×10⁻⁵ | 5 | 1–10 | Establish contact |
| Step 2 | 1×10⁻⁴ | 20 | 10–100 | Transition to engagement |
| Step 3 | 0.123 | 2000 | 1000–10000 | Dynamic meshing |
The transient dynamic analysis produced the equivalent stress distribution in the worm-wheel screw gears. The left tooth experienced the highest contact stress during the initial meshing stage. The maximum contact stress reached 308 MPa. The allowable contact stress of the tin bronze screw gears was 220 MPa, so the computed stress was 40% higher than the allowable value. The middle tooth reached a maximum contact stress of 292 MPa, which was 5.5% lower than that of the left tooth. The right tooth reached 283 MPa, which was 8.8% lower than that of the left tooth. The left tooth was therefore the most critical screw gear tooth. This result agreed with the fracture sequence observed in the failed screw gears, where the left tooth broke first and the middle teeth were subsequently damaged. The high contact stress was caused by the large hardness difference between the worm and the worm-wheel screw gears, as well as by the impact load during the initial meshing stage.
The contact stress varied periodically during meshing. The stress history showed three peaks corresponding to the single-tooth meshing regions. In the single-tooth meshing region, the average contact stress was about 294 MPa, and all three peaks exceeded the allowable contact stress of the material. In the double-tooth meshing region, the average contact stress dropped to about 97 MPa. The contact stress fluctuated around 200 MPa. These features indicated that the screw gears were subjected to alternating stress during operation. The maximum stress occurred at the tooth tip and at the root transition fillet. The root region on the meshing side experienced tensile stress, while the non-meshing side experienced compressive stress. Because the worm rotated continuously, the root of the worm-wheel screw gears was subjected to cyclic tensile and compressive loading. This cyclic loading, combined with the initial crack observed in the scanning electron microscopy analysis, provided the driving force for crack propagation and final fracture.
I also analyzed the contact status during meshing. The contact between the worm and the worm-wheel screw gears alternated between single-tooth contact and double-tooth contact. In the single-tooth contact region, the contact line length was about two-thirds of the face width. In the double-tooth contact region, the contact line length decreased. The contact status was predominantly sliding, and no sticking was observed. This confirmed that the screw gears operated under sliding-dominant contact, which explains the severe wear and plastic deformation observed on the failed teeth. The contact analysis also showed that the tooth tip was always the first region to contact the worm. This matched the macroscopic observation that the tooth tips were plastically deformed and that the fracture initiated near the root on the meshing side.
I extracted the reaction force on the contact surface of the worm-wheel screw gears to construct a load spectrum. The load spectrum is an essential input for fatigue life prediction because it reflects the actual dynamic loading rather than a simplified constant load. In the single-tooth meshing region, the average reaction force was 5872 N, the maximum was 6752 N, and the minimum was 4991 N. The load fluctuation was 15.99%. In the double-tooth meshing region, the average reaction force was 4085 N, the maximum was 4956 N, and the minimum was 3214 N. The load fluctuation was 21.32%. The overall load spectrum exhibited variable-amplitude characteristics, which are typical of worm drives. I used this load spectrum in the subsequent fatigue analysis.
I studied the influence of torque on the contact stress of the screw gears. I kept the worm speed constant and applied eight different torque values to the worm-wheel screw gears. The results are listed in Table 6. As the torque increased, the maximum contact stress increased significantly. At the maximum torque of 572 N·m, the maximum contact stress reached 308 MPa. At the minimum torque of 171.6 N·m, the maximum contact stress was 190 MPa, which was 13.6% below the allowable contact stress. When the torque was reduced by 57.2 N·m, the contact stress decreased by about 5.5%. The contact stress fell below the allowable value when the torque was lower than about 266 N·m. This torque was 53.5% lower than the actual operating torque. Therefore, reducing the torque can effectively lower the contact stress, but it may also reduce the transmission performance of the reducer. In practice, the torque should be selected according to the power requirement and the allowable stress of the screw gears.
| Torque / N·m | 572 | 514.8 | 457.6 | 400.4 | 343.2 | 286 | 228.8 | 171.6 |
|---|---|---|---|---|---|---|---|---|
| Maximum contact stress / MPa | 308 | 302 | 295 | 265 | 241 | 222 | 208 | 190 |
I also studied the influence of rotational speed on the contact stress of the screw gears. I kept the torque constant and applied eight different worm speeds. The results are listed in Table 7. As the worm speed increased, the contact stress increased. At the maximum speed of 1470 rpm, the maximum contact stress was 308 MPa. At the minimum speed of 441 rpm, the maximum contact stress was 201 MPa, which was 8.6% below the allowable contact stress. When the speed was reduced by 147 rpm, the contact stress decreased by about 5%. The contact stress fell below the allowable value when the speed was lower than about 552 rpm. This speed was 62.4% lower than the actual operating speed. Therefore, reducing the worm speed can also lower the contact stress, but it may reduce the transmission capacity. The results indicate that both torque and speed must be considered together when designing a worm drive with screw gears.
| Worm speed / rpm | 1470 | 1323 | 1176 | 1029 | 882 | 735 | 588 | 441 |
|---|---|---|---|---|---|---|---|---|
| Maximum contact stress / MPa | 308 | 298 | 287 | 272 | 251 | 231 | 211 | 201 |
I investigated the effect of tooth width on the contact stress of the screw gears. I varied the tooth width from 20 mm to 6 mm while keeping all other parameters constant. The results are listed in Table 8. As the tooth width increased, the contact stress increased slightly. At a tooth width of 20 mm, the maximum contact stress was 308 MPa. At a tooth width of 6 mm, the maximum contact stress was 274 MPa, which was still 24.5% above the allowable contact stress. When the tooth width was reduced by 2 mm, the contact stress decreased by about 1.6%. The effect of tooth width was therefore relatively small compared with the effects of torque and speed. However, reducing the tooth width can shorten the contact line and reduce the meshing impact. In practical design, the tooth width should be selected as small as possible while still satisfying the load-carrying capacity and manufacturing requirements.
| Tooth width / mm | 20 | 18 | 16 | 14 | 12 | 10 | 8 | 6 |
|---|---|---|---|---|---|---|---|---|
| Maximum contact stress / MPa | 308 | 303 | 299 | 293 | 289 | 284 | 278 | 274 |
I also varied the module of the worm-wheel screw gears. The module is a fundamental parameter that determines the tooth size. When the number of teeth is fixed, a larger module produces a larger tooth and a larger radial dimension. I varied the module from 2.37 mm to 3.77 mm. The results are listed in Table 9. As the module increased, the contact stress decreased significantly. At the smallest module of 2.37 mm, the maximum contact stress was 308 MPa. At the largest module of 3.77 mm, the maximum contact stress was 147 MPa, which was 33.2% below the allowable contact stress. When the module was increased by 0.2 mm, the contact stress decreased by about 7.5%. The contact stress fell below the allowable value when the module was greater than about 3.14 mm. Therefore, increasing the module is an effective way to reduce the contact stress of the screw gears. However, a larger module also increases the size and weight of the reducer, so a compromise must be made.
| Module / mm | 2.37 | 2.57 | 2.77 | 2.97 | 3.17 | 3.37 | 3.57 | 3.77 |
|---|---|---|---|---|---|---|---|---|
| Maximum contact stress / MPa | 308 | 288 | 260 | 237 | 217 | 191 | 173 | 147 |
Because the failed screw gears contained an initial crack at the tooth root, I established a three-dimensional semi-elliptical crack model. The crack was inserted into the root of the worm-wheel screw gears. The crack shape was defined by a major radius and a minor radius. The major radius represented the crack width along the root direction, and the minor radius represented the crack depth along the radial direction. I divided the crack front into 15 segments and generated six contour rings around the crack front. The crack tip mesh was refined automatically. This model allowed me to compute the stress intensity factors for three crack opening modes: Mode I, Mode II, and Mode III. Mode I is the opening mode, Mode II is the in-plane sliding mode, and Mode III is the out-of-plane tearing mode. In the root crack of the screw gears, the stress intensity factor for Mode I was much larger than those for Mode II and Mode III. Therefore, Mode I was the dominant crack propagation mode.
The stress intensity factors were computed along the crack front. For a crack width of 0.4 mm and a crack depth of 0.3 mm, the maximum Mode I stress intensity factor was 56.151 MPa·mm0.5, and the minimum was 40.92 MPa·mm0.5. The maximum occurred at the two ends of the crack front, and the minimum occurred at the middle of the crack front. The distribution curve was concave, meaning that the stress intensity factor first decreased and then increased along the crack front. The maximum Mode II stress intensity factor was 32.597 MPa·mm0.5, and the minimum was -9.235 MPa·mm0.5. The distribution was convex. The maximum Mode III stress intensity factor was 18.311 MPa·mm0.5, and the minimum was -20.976 MPa·mm0.5. The distribution was nearly linear. The relative magnitudes of the three modes are summarized in Table 10. Because Mode I was dominant, I focused on the Mode I stress intensity factor in the subsequent crack growth analysis.
| Crack mode | Maximum / MPa·mm0.5 | Minimum / MPa·mm0.5 | Distribution shape |
|---|---|---|---|
| Mode I | 56.151 | 40.92 | Concave |
| Mode II | 32.597 | -9.235 | Convex |
| Mode III | 18.311 | -20.976 | Linear |
I then studied the influence of crack width on the Mode I stress intensity factor. I kept the crack depth at 0.3 mm and varied the crack width from 0.15 mm to 0.40 mm. The results are listed in Table 11. As the crack width increased, the stress intensity factor curve shifted upward. When the crack width was between 0.15 mm and 0.40 mm, the stress intensity factor distribution along the normalized crack front was lower in the middle and higher at the two ends. As the crack width increased from 0.15 mm to 0.40 mm, the stress intensity factor at the middle of the crack front increased from 22.146 MPa·mm0.5 to 40.92 MPa·mm0.5. The stress intensity factor at the two ends increased from 51.348 MPa·mm0.5 to 56.151 MPa·mm0.5. The growth rate in the crack width direction was therefore much higher than that in the crack depth direction. This indicated that the crack in the screw gears preferred to propagate along the root direction rather than into the depth. This behavior is consistent with the fracture pattern observed in many gear and screw gear failures.
| Crack width / mm | 0.15 | 0.20 | 0.25 | 0.30 | 0.35 | 0.40 |
|---|---|---|---|---|---|---|
| Middle KI / MPa·mm0.5 | 22.146 | 26.318 | 31.105 | 35.772 | 38.604 | 40.92 |
| End KI / MPa·mm0.5 | 51.348 | 52.221 | 53.410 | 54.603 | 55.422 | 56.151 |
I also studied the influence of crack depth on the Mode I stress intensity factor. I kept the crack width at 0.40 mm and varied the crack depth from 0.05 mm to 0.30 mm. The results are listed in Table 12. When the crack depth was between 0.05 mm and 0.15 mm, the stress intensity factor distribution was convex, meaning that the middle of the crack front had a higher value than the ends. As the crack depth increased, the stress intensity factor at the middle increased gradually, while the stress intensity factor at the ends increased more rapidly. When the crack depth was between 0.20 mm and 0.30 mm, the distribution became concave, meaning that the ends had higher values than the middle. The transition from convex to concave indicates that the crack growth mechanism changed as the crack deepened. Initially, the crack grew more quickly in the depth direction. After the crack reached a certain depth, the growth in the width direction became dominant. This transition is important because it affects the remaining fatigue life of the screw gears.
| Crack depth / mm | 0.05 | 0.10 | 0.15 | 0.20 | 0.25 | 0.30 |
|---|---|---|---|---|---|---|
| Middle KI / MPa·mm0.5 | 48.831 | 50.014 | 51.902 | 45.962 | 43.441 | 40.92 |
| End KI / MPa·mm0.5 | 8.484 | 18.112 | 38.318 | 48.712 | 52.603 | 56.151 |
I used a strain-based fatigue analysis approach to predict the life of the screw gears. The total strain amplitude is the sum of the elastic strain amplitude and the plastic strain amplitude. The relationship between total strain amplitude and fatigue life is given by the Coffin–Manson–Basquin equation:
$$\frac{\Delta\varepsilon_t}{2} = \frac{\Delta\varepsilon_e}{2} + \frac{\Delta\varepsilon_p}{2} = \frac{\sigma_f’}{E}(2N_f)^b + \varepsilon_f'(2N_f)^c$$
The elastic strain amplitude and plastic strain amplitude are given by:
$$\frac{\Delta\varepsilon_e}{2} = \frac{\sigma_f’}{E}(2N_f)^b$$
$$\frac{\Delta\varepsilon_p}{2} = \varepsilon_f'(2N_f)^c$$
The cyclic stress–strain relationship follows the Ramberg–Osgood equation:
$$\frac{\Delta\sigma}{2} = K’ \left(\frac{\Delta\varepsilon_p}{2}\right)^{n’}$$
Here, \(E\) is the elastic modulus, \(\sigma_f’\) is the fatigue strength coefficient, \(b\) is the fatigue strength exponent, \(\varepsilon_f’\) is the fatigue ductility coefficient, \(c\) is the fatigue ductility exponent, \(K’\) is the cyclic strength coefficient, and \(n’\) is the cyclic strain hardening exponent. I applied different torque values to the screw gears and recorded the total, elastic, and plastic strain amplitudes together with the number of reversals to failure. The data are listed in Table 13. As the strain amplitudes decreased, the number of reversals to failure increased. The total strain amplitude decreased from 1.53% to 0.34%, and the number of reversals to failure increased from 162 to 11,300. The plastic strain amplitude curve and the elastic strain amplitude curve intersected between 2172 and 5051 reversals. This intersection defines the transition fatigue life of the screw gears.
| Number of reversals to failure, \(2N_f\) | Total strain amplitude, \(\Delta\varepsilon_t/2\) | Elastic strain amplitude, \(\Delta\varepsilon_e/2\) | Plastic strain amplitude, \(\Delta\varepsilon_p/2\) |
|---|---|---|---|
| 162 | 0.01538 | 0.00456 | 0.01082 |
| 349 | 0.01115 | 0.00390 | 0.00723 |
| 2172 | 0.00571 | 0.00290 | 0.00321 |
| 5051 | 0.00445 | 0.00249 | 0.00206 |
| 7210 | 0.00395 | 0.00234 | 0.00165 |
| 11300 | 0.00341 | 0.00215 | 0.00135 |
I fitted the strain–life data to obtain the fatigue parameters of the screw gear material. The fitted parameters are listed in Table 14. The cyclic strength coefficient was 571.980, the cyclic strain hardening exponent was 0.361, the fatigue strength coefficient divided by the elastic modulus was 0.011, the fatigue strength exponent was -0.174, the fatigue ductility coefficient was 0.125, and the fatigue ductility exponent was -0.482. These parameters allowed me to construct the complete strain–life curve for the screw gears. The curve showed that plastic strain dominated at short lives, while elastic strain dominated at long lives. The transition fatigue life was determined by equating the elastic and plastic strain amplitude equations:
$$(2N_f)_t = \left(\frac{\varepsilon_f’ E}{\sigma_f’}\right)^{1/(b-c)}$$
Substituting the fitted parameters into the equation gave a transition fatigue life of 2673 reversals. This value is the boundary between low-cycle fatigue and high-cycle fatigue for the screw gears. The actual failure occurred after about 55 cycles, which is well below 2673 reversals. Therefore, the failure of the screw gears was a low-cycle fatigue failure. The finite element prediction without an initial crack gave 3513 reversals, which is above the transition life and would be classified as high-cycle fatigue. The discrepancy between the predicted and actual lives confirmed that the initial crack played a decisive role in the failure.
| Parameter | Value |
|---|---|
| Cyclic strength coefficient, \(K’\) | 571.980 |
| Cyclic strain hardening exponent, \(n’\) | 0.361 |
| \(\sigma_f’/E\) | 0.011 |
| Fatigue strength exponent, \(b\) | -0.174 |
| Fatigue ductility coefficient, \(\varepsilon_f’\) | 0.125 |
| Fatigue ductility exponent, \(c\) | -0.482 |
| Transition fatigue life, \((2N_f)_t\) | 2673 |
I then used a fatigue-life analysis platform to predict the life of the screw gears under different conditions. The stress results from the finite element analysis and the load spectrum were imported into the fatigue solver. The material strain–life curve was used to estimate the damage. The predicted fatigue life of the screw gears without an initial crack was 3513 cycles. The shortest life occurred at the tooth tip on the left tooth, which was the region of maximum contact stress. The middle tooth had a life of 3794 cycles, and the right tooth had a life of 3892 cycles. The left tooth life was 7.4% shorter than the middle tooth life and 9.7% shorter than the right tooth life. This result matched the observed fracture sequence and the stress analysis. However, the predicted life of 3513 cycles was much longer than the actual failure life of about 55 cycles. This indicated that the initial crack and the subsequent crack propagation dominated the failure.
I studied the effect of torque on the fatigue life of the screw gears. The results are listed in Table 15. As the torque increased, the fatigue life decreased significantly. At the maximum torque of 572 N·m, the fatigue life was 3513 cycles. This was 31.4% higher than the transition life of 2673 cycles, so it was classified as high-cycle fatigue. However, it was still 64.9% below the desired 10,000 cycles. At the minimum torque of 171.6 N·m, the fatigue life increased to 11,054 cycles, which was 10.5% above the desired life. The fatigue life increased by about 30.7% for every 57.2 N·m reduction in torque. The fatigue life exceeded 10,000 cycles when the torque was below about 229 N·m. This torque was 60% lower than the actual operating torque. Therefore, reducing the torque can significantly extend the life of the screw gears, but it may reduce the transmission capacity.
| Torque / N·m | 572 | 514.8 | 457.6 | 400.4 | 343.2 | 286 | 228.8 | 171.6 |
|---|---|---|---|---|---|---|---|---|
| Fatigue life / cycles | 3513 | 4681 | 5714 | 6641 | 7715 | 8924 | 10157 | 11054 |
I also studied the effect of rotational speed on the fatigue life of the screw gears. The results are listed in Table 16. As the worm speed increased, the fatigue life decreased. At the maximum speed of 1470 rpm, the fatigue life was 3513 cycles. At the minimum speed of 441 rpm, the fatigue life increased to 10,876 cycles, which was 8.8% above the desired life. The fatigue life increased by about 30% for every 147 rpm reduction in speed. The fatigue life exceeded 10,000 cycles when the speed was below about 602 rpm. This speed was 59% lower than the actual operating speed. Therefore, reducing the worm speed can also significantly extend the life of the screw gears. However, high speed combined with high torque produces a large impact at the initial meshing stage, which can cause an initial crack and lead to rapid fatigue failure. In such cases, the screw gears should be inspected regularly to detect cracks before they propagate to a critical size.
| Worm speed / rpm | 1470 | 1323 | 1176 | 1029 | 882 | 735 | 588 | 441 |
|---|---|---|---|---|---|---|---|---|
| Fatigue life / cycles | 3513 | 4913 | 6121 | 7215 | 8210 | 9143 | 10021 | 10876 |
I investigated the effect of tooth width on the fatigue life of the screw gears. The results are listed in Table 17. As the tooth width increased, the fatigue life decreased. At the maximum tooth width of 20 mm, the fatigue life was 3513 cycles. At the minimum tooth width of 6 mm, the fatigue life increased to 6492 cycles, which was still 35.1% below the desired life. The fatigue life increased by about 12.1% for every 2 mm reduction in tooth width. The effect of tooth width on fatigue life was smaller than the effects of torque and speed. However, a smaller tooth width reduces the contact line length and the meshing impact, which can improve the fatigue life to some extent. In practical design, the tooth width should be minimized within the limits of load-carrying capacity and manufacturing constraints.
| Tooth width / mm | 20 | 18 | 16 | 14 | 12 | 10 | 8 | 6 |
|---|---|---|---|---|---|---|---|---|
| Fatigue life / cycles | 3513 | 3962 | 4359 | 4701 | 5114 | 5513 | 6001 | 6492 |
I also studied the effect of module on the fatigue life of the screw gears. The results are listed in Table 18. As the module increased, the fatigue life increased significantly. At the smallest module of 2.37 mm, the fatigue life was 3513 cycles. At the largest module of 3.77 mm, the fatigue life increased to 15,646 cycles, which was 56.5% above the desired life. The fatigue life increased by about 49.3% for every 0.2 mm increase in module. The fatigue life exceeded 10,000 cycles when the module was greater than about 3.13 mm. This module was 32.1% larger than the actual module. Therefore, increasing the module is a very effective way to extend the life of the screw gears. A larger module increases the tooth size and the load-carrying capacity, but it also increases the size and weight of the reducer. A balance must be achieved between fatigue life and compactness.
| Module / mm | 2.37 | 2.57 | 2.77 | 2.97 | 3.17 | 3.37 | 3.57 | 3.77 |
|---|---|---|---|---|---|---|---|---|
| Fatigue life / cycles | 3513 | 5301 | 7096 | 8501 | 10519 | 12251 | 13754 | 15646 |
Finally, I studied the effect of initial crack size on the fatigue life of the screw gears. I inserted semi-elliptical cracks with different widths and depths at the tooth root. The results are listed in Table 19. When the crack depth was constant, increasing the crack width caused a rapid decrease in fatigue life. For a crack depth of 0.05 mm, the fatigue life decreased by about 15.4% for every 0.05 mm increase in crack width. For a crack depth of 0.30 mm, the fatigue life decreased by about 18.9% for every 0.05 mm increase in crack width. When the crack width was constant, increasing the crack depth also decreased the fatigue life, but the rate of decrease was much slower. For a crack width of 0.15 mm, the fatigue life decreased by about 4.7% for every 0.05 mm increase in crack depth. For a crack width of 0.40 mm, the fatigue life decreased by about 5.1% for every 0.05 mm increase in crack depth. Therefore, crack growth in the width direction has a much greater influence on the fatigue life of the screw gears than crack growth in the depth direction. This is consistent with the stress intensity factor results, which showed that Mode I stress intensity factors were higher at the crack front ends and that the crack preferred to propagate along the root direction.
| Crack depth / mm | Crack width 0.05 mm | Crack width 0.10 mm | Crack width 0.15 mm | Crack width 0.20 mm | Crack width 0.25 mm | Crack width 0.30 mm |
|---|---|---|---|---|---|---|
| 0.15 | 1214 | 1159 | 1101 | 1034 | 981 | 931 |
| 0.20 | 1001 | 952 | 901 | 847 | 781 | 719 |
| 0.25 | 874 | 811 | 749 | 672 | 617 | 563 |
| 0.30 | 661 | 606 | 542 | 471 | 427 | 371 |
| 0.35 | 479 | 412 | 354 | 299 | 255 | 212 |
| 0.40 | 281 | 229 | 172 | 125 | 87 | 49 |
When the crack width was 0.40 mm and the crack depth was 0.30 mm, the predicted fatigue life was 49 cycles. The actual failure life was about 55 cycles. The error between the prediction and the actual failure was 10.9%. This close agreement confirmed that the initial crack at the tooth root was the primary cause of the low-cycle fatigue failure of the screw gears. When the crack width was 0.15 mm and the crack depth was 0.05 mm, the predicted fatigue life was 1213 cycles. All predicted lives in the studied crack size range were below the transition fatigue life of 2673 cycles. Therefore, the presence of an initial crack always changed the failure mode of the screw gears from high-cycle fatigue to low-cycle fatigue. The crack size in the width direction had a stronger effect on fatigue life than the crack size in the depth direction. This means that inspection and maintenance should focus on detecting root cracks that are extending along the face width of the screw gears.
In summary, I found that the failure of the screw gears in the worm transmission was a low-cycle fatigue failure driven by a combination of high contact stress, large hardness mismatch, and an initial root crack. The contact stress in the screw gears reached 308 MPa, which was 40% above the allowable contact stress of the tin bronze material. The hardness of the worm was more than twice that of the worm-wheel screw gears, which promoted plastic deformation and crack initiation. The initial crack observed at the tooth root was approximately \(4 \times 10^{-4}\) m long. The stress intensity factor analysis showed that Mode I was the dominant crack opening mode and that the crack propagated preferentially along the width direction of the screw gear tooth. The strain-life analysis gave a transition fatigue life of 2673 reversals. Without an initial crack, the predicted life was 3513 cycles, which would be classified as high-cycle fatigue. With a crack width of 0.40 mm and a crack depth of 0.30 mm, the predicted life was 49 cycles, which is close to the actual failure life of 55 cycles. This demonstrated that the initial crack was the key factor that caused the screw gears to fail in the low-cycle fatigue regime.
My study also showed that the fatigue life of the screw gears can be improved by reducing the torque and the worm speed, by decreasing the tooth width, and by increasing the module. Among these factors, torque and speed have the strongest influence, followed by module. Tooth width has a relatively weak influence. The crack size in the width direction has a stronger influence than the crack size in the depth direction. Therefore, when designing a worm drive with screw gears, the designer should consider the combined effects of load, speed, geometry, and initial defects. The screw gears should be made of a material with sufficient hardness and toughness, and the heat treatment and casting process should be controlled to avoid microstructural inhomogeneity. The root region of the screw gears should be inspected carefully because it is the most likely location for crack initiation. If a crack is detected, the screw gears should be replaced before the crack grows to a critical size. This will prevent unexpected failure and ensure the safe operation of the reducer.
The finite element method combined with strain-life fatigue analysis proved to be an effective approach for understanding the failure of screw gears in worm transmissions. The dynamic contact simulation captured the alternating stress state and the load spectrum. The crack model captured the stress intensity factor distribution and the effect of crack size. The fatigue life prediction captured the transition from high-cycle to low-cycle fatigue. The results of this study can be used to guide the design, manufacturing, and maintenance of worm drives that use screw gears. Future work should include experimental measurement of the load spectrum under actual operating conditions, consideration of lubrication and temperature effects, and investigation of other materials for the screw gears. These extensions would further improve the accuracy of fatigue life prediction and help prevent similar failures in the future.