
I carried out this research to improve the lapping quality of constant-depth hypoid bevel gears used in the rear axle main reducer of front-engine, rear-drive automobiles. These hypoid bevel gears serve to reduce speed, increase torque, and change the direction of motion. Compared with other hypoid bevel gears, constant-depth tooth hypoid bevel gears provide better NVH behavior and higher machining efficiency, so they are widely used in automobile drive axles. Lapping is the final machining operation for these hypoid bevel gears, and its quality directly controls contact pattern consistency, tooth-surface roughness, and transmission error. In my work, I combined theoretical analysis, production-line investigation, orthogonal experimentation, and vehicle-level NVH testing to identify the dominant factors affecting lapping quality and to establish a more stable lapping process for hypoid bevel gears.
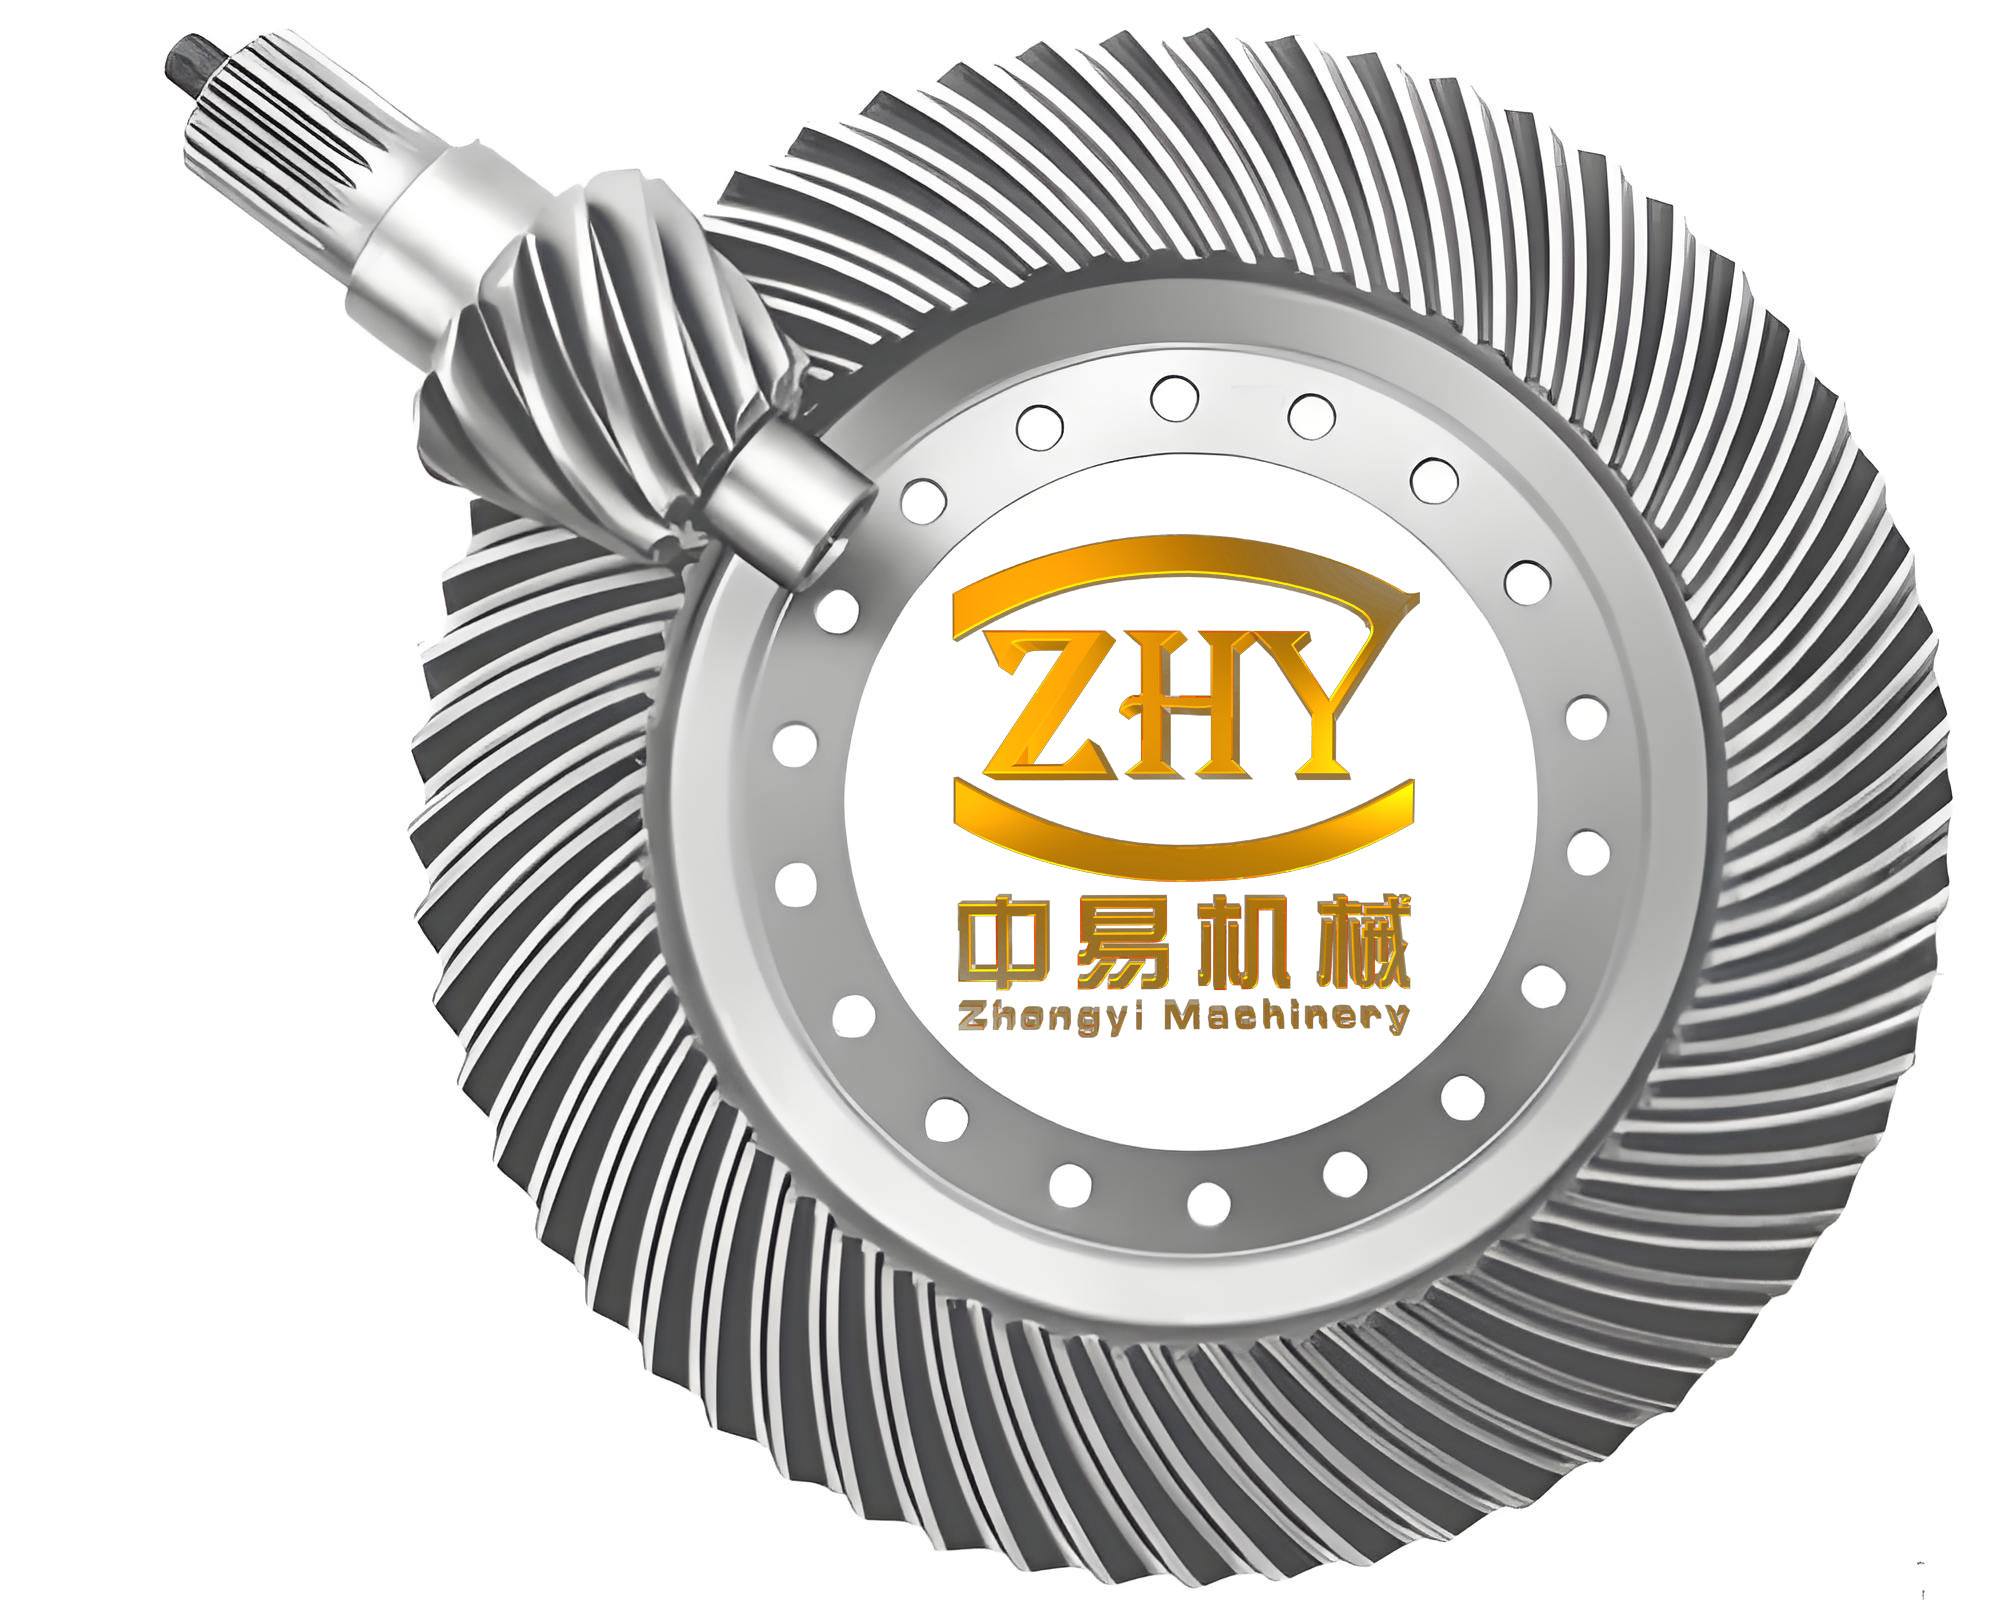
1. Research Background and Objectives
Hypoid bevel gears are among the most complex transmission components in automobile drivelines. Their tooth surfaces are generated by extended epicycloid curves, and after cutting and heat treatment, geometrical deviations and distortion cannot be removed by conventional grinding. Therefore, lapping becomes the only practical finishing process capable of correcting heat-treatment distortion, improving tooth-surface finish, homogenizing transmission error, and adjusting the contact pattern. The quality of lapped hypoid bevel gears determines the meshing noise of the rear axle and, consequently, the overall NVH performance of the vehicle.
In my production investigation, I found that the lapping process suffered from unstable contact patterns, large roughness variation, and excessive drive-side transmission error. These defects caused some rear axles to produce unacceptable whine or rattle noise during road tests. The objective of my research was therefore to answer three questions: first, how strongly lapping quality affects vehicle NVH performance; second, which lapping parameters and lapping-fluid properties dominate the final quality; and third, how the optimized process can be controlled in mass production. The target quality specifications I used are summarized in Table 1.
| Quality item | Requirement |
|---|---|
| Accuracy grade | Grade 7 |
| Contact pattern along tooth length | 50% to 70% |
| Contact pattern along tooth height | 55% to 75% |
| Drive-side transmission error | $$\le 30\,\mu\mathrm{rad}$$ |
| Coast-side transmission error | $$\le 25\,\mu\mathrm{rad}$$ |
| Tooth-surface roughness \(Ra\) | $$\le 1.0\,\mu\mathrm{m}$$ |
| Tooth-surface skewness \(Rsk\) | $$\le -0.4$$ |
| Meshing noise | $$\le 65\,\mathrm{dB}$$ |
I treated the contact pattern, tooth-surface roughness, and transmission error as the three primary response variables of lapping quality. Among them, roughness was further divided into the arithmetic mean deviation \(Ra\) and the skewness \(Rsk\). The skewness was especially important because it indicates whether the lapping process has removed the sharp peaks generated by cutting and heat treatment. A negative \(Rsk\) value indicates that the tooth surface is dominated by valleys rather than peaks, which is favorable for oil retention and noise reduction in hypoid bevel gears.
2. Lapping Quality Status and NVH Correlation
I first audited the existing lapping line. A batch of hypoid bevel gears was inspected for contact pattern, roughness, and single-flank transmission error. The results showed that the process was not capable of maintaining consistent quality. The main problems are listed in Table 2.
| Problem area | Observed condition |
|---|---|
| Contact pattern consistency | Large variation among sets from the same line |
| Drive-side roughness \(Ra\) | Often between \(0.8\,\mu\mathrm{m}\) and \(1.6\,\mu\mathrm{m}\), with frequent exceedance of the \(1.0\,\mu\mathrm{m}\) limit |
| Coast-side roughness \(Ra\) | Similar fluctuation, with some surfaces visibly rough |
| Drive-side transmission error | Frequently above \(30\,\mu\mathrm{rad}\) |
| Coast-side transmission error | Generally below \(25\,\mu\mathrm{rad}\), but not always stable |
| Vehicle NVH risk | Several axle assemblies produced meshing noise above \(65\,\mathrm{dB}\) |
To connect lapping quality with vehicle behavior, I conducted road NVH tests on a front-engine, rear-drive vehicle. The test system used a multi-channel data acquisition front end, an ICP microphone, a转速 sensor, and a laboratory vibration-noise analysis platform. The meshing order of the hypoid bevel gears was 12.52 in fifth gear. I evaluated three operating conditions: fifth-gear acceleration, fifth-gear coast, and fifth-gear uniform deceleration. The test conditions are shown in Table 3.
| Operating condition | Engine speed range |
|---|---|
| Fifth-gear acceleration | 2000 to 3600 r/min |
| Fifth-gear coast | 3600 to 2000 r/min |
| Fifth-gear uniform deceleration | 3600 to 2000 r/min |
I selected gear sets with controlled differences in only one quality characteristic at a time. This allowed me to isolate the effect of contact pattern, roughness, and transmission error on the measured noise. The transmission error definition I used is
$$\Delta(t)=\phi_2(t)-\gamma\phi_1(t),$$
where \(\phi_1(t)\) and \(\phi_2(t)\) are the angular positions of the pinion and the gear, respectively, and
$$\gamma=\frac{n_1}{n_2},$$
with \(n_1\) and \(n_2\) being the tooth numbers of the pinion and gear. A smaller fluctuation of \(\Delta(t)\) means smoother meshing and lower excitation of hypoid bevel gears.
2.1 Effect of Contact Pattern on NVH
I compared two hypoid bevel gear sets whose contact patterns differed mainly in position. One set had a contact pattern near the middle and slightly toward the small end. The other set had a contact pattern shifted toward the large end. All other inspected parameters were kept within a narrow range. The measured peak noise values for the 12.52 order are shown in Table 4.
| Gear set | Contact pattern tendency | Acceleration peak / dB | Coast peak / dB | Deceleration peak / dB |
|---|---|---|---|---|
| 1# | Middle toward small end | 59.36 | 57.12 | 62.53 |
| 2# | Middle toward large end | 65.67 | 61.29 | 73.23 |
The results showed that the contact pattern position had a clear influence on the noise of hypoid bevel gears. The set with the contact pattern biased toward the large end produced higher noise under all three conditions. Under load, the axial deflection of the shaft system tends to move the contact pattern toward the large end. If the initial pattern is already biased toward that region, edge contact occurs more easily, which increases impact and noise. Therefore, the contact pattern of hypoid bevel gears should remain centered or slightly toward the small end after lapping.
2.2 Effect of Tooth-Surface Roughness on NVH
I then compared two gear sets with similar contact patterns and similar transmission error but significantly different tooth-surface roughness. The roughness parameters before and after lapping are listed in Table 5, together with the measured noise peaks.
| Gear set | Before \(Ra\) / \(\mu\mathrm{m}\) | Before \(Rsk\) | After \(Ra\) / \(\mu\mathrm{m}\) | After \(Rsk\) | Acceleration peak / dB | Coast peak / dB | Deceleration peak / dB |
|---|---|---|---|---|---|---|---|
| 3# | 1.0856 | 0.0874 | 1.0256 | -0.4112 | 68.67 | 68.43 | 68.48 |
| 4# | 0.7451 | -0.1174 | 0.94 | -0.8018 | 64.45 | 62.46 | 57.96 |
The gear set with better lapped roughness produced much lower noise. In particular, the coast and deceleration peaks were reduced by approximately \(6\,\mathrm{dB}\) and \(11\,\mathrm{dB}\), respectively. The \(Rsk\) value was more informative than \(Ra\) alone. A more negative \(Rsk\) indicates that the lapping process has removed more asperity peaks, leaving a surface that is less aggressive during meshing. For hypoid bevel gears, controlling both \(Ra\) and \(Rsk\) is therefore necessary for NVH improvement.
2.3 Effect of Transmission Error on NVH
I also compared two hypoid bevel gear sets with similar contact patterns and roughness but different single-flank transmission error. The measured transmission errors and NVH peaks are shown in Table 6.
| Gear set | Drive-side TE / \(\mu\mathrm{rad}\) | Coast-side TE / \(\mu\mathrm{rad}\) | Acceleration peak / dB | Coast peak / dB | Deceleration peak / dB |
|---|---|---|---|---|---|
| 5# | 61.49 | 23.20 | 66.07 | 64.07 | 64.32 |
| 6# | 26.18 | 8.93 | 62.29 | 60.59 | 62.42 |
The lower transmission error set produced lower noise in every condition. The acceleration peak of the high-TE set exceeded the \(65\,\mathrm{dB}\) limit, while the low-TE set remained within the acceptable range. This confirmed that transmission error is a major excitation source for hypoid bevel gear noise. Therefore, lapping must not only improve surface finish but also homogenize the tooth contact and reduce transmission error.
3. Lapping Mechanism and Motion Control
To improve lapping quality, I analyzed the material-removal mechanism of hypoid bevel gears. During lapping, a braking torque is applied to the gear, and lapping fluid is injected into the meshing zone. The abrasive particles in the fluid are pressed between the tooth surfaces and remove a very small amount of material by rolling, sliding, or a combination of both. The process simultaneously improves surface finish, corrects heat-treatment distortion, and adjusts the contact pattern.
I simplified the tooth force into a concentrated force at the mid-face and resolved it into tangential, radial, and axial components. The tangential force can be written as
$$F_t=\frac{2000T}{d_m},$$
where \(T\) is the applied torque and \(d_m\) is the reference diameter. The radial and axial components are
$$F_r=\frac{F_n}{\cos\beta_m}\left(\tan\alpha_n\cos\delta+\sin\beta_m\sin\delta\right),$$
$$F_x=\frac{F_n}{\cos\beta_m}\left(\tan\alpha_n\sin\delta-\sin\beta_m\cos\delta\right),$$
where \(F_n\) is the normal force, \(\alpha_n\) is the normal pressure angle, \(\beta_m\) is the spiral angle at the meshing point, and \(\delta\) is the pitch cone angle. These force components control the local pressure on the abrasive particles and therefore the cutting depth.
For a single abrasive particle, I used a conical cutting model. The cutting depth is approximately
$$a_p=\sqrt{\frac{2F_{n0}}{\pi\delta_s\tan^2\varepsilon}},$$
where \(F_{n0}\) is the normal force on one particle, \(\delta_s\) is the yield strength of the gear material, and \(\varepsilon\) is the half-apex angle of the abrasive particle. The maximum cutting depth for the whole contact area can be expressed as
$$a_{p\max}=\left(\frac{\eta d_m^3 p}{G\delta_s\tan^2\varepsilon}\right)^{1/3},$$
with the grain rate
$$G=\frac{\pi n d_m^2\eta}{6}.$$
Here \(\eta\) is the volume fraction of abrasive, \(d_m\) is the mean abrasive diameter, \(n\) is the number of abrasive particles, and \(p\) is the contact pressure between the abrasive and the tooth surface. These equations show that the lapped surface roughness is governed by abrasive size, abrasive concentration, applied torque, and contact pressure. A larger abrasive or a higher torque increases the maximum cutting depth and worsens roughness, while a finer abrasive and a suitable concentration improve surface finish. This theoretical result guided my later selection of lapping fluid and lapping parameters.
3.1 V/H/J Motion Model
The V/H adjustment method is widely used in modern lapping machines for hypoid bevel gears. By adjusting the vertical offset \(V\), the horizontal position \(H\), and the gear mounting distance \(J\), the contact pattern can be moved along the tooth surface. The meshing condition can be written as
$$\mathbf{r}_{h1}(u_1,\theta_1;\phi_1,V,H,J)=\mathbf{r}_{h2}(u_2,\theta_2,\phi_2),$$
$$\mathbf{n}_{h1}(u_1,\theta_1;\phi_1)=\mathbf{n}_{h2}(u_2,\theta_2;\phi_2),$$
$$\mathbf{n}_{h}^{(2)}\mathbf{v}_{h}^{(12)}=f(u_1,\theta_1,\phi_1,u_2,\theta_2,\phi_2,V,H,J)=0.$$
For proper backlash control, I used the relationship
$$H+J\tan\delta_2+\sqrt{r_2^2-E^2}-\sqrt{r_2^2-V^2}=0,$$
where \(r_2\) is the pitch radius of the gear, \(E\) is the offset, and \(\delta_2\) is the pitch cone angle of the gear. This model allows the contact pattern to be moved to a desired position while maintaining a controlled meshing clearance. I used this relationship to design the lapping path and to correct contact-pattern deviations of hypoid bevel gears.
3.2 Influencing Factors
From the mechanism and motion model, I identified four main groups of factors affecting lapping quality. First, the lapping fluid determines the abrasive size, concentration, and lubricity. Second, the machine parameters, including torque, speed, and backlash, control the cutting depth and contact pressure. Third, the initial contact pattern and lapping path determine whether the entire tooth surface can be uniformly processed. Fourth, fixture accuracy and fluid management determine process stability in mass production. I addressed each of these factors in the following sections.
4. Lapping Fluid Selection and Matching
Lapping fluid is a mixture of abrasive particles and suspension oil. I selected green silicon carbide as the abrasive because of its high hardness, good thermal conductivity, and strong cutting ability. The suspension oil was a high-suspension lapping oil with good lubricity and cooling capacity. The density of the mixed fluid was used as an initial matching index. The mixture density is
$$\rho_{mix}=\frac{\rho_1 V_1+\rho_2 V_2}{V_1+V_2},$$
where \(\rho_1\) and \(V_1\) are the density and volume of the abrasive, and \(\rho_2\) and \(V_2\) are the density and volume of the oil. The target density of the reference imported lapping fluid was approximately \(1.5\,\mathrm{g/cm^3}\). With green silicon carbide density of \(3.22\,\mathrm{g/cm^3}\) and oil density of \(0.85\,\mathrm{g/cm^3}\), a volume ratio of abrasive to oil of \(1:3\) gave a density close to the target. I then tested three ratios: \(1:1\), \(1:3\), and \(1:5\). Each ratio was evaluated on three gear sets, and the average results are shown in Table 7.
| Abrasive-to-oil ratio | Drive \(Ra\) / \(\mu\mathrm{m}\) | Drive \(Rsk\) | Coast \(Ra\) / \(\mu\mathrm{m}\) | Coast \(Rsk\) |
|---|---|---|---|---|
| 1:1 | 1.4611 | -0.0499 | 1.5203 | 0.0226 |
| 1:3 | 1.3209 | -0.2425 | 1.3850 | -0.2280 |
| 1:5 | 1.3396 | -0.1193 | 1.5150 | -0.1563 |
The \(1:3\) ratio gave the best combination of \(Ra\) and \(Rsk\). With a \(1:1\) ratio, the fluid was too concentrated and likely had poor flow into the contact zone, causing uneven cutting. With a \(1:5\) ratio, the abrasive count was too low, so the removal of surface peaks was insufficient. I therefore selected \(1:3\) as the standard mixing ratio.
I also evaluated abrasive grit sizes of \(240\#\), \(280\#\), and \(320\#\). The results are shown in Table 8.
| Abrasive grit | Drive \(Ra\) / \(\mu\mathrm{m}\) | Drive \(Rsk\) | Coast \(Ra\) / \(\mu\mathrm{m}\) | Coast \(Rsk\) |
|---|---|---|---|---|
| 240# | 1.3211 | -0.2425 | 1.2379 | -0.2056 |
| 280# | 1.2391 | -0.3533 | 1.2741 | -0.2183 |
| 320# | 1.1095 | -0.4967 | 1.1212 | -0.3050 |
The \(320\#\) abrasive produced the lowest \(Ra\) and the most negative \(Rsk\) on both drive and coast sides. It also maintained sufficient lapping efficiency without causing surface burnishing or seizure. Therefore, I selected green silicon carbide with \(320\#\) grit and an abrasive-to-oil ratio of \(1:3\) as the matched lapping fluid for hypoid bevel gears.
5. Orthogonal Optimization of Lapping Parameters
After matching the lapping fluid, I optimized the machine parameters. The three factors were spindle speed \(A\), braking torque \(B\), and meshing backlash \(C\). Each factor was assigned three levels, as shown in Table 9.
| Level | Speed \(A\) / r/min | Torque \(B\) / Nm | Backlash \(C\) / mm |
|---|---|---|---|
| 1 | 600 | 2 | 0.07 |
| 2 | 800 | 3.5 | 0.09 |
| 3 | 1000 | 5 | 0.11 |
I used an \(L_9(3^4)\) orthogonal array, which required only nine experiments instead of a full factorial design. The array is shown in Table 10.
| Run | \(A\) | \(B\) | \(C\) |
|---|---|---|---|
| 1 | 1 | 1 | 1 |
| 2 | 1 | 2 | 2 |
| 3 | 1 | 3 | 3 |
| 4 | 2 | 1 | 2 |
| 5 | 2 | 2 | 3 |
| 6 | 2 | 3 | 1 |
| 7 | 3 | 1 | 3 |
| 8 | 3 | 2 | 1 |
| 9 | 3 | 3 | 2 |
For each run, I processed three gear sets and recorded the drive-side \(Ra\), \(Rsk\), and single-flank transmission error \(SFT\). The average drive-side results are listed in Table 11.
| Run | \(A\) level | \(B\) level | \(C\) level | \(Ra\) / \(\mu\mathrm{m}\) | \(Rsk\) | \(SFT\) / \(\mu\mathrm{rad}\) |
|---|---|---|---|---|---|---|
| 1 | 1 | 1 | 1 | 1.3453 | 0.1133 | 45.77 |
| 2 | 1 | 2 | 2 | 1.4404 | -0.1709 | 57.45 |
| 3 | 1 | 3 | 3 | 1.3041 | 0.0841 | 46.61 |
| 4 | 2 | 1 | 2 | 1.4504 | 0.0363 | 47.75 |
| 5 | 2 | 2 | 3 | 1.2516 | -0.1467 | 48.63 |
| 6 | 2 | 3 | 1 | 1.3343 | -0.1233 | 47.43 |
| 7 | 3 | 1 | 3 | 1.2543 | -0.4176 | 28.35 |
| 8 | 3 | 2 | 1 | 1.2805 | -0.7864 | 41.98 |
| 9 | 3 | 3 | 2 | 1.4574 | -0.1878 | 44.05 |
I first performed range analysis. For each factor and level, I calculated the sum \(K_i\), the mean \(\bar{K}_i\), and the range
$$R=\max(\bar{K}_1,\bar{K}_2,\bar{K}_3)-\min(\bar{K}_1,\bar{K}_2,\bar{K}_3).$$
A larger range indicates a stronger influence of that factor. The range-analysis results are summarized in Table 12.
| Response | Factor | \(K_1\) | \(K_2\) | \(K_3\) | Range \(R\) | Order | Preferred level |
|---|---|---|---|---|---|---|---|
| \(Ra\) | \(A\) | 4.089 | 4.035 | 3.993 | 0.033 | \(C>B>A\) | \(A_3\) |
| \(Ra\) | \(B\) | 4.050 | 3.972 | 4.095 | 0.041 | \(B_2\) | |
| \(Ra\) | \(C\) | 3.960 | 4.347 | 3.810 | 0.179 | \(C_3\) | |
| \(Rsk\) | \(A\) | 0.026 | -0.234 | -1.392 | 0.473 | \(A>B>C\) | \(A_3\) |
| \(Rsk\) | \(B\) | -0.268 | -1.104 | -0.227 | 0.292 | \(B_2\) | |
| \(Rsk\) | \(C\) | -0.796 | -0.322 | -0.480 | 0.158 | \(C_1\) | |
| \(SFT\) | \(A\) | 149.82 | 143.82 | 114.39 | 11.82 | \(A>B>C\) | \(A_3\) |
| \(SFT\) | \(B\) | 121.86 | 148.05 | 138.09 | 8.73 | \(B_1\) | |
| \(SFT\) | \(C\) | 135.18 | 149.25 | 123.60 | 8.55 | \(C_3\) |
The range analysis showed that speed \(A\) was the most important factor for \(Rsk\) and \(SFT\), while backlash \(C\) had the strongest single-factor effect on \(Ra\). Torque \(B\) was also significant, especially for \(Ra\) and \(Rsk\). The preferred levels were \(A_3\), \(B_2\), and \(C_3\), corresponding to a speed of \(1000\,\mathrm{r/min}\), a torque of \(3.5\,\mathrm{Nm}\), and a backlash of \(0.11\,\mathrm{mm}\).
Because the three responses have different units and different importance, I used a weighted scoring method combined with least-squares regression. I assigned a score of 10 to the best observed value and a score of 1 to the worst observed value for each response. Based on the NVH experiments, \(Rsk\) was weighted 3, \(Ra\) was weighted 2, and \(SFT\) was weighted 2. The composite score was
$$Score=2Ra+3Rsk+2SFT.$$
I then fitted a linear regression model
$$Y=\beta_0+\beta_1x_1+\beta_2x_2+\beta_3x_3,$$
where \(x_1\), \(x_2\), and \(x_3\) are \(Ra\), \(Rsk\), and \(SFT\), respectively, and \(Y\) is the composite score. The fitted coefficients and significance are shown in Table 13.
| Coefficient | Value | Significance |
|---|---|---|
| \(\beta_0\) | 173.43 | — |
| \(\beta_1\) for \(Ra\) | -87.48 | ** |
| \(\beta_2\) for \(Rsk\) | -29.99 | ** |
| \(\beta_3\) for \(SFT\) | -0.62 | * |
The regression model was
$$Y=173.43-87.48Ra-29.99Rsk-0.62SFT.$$
The model showed that \(Ra\) and \(Rsk\) had highly significant effects on the composite score, while \(SFT\) had a significant effect. I then used the regression scores as a single response for range analysis. The best combination was again \(A_3B_2C_3\).
I also performed an analysis of variance to verify the statistical significance. The total sum of squares, factor sums of squares, and error sum of squares were calculated as
$$S_T=\sum_{i=1}^{n}(k_i-\bar{k})^2=\sum k_i^2-\frac{1}{n}\left(\sum k_i\right)^2,$$
$$S_A=\frac{1}{3}\sum_{i=1}^{3}\left(\sum_{j=1}^{3}k_{ij}\right)^2-\frac{1}{n}\left(\sum_{i=1}^{3}\sum_{j=1}^{3}k_{ij}\right)^2,$$
$$S_e=S_T-S_A-S_B-S_C.$$
The degrees of freedom were \(f_T=8\), \(f_A=f_B=f_C=2\), and \(f_e=2\). The mean square was \(MS=S/f\), and the \(F\) ratio was
$$F=\frac{MS_{\text{factor}}}{MS_{\text{error}}}.$$
The ANOVA results are shown in Table 14.
| Source | Sum of squares | Degrees of freedom | Mean square | \(F\) value | Significance |
|---|---|---|---|---|---|
| \(A\) | 981.43 | 2 | 490.72 | 12.83 | ** |
| \(B\) | 159.27 | 2 | 79.63 | 2.08 | — |
| \(C\) | 882.06 | 2 | 441.03 | 11.53 | ** |
| Error | 76.48 | 2 | 38.24 | — | — |
| Total | 2099.25 | 8 | — | — | — |
The ANOVA confirmed that speed and backlash were highly significant, while torque was less significant but still important. The error sum of squares was smaller than the factor sums of squares, indicating that the experimental results were dominated by the controlled factors rather than random error. The final optimized lapping parameter set is shown in Table 15.
| Item | Optimized value |
|---|---|
| Abrasive material | Green silicon carbide |
| Abrasive grit | \(320\#\) |
| Abrasive-to-oil ratio | \(1:3\) |
| Spindle speed | \(1000\,\mathrm{r/min}\) |
| Braking torque | \(3.5\,\mathrm{Nm}\) |
| Meshing backlash | \(0.11\,\mathrm{mm}\) |
6. Verification and NVH Validation
I verified the optimized lapping fluid and parameter set on three additional hypoid bevel gear sets. The measured roughness and transmission error are listed in Table 16, together with a baseline set processed with the original parameters.
| Gear set | Drive \(Ra\) / \(\mu\mathrm{m}\) | Drive \(Rsk\) | Drive \(SFT\) / \(\mu\mathrm{rad}\) | Coast \(Ra\) / \(\mu\mathrm{m}\) | Coast \(Rsk\) | Coast \(SFT\) / \(\mu\mathrm{rad}\) |
|---|---|---|---|---|---|---|
| 1# | 0.9012 | -0.7290 | 26.18 | 0.8418 | -0.6425 | 7.268 |
| 2# | 0.8874 | -0.8227 | 27.74 | 0.8633 | -0.7533 | 8.799 |
| 3# | 0.9326 | -0.6029 | 31.29 | 0.9475 | -0.6932 | 10.12 |
| Baseline | 1.3041 | -0.1065 | 46.61 | 1.2273 | 0.1102 | 14.50 |
Compared with the baseline, the optimized process reduced drive-side \(Ra\) by approximately \(0.4\,\mu\mathrm{m}\) and reduced \(Rsk\) by approximately \(0.5\) to \(0.7\). Drive-side \(SFT\) was reduced by approximately \(15\) to \(20\,\mu\mathrm{rad}\). The coast side also improved: \(Ra\) decreased by about \(0.3\) to \(0.4\,\mu\mathrm{m}\), \(Rsk\) became more negative than \(-0.6\), and \(SFT\) was kept below \(10\,\mu\mathrm{rad}\) in most cases. These results confirmed that the optimized process improved both surface finish and meshing uniformity of hypoid bevel gears.
I then installed the verified gear sets into rear axle assemblies and repeated the vehicle NVH road test. The measured 12.52-order noise peaks are shown in Table 17.
| Gear set | Acceleration peak / dB | Coast peak / dB | Deceleration peak / dB |
|---|---|---|---|
| 1# | 57.30 | 59.00 | 58.63 |
| 2# | 62.92 | 59.57 | 62.36 |
| 3# | 59.51 | 55.68 | 58.20 |
All three optimized gear sets remained below the \(65\,\mathrm{dB}\) limit in every operating condition, and most measurements were below \(60\,\mathrm{dB}\). The contact patterns after lapping were also more consistent and closer to the target position. The optimized lapping process therefore improved the NVH performance of the hypoid bevel gears in the rear axle.
7. Quality Control and Management
To maintain the improved lapping quality in mass production, I established control rules for fixture accuracy, lapping-fluid management, and pre-lapping contact-pattern classification.
7.1 Fixture Accuracy Control
I tracked the runout of the lapping machine fixtures over one month. The face runout increased from approximately \(6\,\mu\mathrm{m}\) to \(10\,\mu\mathrm{m}\), and the radial runout increased from approximately \(12\,\mu\mathrm{m}\) to \(16\,\mu\mathrm{m}\). Because excessive runout changes the mounting distance and shifts the meshing position of hypoid bevel gears, I set the limits shown in Table 18.
| Item | Limit | Check frequency |
|---|---|---|
| Face runout | $$\le 10\,\mu\mathrm{m}$$ | Weekly |
| Radial runout | $$\le 15\,\mu\mathrm{m}$$ | Weekly |
7.2 Lapping Fluid Management
I measured the fluid consumption during continuous production. The lapping fluid tank held \(20\,\mathrm{L}\), and approximately \(2\,\mathrm{L}\) of fluid was consumed per \(100\) gear sets. To keep the abrasive concentration stable, I specified the management rules in Table 19.
| Action | Frequency |
|---|---|
| Add new lapping fluid | \(1\,\mathrm{L}\) per \(50\) sets |
| Clean magnetic iron chips | Every \(100\) sets |
| Replace entire lapping fluid | Every \(10\) days or \(2000\) sets |
I evaluated the effect of fluid age by measuring \(Rsk\) after every \(100\) sets. The lapping quality remained acceptable up to about \(2000\) sets, after which \(Rsk\) increased toward zero and the lapping effect deteriorated. Therefore, replacing the entire fluid after approximately \(2000\) sets is necessary to maintain the quality of hypoid bevel gears.
7.3 Pre-Lapping Contact-Pattern Classification
Contact-pattern classification before lapping is critical for achieving consistent final contact patterns. I divided the tooth surface into six equal regions along the tooth length and three regions along the tooth height. The optimal pre-lapping contact pattern should be located near the middle and slightly toward the small end, with the height position centered. I then defined four main classes, as shown in Table 20.
| Class | Contact-pattern position | Action |
|---|---|---|
| Optimal | Middle toward small end, centered in height | Use standard lapping path |
| Acceptable A | Middle toward large end, centered in height | Use adjusted lapping path |
| Acceptable B | Slightly toward small end, centered in height | Use adjusted lapping path |
| Unacceptable | Extreme large end, extreme small end, tooth tip, or tooth root | Reclassify or rework before lapping |
This classification reduced the influence of operator judgment and made the pre-lapping sorting process more repeatable. By assigning different lapping paths to different pre-lapping contact patterns, I was able to improve the final contact-pattern consistency of hypoid bevel gears.
8. Conclusions
I investigated the lapping process of constant-depth hypoid bevel gears for automobile rear axles. The main findings and outcomes of my research are as follows.
First, I confirmed through vehicle NVH tests that lapping quality has a direct and significant effect on the meshing noise of hypoid bevel gears. Contact-pattern position, tooth-surface roughness, and transmission error all influence the measured 12.52-order noise. A contact pattern biased toward the large end, a rough tooth surface with high \(Rsk\), and a large drive-side transmission error all increase noise. Among the roughness parameters, \(Rsk\) was more closely related to NVH behavior than \(Ra\) alone.
Second, I established a lapping cutting model and a V/H/J motion-control model for hypoid bevel gears. The cutting-depth equations showed that abrasive size, abrasive concentration, applied torque, and contact pressure control the material removal depth. These theoretical results explained why both lapping fluid and machine parameters must be optimized together.
Third, I matched a new lapping fluid for hypoid bevel gears. Green silicon carbide with \(320\#\) grit and an abrasive-to-oil ratio of \(1:3\) produced the best combination of low \(Ra\), negative \(Rsk\), and acceptable lapping efficiency.
Fourth, I optimized the lapping parameters through an orthogonal experiment. The preferred combination was a spindle speed of \(1000\,\mathrm{r/min}\), a braking torque of \(3.5\,\mathrm{Nm}\), and a meshing backlash of \(0.11\,\mathrm{mm}\). Range analysis, weighted regression scoring, and ANOVA all supported this combination. Speed and backlash were the most significant factors.
Fifth, I verified the optimized process on additional hypoid bevel gears and on vehicle NVH tests. The optimized process reduced drive-side \(Ra\) by approximately \(0.4\,\mu\mathrm{m}\), reduced \(Rsk\) by approximately \(0.6\), and reduced drive-side transmission error by approximately \(18\,\mu\mathrm{rad}\). The vehicle noise peaks remained below \(65\,\mathrm{dB}\), and most were below \(60\,\mathrm{dB}\).
Finally, I established practical quality-control rules for mass production. These rules cover fixture runout limits, lapping-fluid addition and replacement intervals, iron-chip cleaning, and pre-lapping contact-pattern classification. Together with the optimized fluid and machine parameters, these measures provide a stable and repeatable lapping process for hypoid bevel gears and improve the NVH performance of automobile rear axles.