
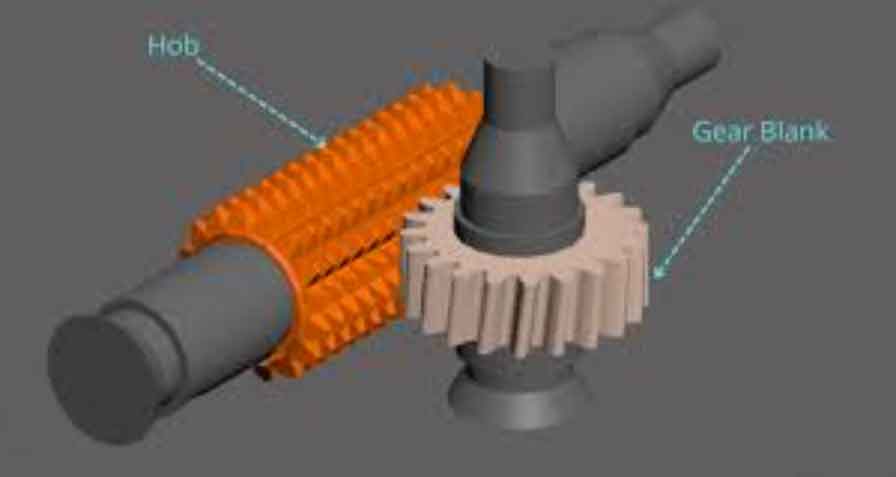
In my research, I focus on the thermal behavior of dry gear hobbing machines because gear hobbing is one of the most important generative processes for producing high-quality gears, and dry gear hobbing has become a green and efficient alternative to conventional wet gear hobbing. In dry gear hobbing, cutting oil is replaced by compressed air or minimal cooling media, which reduces environmental pollution and improves resource efficiency. However, the absence of abundant liquid cooling causes heat to accumulate inside the machine tool, especially in the spindle system, the tool holder, the worktable, and the feed drive units. This heat accumulation changes the temperature field, induces thermal deformation, and eventually affects gear tooth accuracy, pitch consistency, and long-term machining stability. Therefore, I systematically studied the thermal characteristics of dry gear hobbing machines, developed a multi-information fusion test system, proposed a thermal error prediction method, and established a multi-objective optimization method for dry gear hobbing process parameters.
1. Research Context and Motivation
Gear hobbing is widely used in automotive, aerospace, robotics, precision machinery, and energy equipment because it can continuously generate gear teeth with high productivity. Dry gear hobbing removes the dependence on cutting fluid and therefore avoids oil mist, waste liquid, and high disposal costs. Nevertheless, dry gear hobbing also creates severe thermal challenges. The spindle rotates at high speed, the hob cuts the workpiece under high contact pressure, and the machine tool is often enclosed by protective structures that limit heat dissipation. These conditions make the thermal behavior of dry gear hobbing different from that of conventional wet gear hobbing. I observed that the heat generation and heat transfer mechanisms in dry gear hobbing involve coupled electrical, mechanical, hydraulic, and pneumatic energy conversions, which produce complex temperature distributions and thermal deformations.
The key motivation of my work can be summarized as follows:
| Challenge in Dry Gear Hobbing | Thermal Consequence | Research Need |
|---|---|---|
| High spindle speed and direct-drive motors | Motor loss and bearing friction heat increase rapidly | Online measurement of multiple thermal signals |
| No flood cooling | Heat accumulates in the cutting zone and machine structure | Accurate thermal characteristic analysis |
| Enclosed machine layout | Uneven temperature fields and local hot spots | Multi-point temperature and deformation monitoring |
| Thermal lag and nonlinearity | Thermal error varies with time and operating conditions | Advanced thermal error prediction |
| Trade-off among heat, quality, and efficiency | Process parameters strongly affect thermal stability | Multi-objective process optimization |
From my perspective, solving the thermal problem of dry gear hobbing requires three interconnected capabilities: reliable thermal data acquisition, accurate thermal error modeling, and systematic process parameter optimization. I built my research around these three capabilities.
2. Multi-Information Fusion Test System for Dry Gear Hobbing Thermal Characteristics
I developed a multi-information fusion test system to capture the thermal state of a dry gear hobbing machine. The system integrates temperature sensors, thermal deformation sensors, data acquisition modules, a chassis, a host computer, and data post-processing functions. The design considers the unique structure of a dry gear hobbing machine, including a vertical layout, direct-drive hob spindle, direct-drive worktable, and enclosed cutting space. Because the thermal signals are diverse and distributed across the machine, I used a modular architecture that allows temperature, displacement, force, vibration, and noise signals to be acquired either simultaneously or in reserved channels.
| Function | Selected Device or Method | Key Specification | Purpose in Dry Gear Hobbing |
|---|---|---|---|
| Temperature acquisition | 16-channel thermocouple input module | Cold-junction compensation, auto-zero, low thermal gradient layout | Measure hob spindle bearings, worktable bearing, guideways, oil lines, cooling water, nozzle outlet |
| Thermal deformation acquisition | 16-channel simultaneous voltage input module | Differential input, synchronized sampling | Measure worktable spindle thermal displacement |
| Chassis | Four-slot compact DAQ chassis | Portable, expandable, external power supply | Host temperature and displacement modules and reserve channels |
| Temperature sensor | K-type thermocouple | 0 to 482 degrees Celsius, fast response, good linearity | Capture transient thermal response of gear hobbing machine components |
| Displacement sensor | CMOS laser displacement sensor | Repeatability 10 micrometers, range plus or minus 5 millimeters | Measure small thermal deformation of the worktable spindle |
| Software platform | LabVIEW with embedded Python processing | Real-time display, data storage, post-processing | Support thermal data acquisition and analysis for gear hobbing |
The host computer software was developed with separate acquisition loops for temperature and thermal deformation. This separation avoids interference between channels and allows different sampling rates and sampling durations to be configured independently. I also integrated a login system, platform management, data storage, and maintenance functions. The platform can store full-process data and single-workpiece data, which is useful for comparing different gear hobbing cycles.
For data processing, I adopted an Input-Process-Output model. The input is the raw temperature and displacement data stored in TDMS files. The process includes outlier replacement, moving average filtering, wavelet filtering, and data resampling. The output is a denoised and resampled thermal curve that can be used for thermal characteristic analysis, thermal error prediction, and process optimization.
The moving average filter is expressed as
$$ \bar{x}_i = \frac{1}{n}\sum_{k=i-n+1}^{i} x_k $$
where \(n\) is the window length, \(x_k\) is the original signal, and \(\bar{x}_i\) is the filtered value. For wavelet filtering, I used threshold rules to suppress noise while preserving the thermal trend. A general threshold form can be written as
$$ \lambda_s = \sqrt{2\log N_x}, \qquad \lambda_r = W_{\min} $$
where \(N_x\) is the number of wavelet coefficients, \(W_{\min}\) is the minimum wavelet coefficient, and \(\lambda_s\) and \(\lambda_r\) represent soft and hard threshold parameters. After filtering, I resampled the data by grouping samples at a specified frequency and calculating the average value in each group.
| Data Stage | Operation | Benefit for Dry Gear Hobbing Analysis |
|---|---|---|
| Input | Read TDMS files into NumPy arrays | Provides consistent data access for temperature and deformation signals |
| Outlier replacement | Detect values beyond \(3\sigma\) or user-defined limits | Removes electrostatic spikes and abnormal jumps during gear hobbing |
| Moving average | Smooth short-term fluctuations | Reveals the overall thermal trend of the gear hobbing machine |
| Wavelet filtering | Threshold wavelet coefficients and reconstruct | Reduces noise while retaining thermal lag features |
| Resampling | Group by frequency and compute averages | Reduces data density and improves analysis stability |
| Output | Generate curves and save spreadsheets | Supports thermal modeling and optimization of gear hobbing |
3. Thermal Characteristics of the Dry Gear Hobbing Machine
I analyzed the heat generation and heat dissipation mechanisms of the dry gear hobbing machine by considering the conversion of electrical energy, mechanical energy, hydraulic energy, pneumatic energy, and thermal energy. In dry gear hobbing, the drive system converts electrical energy into mechanical energy for the hob spindle, worktable spindle, and feed axes. Part of this mechanical energy is converted into cutting heat during gear tooth removal, and another part becomes friction heat in bearings, guideways, ball screws, and sliding pairs. The auxiliary systems, including hydraulic units, pneumatic units, cooling units, lubrication units, and chip removal units, also consume electrical energy and generate heat through losses and friction.
I expressed the overall energy balance of the dry gear hobbing machine as
$$ E_{\text{in}} = E_{\text{mech}} + E_{\text{hyd}} + E_{\text{pneu}} + Q_{\text{total}} + E_{\text{loss}} $$
where \(E_{\text{in}}\) is the input electrical energy, \(E_{\text{mech}}\) is the mechanical energy used for gear hobbing motions, \(E_{\text{hyd}}\) and \(E_{\text{pneu}}\) are hydraulic and pneumatic energy, \(Q_{\text{total}}\) is the accumulated or dissipated heat, and \(E_{\text{loss}}\) represents other losses. The heat sources in dry gear hobbing include motor loss, cutting heat, friction heat, and environmental thermal radiation. The heat transfer paths include conduction through machine structures, convection to compressed air and cooling water, radiation to the environment, and heat carried away by chips, workpiece, and hob.
3.1 Heat Generation Models
The motor heat in the dry gear hobbing machine can be estimated as
$$ Q_m = \frac{M_m n_m}{9550}\frac{1-\eta_m}{\eta_m} $$
where \(Q_m\) is the motor heat generation rate, \(M_m\) is the motor output torque, \(n_m\) is the motor speed, and \(\eta_m\) is the motor efficiency. The cutting heat during gear hobbing is
$$ Q_c = \eta_c F_c v_c $$
where \(\eta_c\) is the fraction of cutting work converted into heat, \(F_c\) is the main cutting force, and \(v_c\) is the cutting speed. For a hob with diameter \(d_h\) and rotational speed \(n_h\),
$$ v_c = \frac{\pi d_h n_h}{60} $$
The cutting force in gear hobbing can be represented by an empirical form:
$$ F_c = 1.96 \times 10^4 \frac{m_n^{0.95} f_z^{0.8} a_p^{0.15} C_w}{v_c^{0.35} z_g^{0.28} z_k^{0.7} A_h^{0.6}} e^{C_g} $$
where \(m_n\) is the normal module, \(f_z\) is the axial feed, \(a_p\) is the cutting depth, \(C_w\) is the workpiece material coefficient, \(z_g\) is the gear tooth number, \(z_k\) is the hob flute number, \(A_h\) is the hob coefficient, and \(C_g\) is the hob start coefficient. The friction heat from bearings, ball screws, and guideways is also important. For bearings,
$$ Q_b = 1.047 \times 10^{-4} n_b M_b $$
where \(n_b\) is the bearing speed and \(M_b\) is the friction torque. For ball screws,
$$ Q_s = 1.047 \times 10^{-4} n_s M_s $$
and for guideway sliding,
$$ Q_r = \frac{\mu_k W g v_g}{J} $$
where \(\mu_k\) is the kinetic friction coefficient, \(W\) is the load, \(g\) is gravitational acceleration, \(v_g\) is the relative sliding speed, and \(J\) is the mechanical equivalent of heat. The total heat generation rate in the dry gear hobbing machine is therefore
$$ Q_{\text{total}} = Q_m + Q_c + Q_b + Q_s + Q_r $$
| Heat Source | Main Cause | Typical Location in Gear Hobbing | Model Symbol |
|---|---|---|---|
| Motor loss | Copper loss, iron loss, mechanical loss | Hob spindle motor, worktable motor, feed motors | \(Q_m\) |
| Cutting heat | Plastic deformation and friction between hob and gear | Cutting zone, hob teeth, chip root | \(Q_c\) |
| Bearing friction | Rolling and sliding contact | Hob spindle bearings and worktable bearings | \(Q_b\) |
| Ball screw friction | Contact between balls and raceways | Axial feed axes | \(Q_s\) |
| Guideway friction | Sliding between guideways and sliders | Radial and axial feed axes | \(Q_r\) |
3.2 Experimental Thermal Behavior
I conducted dry gear hobbing experiments on a coated hob and an automotive driven gear. The process parameters are summarized below. I measured temperature at multiple points and thermal deformation of the worktable spindle. The experimental environment was maintained at approximately 27 degrees Celsius to reduce external thermal disturbance.
| Parameter | Value | Unit | Parameter | Value | Unit |
|---|---|---|---|---|---|
| Gear module | 1.95 | mm | Hob flute number | 16 | – |
| Gear tooth number | 52 | – | Hob installation angle | 24.83 | degree |
| Gear helix angle | -27 | degree | Hob lead angle | -2.17 | degree |
| Gear width | 15.55 | mm | Hob outer diameter | 75 | mm |
| Full tooth depth | 2 | mm | Spindle speed | 950 | r/min |
| Hob start number | 1 | – | Axial feed rate | 36.058 | mm/min |
The temperature measurement points covered the hob spindle front bearing, hob spindle middle bearing, worktable bearing, X-axis upper slider, Z2-axis bearing, X-axis lower slider, Z-axis screw nut, Z-axis guideway slider, average hob temperature, hob spindle motor end, cooling water inlet, cooling water outlet, lubricating oil inlet, lubricating oil outlet, nozzle outlet, and ambient temperature.
| Code | Measurement Point | Code | Measurement Point |
|---|---|---|---|
| T1 | Hob spindle front bearing | T9 | Average hob temperature |
| T2 | Hob spindle middle bearing | T10 | Hob spindle motor end |
| T3 | Worktable bearing | T11 | Cooling water inlet |
| T4 | X-axis upper slider | T12 | Cooling water outlet |
| T5 | Z2-axis bearing | T13 | Lubricating oil inlet |
| T6 | X-axis lower slider | T14 | Lubricating oil outlet |
| T7 | Z-axis screw nut | T15 | Nozzle outlet |
| T8 | Z-axis guideway slider | T16 | Ambient temperature |
The measured thermal behavior showed that all temperature points first increased rapidly and then gradually approached a steady state. The hob temperature was the highest because the hob continuously contacts the gear during gear hobbing. The hob spindle front bearing reached a relatively higher steady temperature because its heat dissipation was weaker than that of other bearing positions. The worktable bearing, Z2-axis bearing, and hob spindle middle bearing showed slower temperature rises. The X-axis and Z-axis guideway temperatures increased slowly because their motion speeds and friction heat were lower than those of the spindle system. The cooling water outlet temperature was slightly higher than the inlet temperature, indicating that the cooling circuit removed part of the heat generated during gear hobbing. The lubricating oil outlet temperature was also higher than the inlet temperature, showing that lubrication oil participated in heat transport.
The thermal deformation of the worktable spindle increased with machining time. During the initial stage, the deformation rose quickly because heat generation exceeded heat dissipation. After about one hour, the heat generation and heat dissipation gradually balanced, and the thermal deformation became stable. The stable thermal deformation of the worktable spindle was about 14 micrometers in my experiment. This thermal deformation is critical for gear hobbing accuracy because it changes the relative position between the hob and the gear workpiece.
I also used infrared thermal imaging to examine the cutting zone. The highest temperature appeared near the hob engagement region and decreased toward the hob ends. Another high-temperature region appeared near the gear and fixture, especially near the contact area. The gear tooth slot region showed a peak temperature above ambient, and the inner side of the tooth slot was not always the coolest region because chips and compressed air affected local heat transfer. These observations confirmed that the thermal field in dry gear hobbing is spatially nonuniform and strongly influenced by the cutting process.
4. Thermal Error Prediction for Dry Gear Hobbing
I proposed a thermal error prediction method for the worktable spindle of the dry gear hobbing machine. The method first identifies temperature-sensitive points and then uses a CNN-BiGRU neural network to predict thermal error. The prediction is important because thermal error in gear hobbing reduces tooth profile accuracy, lead accuracy, and batch consistency. The thermal error has a clear lag and nonlinear relationship with temperature, so a simple linear model is insufficient.
4.1 Temperature-Sensitive Point Selection
I used K-means clustering to group the measured temperature points. The objective of K-means is to minimize the within-cluster distance:
$$ J = \sum_{j=1}^{K}\sum_{x_i \in C_j} \|x_i – \mu_j\|^2 $$
where \(C_j\) is the \(j\)-th cluster, \(x_i\) is a temperature sample, and \(\mu_j\) is the cluster center. The Euclidean distance is
$$ d(x_i,\mu_j)=\sqrt{\sum_{l=1}^{n}(x_{il}-\mu_{jl})^2} $$
The cluster center update is
$$ \mu_j = \frac{1}{|C_j|}\sum_{x_i \in C_j} x_i $$
After clustering, I used the Pearson correlation coefficient to select the most representative temperature point in each cluster:
$$ r = \frac{\sum_{i=1}^{n}(X_i-\bar{X})(Y_i-\bar{Y})}{\sqrt{\sum_{i=1}^{n}(X_i-\bar{X})^2}\sqrt{\sum_{i=1}^{n}(Y_i-\bar{Y})^2}} $$
where \(X_i\) is the temperature variable and \(Y_i\) is the thermal error variable. A larger absolute value of \(r\) indicates a stronger correlation with thermal error. I then used a BP neural network to evaluate different clustering groups and determine the best number of clusters.
| Cluster Number \(K\) | Representative Temperature Points |
|---|---|
| 3 | T1, T3, T9 |
| 4 | T1, T2, T9, T12 |
| 5 | T1, T2, T5, T9, T12 |
| 6 | T1, T2, T3, T9, T12, T14 |
| 7 | T1, T2, T3, T9, T11, T12, T14 |
| 8 | T1, T2, T3, T5, T9, T11, T12, T14 |
| 9 | T1, T2, T3, T5, T9, T11, T12, T14, T15 |
| 10 | T1, T2, T3, T5, T9, T10, T11, T12, T14, T15 |
The BP neural network evaluation indicated that \(K=5\) provided the best thermal error calculation performance. At this setting, the selected temperature-sensitive points were T1, T2, T5, T9, and T12, corresponding to the hob spindle front bearing, hob spindle middle bearing, Z2-axis bearing, average hob temperature, and cooling water outlet.
| \(K\) | MSE | RMSE | MAE | MedAE | \(R^2\) |
|---|---|---|---|---|---|
| 3 | 0.0011 | 0.5348 | 0.4374 | 0.3931 | 0.9791 |
| 4 | 0.0011 | 0.5270 | 0.4317 | 0.3794 | 0.9798 |
| 5 | 0.0010 | 0.5161 | 0.4126 | 0.3672 | 0.9806 |
| 6 | 0.0025 | 0.8153 | 0.6674 | 0.5955 | 0.9516 |
| 7 | 0.0014 | 0.6220 | 0.4977 | 0.4461 | 0.9718 |
| 8 | 0.0014 | 0.6203 | 0.5121 | 0.4692 | 0.9720 |
| 9 | 0.0015 | 0.6266 | 0.5116 | 0.4428 | 0.9714 |
| 10 | 0.0012 | 0.5644 | 0.4577 | 0.3696 | 0.9768 |
4.2 CNN-BiGRU Thermal Error Prediction
I designed a CNN-BiGRU model to predict the thermal error of the dry gear hobbing machine. The CNN extracts local thermal features from the temperature and deformation sequences. The BiGRU captures forward and backward temporal dependencies. This structure is suitable for gear hobbing because thermal error is affected by both past heat accumulation and future thermal trends within a machining cycle.
For the convolution operation,
$$ y_j^{(l)} = \sigma\left(\sum_{i \in M_j} x_i^{(l-1)} * w_{ij}^{(l)} + b_j^{(l)}\right) $$
where \(*\) denotes convolution, \(w_{ij}^{(l)}\) is the kernel weight, \(b_j^{(l)}\) is the bias, and \(\sigma\) is the activation function. The pooling operation is
$$ p_j = \max_{i \in R_j} y_i $$
where \(R_j\) is the pooling region. After convolution and pooling, the fully connected layer converts the features into a sequence suitable for the BiGRU.
The GRU update gate is
$$ z_t = \sigma(W_z x_t + U_z h_{t-1} + b_z) $$
The reset gate is
$$ r_t = \sigma(W_r x_t + U_r h_{t-1} + b_r) $$
The candidate hidden state is
$$ \tilde{h}_t = \tanh(W_h x_t + U_h (r_t \odot h_{t-1}) + b_h) $$
The hidden state is
$$ h_t = (1-z_t)\odot h_{t-1} + z_t \odot \tilde{h}_t $$
For the BiGRU,
$$ \overrightarrow{h_t} = \mathrm{GRU}(x_t,\overrightarrow{h_{t-1}}), \qquad \overleftarrow{h_t} = \mathrm{GRU}(x_t,\overleftarrow{h_{t+1}}) $$
$$ h_t = \overrightarrow{h_t} \oplus \overleftarrow{h_t} $$
I used three BiGRU layers. Each layer was followed by a dropout layer with a dropout rate of 30 percent to reduce overfitting. The model was evaluated by MSE, RMSE, MAE, MedAE, and \(R^2\):
$$ \mathrm{MSE} = \frac{1}{n}\sum_{i=1}^{n}(y_i-\hat{y}_i)^2 $$
$$ \mathrm{RMSE} = \sqrt{\frac{1}{n}\sum_{i=1}^{n}(y_i-\hat{y}_i)^2} $$
$$ \mathrm{MAE} = \frac{1}{n}\sum_{i=1}^{n}|y_i-\hat{y}_i| $$
$$ \mathrm{MedAE} = \mathrm{median}(|y_1-\hat{y}_1|,\ldots,|y_n-\hat{y}_n|) $$
$$ R^2 = 1 – \frac{\sum_{i=1}^{n}(y_i-\hat{y}_i)^2}{\sum_{i=1}^{n}(y_i-\bar{y})^2} $$
I compared the CNN-BiGRU model with BP, LSTM, GRU, and BiGRU models. The CNN-BiGRU model achieved the lowest MSE, RMSE, MAE, and MedAE values and the highest \(R^2\) value. This result indicates that the CNN-BiGRU model can predict thermal error in dry gear hobbing more accurately than the other tested models.
| Model | MSE | RMSE | MAE | MedAE | \(R^2\) |
|---|---|---|---|---|---|
| BP | \(1.01\times10^{-3}\) | \(5.16\times10^{-1}\) | \(4.13\times10^{-1}\) | \(3.67\times10^{-1}\) | 0.98061 |
| LSTM | \(0.90\times10^{-3}\) | \(4.84\times10^{-1}\) | \(3.85\times10^{-1}\) | \(3.29\times10^{-1}\) | 0.98298 |
| GRU | \(0.91\times10^{-3}\) | \(4.89\times10^{-1}\) | \(3.95\times10^{-1}\) | \(3.45\times10^{-1}\) | 0.98262 |
| BiGRU | \(0.94\times10^{-3}\) | \(4.95\times10^{-1}\) | \(4.05\times10^{-1}\) | \(3.60\times10^{-1}\) | 0.98216 |
| CNN-BiGRU | \(0.78\times10^{-3}\) | \(4.53\times10^{-1}\) | \(3.55\times10^{-1}\) | \(2.96\times10^{-1}\) | 0.98507 |
5. Multi-Objective Optimization of Dry Gear Hobbing Thermal Characteristics
I formulated a multi-objective optimization method to improve the thermal characteristics of dry gear hobbing while maintaining acceptable machining efficiency and gear quality. The decision variables are hob spindle speed \(n_h\) and axial feed \(f_z\). The objectives include minimizing heat generation, minimizing gear quality error, and reducing machining time. The constraints include spindle speed limits, axial feed limits, cutting force limits, and workpiece module limits.
The heat generation objective is
$$ Q_{\text{total}} = Q_m + Q_c + Q_b + Q_s + Q_r $$
The machining time for a single pass in gear hobbing is
$$ t_c = \frac{L_z}{F_z} $$
where the axial stroke is
$$ L_z = L_1 + L_2 + B + L_e + L_a $$
The axial feed speed is
$$ F_z = \frac{f_z z_n v_c}{1000 d_h z_g} $$
The total time objective also includes air movement and tool change time:
$$ t = t_c + t_e + t_{ac} $$
The gear quality error model includes lead error and profile error. I used
$$ M = \lambda_1 \delta_o + \lambda_2 \delta_s $$
where
$$ \delta_o = \frac{f_z^2 \sin\alpha}{4 d_h \cos\beta} $$
$$ \delta_s = \frac{\pi^2 m_n^2 \sin\alpha}{4 z_g z_k} $$
and \(\lambda_1\) and \(\lambda_2\) are weighting coefficients. The optimization model is
$$ \min_{n_h,f_z} \left[ Q_{\text{total}}(n_h,f_z),\; M(n_h,f_z),\; t(n_h,f_z) \right] $$
subject to
$$ n_{\min} \leq n_h \leq n_{\max} $$
$$ f_{z,\min} \leq f_z \leq f_{z,\max} $$
$$ F_c \leq F_{c,\max} $$
$$ m_{n,\min} \leq m_n \leq m_{n,\max} $$
| Constraint | Expression | Physical Meaning in Gear Hobbing |
|---|---|---|
| Hob speed | \(n_{\min} \leq n_h \leq n_{\max}\) | Prevents spindle overload and excessive motor heat |
| Axial feed | \(f_{z,\min} \leq f_z \leq f_{z,\max}\) | Balances tooth quality, tool wear, and heat generation |
| Cutting force | \(F_c \leq F_{c,\max}\) | Ensures stable gear hobbing and avoids tool breakage |
| Workpiece module | \(m_{n,\min} \leq m_n \leq m_{n,\max}\) | Keeps the process within machine and tool capacity |
I used the MOEA/D algorithm to solve the multi-objective optimization model. MOEA/D decomposes the multi-objective problem into several scalar subproblems and optimizes them cooperatively. The Tchebycheff scalarization used in my method is
$$ \min g^{te}(x|\lambda,z^*) = \max_{j=1,\ldots,m}\lambda_j |f_j(x)-z_j^*| $$
The ideal point update is
$$ z_j^* = \min(z_j^*, f_j(y)) $$
where \(y\) is a new candidate solution. If the new solution improves a neighboring subproblem, it replaces the corresponding old solution. This process continues until the Pareto front converges or the maximum iteration number is reached.
| MOEA/D Step | Operation | Role in Dry Gear Hobbing Optimization |
|---|---|---|
| Initialization | Generate weight vectors and initial population | Defines the trade-off directions among heat, quality, and time |
| Neighborhood setting | Compute Euclidean distances among weight vectors | Encourages local cooperation between similar solutions |
| Ideal point | Track the best value of each objective | Guides solutions toward the Pareto front |
| Subproblem optimization | Crossover and mutation generate a new solution | Explores new hob speed and feed combinations |
| Constraint repair | Project infeasible solutions into the feasible region | Ensures practical gear hobbing parameters |
| Ideal point update | Update each objective minimum | Maintains convergence pressure |
| Neighborhood update | Replace old solutions if scalarized value improves | Spreads solutions along the Pareto front |
| Termination | Stop at maximum iteration or convergence | Outputs optimized process parameters |
For the case study, I used a cylindrical helical gear and a dry gear hobbing machine. The hob speed range was set from 600 to 1500 r/min, and the axial feed range was set from 1 to 4 mm/r. The gear material was 20CrMoH. The workpiece had 52 teeth, normal module 1.95 mm, width 15.55 mm, hob diameter 75 mm, hob flute number 16, and hob start number 1.
| Parameter | Value | Parameter | Value |
|---|---|---|---|
| Gear tooth number | 52 | Hob diameter | 75 mm |
| Normal module | 1.95 mm | Hob installation angle | 24.83 degree |
| Gear width | 15.55 mm | Hob lead angle | -2.17 degree |
| Hob flute number | 16 | Cutting depth | 5.09 mm |
| Hob start number | 1 | Normal pressure angle | 20 degree |
| Maximum workpiece diameter | 150 mm | Maximum spindle speed | 2500 r/min |
| Maximum workpiece module | 4 mm | Maximum worktable speed | 300 r/min |
| Maximum hob shifting distance | 150 mm | Maximum radial motion | 10000 mm/min |
The MOEA/D algorithm produced a Pareto front. I selected the best compromise solution using an entropy-weight TOPSIS method. The selected solution was \(n_h=905\) r/min and \(f_z=1.5\) mm/r. This solution reduced heat generation and quality error while only slightly increasing machining time. I then compared the optimized parameters with typical experience-based parameters, where \(n_h=1050\) r/min and \(f_z=3.5\) mm/r.
| Indicator | Experience-Based Parameters | Optimized Parameters | Change |
|---|---|---|---|
| Hob speed \(n_h\) | 1050 r/min | 905 r/min | Reduced |
| Axial feed \(f_z\) | 3.5 mm/r | 1.5 mm/r | Reduced |
| Heat generation | \(4.28\times10^3\) kJ | \(2.14\times10^3\) kJ | Reduced by 50 percent |
| Quality error | \(8.8\times10^3\) mm | \(1.7\times10^3\) mm | Reduced by 80.68 percent |
| Machining time | 0.21 min | 0.33 min | Increased by 7.2 s |
| Steady thermal deformation | About 44 micrometers | About 14 micrometers | Reduced by about 30 micrometers |
The experimental validation showed that the optimized parameters significantly lowered the steady temperatures of the temperature-sensitive points. The hob spindle front bearing, hob spindle middle bearing, Z2-axis bearing, average hob temperature, and cooling water outlet all reached lower stable temperatures after optimization. The thermal deformation of the worktable spindle was also reduced from about 44 micrometers to about 14 micrometers. These results confirm that optimizing hob speed and axial feed in dry gear hobbing can improve thermal stability without severely sacrificing productivity.
| Temperature-Sensitive Point | Temperature Reduction After Optimization |
|---|---|
| Hob spindle front bearing | 1.8 degrees Celsius |
| Hob spindle middle bearing | 2.6 degrees Celsius |
| Z2-axis bearing | 0.9 degrees Celsius |
| Average hob temperature | 1.8 degrees Celsius |
| Cooling water outlet | 1.7 degrees Celsius |
I also applied the CNN-BiGRU thermal error prediction model to the optimized and original parameter conditions. The prediction results closely matched the measured thermal error. The \(R^2\) values were 0.985 for the original parameters and 0.986 for the optimized parameters. This indicates that the CNN-BiGRU model has strong robustness and generalization ability for thermal error prediction in dry gear hobbing under different process parameters.
| Condition | Prediction Model | \(R^2\) | Thermal Error Behavior |
|---|---|---|---|
| Original parameters | CNN-BiGRU | 0.985 | Steady thermal error about 44 micrometers |
| Optimized parameters | CNN-BiGRU | 0.986 | Steady thermal error about 14 micrometers |
6. Discussion
My results show that the thermal problem in dry gear hobbing is not isolated. It is connected to machine structure, drive configuration, cooling strategy, process parameters, and data analysis. The multi-information fusion test system provides a reliable foundation because it captures temperature and deformation data under real gear hobbing conditions. The thermal characteristic analysis reveals where heat is generated and how it is transferred. The CNN-BiGRU prediction method captures the nonlinear and lagging relationship between temperature and thermal error. The MOEA/D optimization method then identifies process parameters that reduce heat and thermal deformation while maintaining acceptable gear hobbing efficiency.
Several findings are particularly important. First, the hob and hob spindle bearings are major thermal sources in dry gear hobbing. Their temperatures rise quickly and influence the worktable spindle thermal error. Second, the cooling water and lubricating oil circuits remove part of the heat, but they cannot fully eliminate local hot spots in the cutting zone. Third, the temperature-sensitive points T1, T2, T5, T9, and T12 are sufficient for thermal error prediction when selected by clustering, correlation analysis, and neural network evaluation. Fourth, the CNN-BiGRU model outperforms BP, LSTM, GRU, and BiGRU models because it combines local feature extraction with bidirectional temporal learning. Fifth, the optimized parameters \(n_h=905\) r/min and \(f_z=1.5\) mm/r provide a better thermal trade-off than the experience-based parameters.
| Research Component | Method | Main Output | Value for Dry Gear Hobbing |
|---|---|---|---|
| Thermal test system | Multi-information fusion, LabVIEW, IPO processing | Denoised temperature and deformation data | Enables reliable thermal monitoring in gear hobbing |
| Thermal characteristic analysis | Energy conversion and heat transfer modeling | Temperature and deformation laws | Explains thermal behavior of dry gear hobbing |
| Temperature-sensitive point selection | K-means, Pearson, BP neural network | T1, T2, T5, T9, T12 | Reduces model inputs and improves prediction efficiency |
| Thermal error prediction | CNN-BiGRU | High-accuracy thermal error curves | Supports compensation and quality control in gear hobbing |
| Multi-objective optimization | MOEA/D and entropy-weight TOPSIS | \(n_h=905\) r/min, \(f_z=1.5\) mm/r | Reduces heat and thermal deformation in gear hobbing |
7. Conclusions
I developed an integrated framework for thermal characteristics analysis and optimization of dry gear hobbing machines. The framework includes a multi-information fusion test system, a thermal behavior analysis method, a CNN-BiGRU thermal error prediction method, and a MOEA/D-based multi-objective optimization method. The main conclusions are as follows.
First, I built a multi-information fusion test system that can acquire temperature and thermal deformation data from a dry gear hobbing machine. The system uses modular hardware, LabVIEW software, and IPO-based data processing. It improves the objectivity, accuracy, and scientific value of thermal data analysis for gear hobbing.
Second, I analyzed the heat generation and heat transfer mechanisms of dry gear hobbing. The heat sources include motor loss, cutting heat, bearing friction, ball screw friction, and guideway friction. The thermal behavior shows rapid heating followed by gradual stabilization. The hob temperature is the highest, and the worktable spindle thermal deformation stabilizes at about 14 micrometers in the tested condition.
Third, I proposed a temperature-sensitive point selection method based on K-means clustering, Pearson correlation analysis, and BP neural network evaluation. The method identified T1, T2, T5, T9, and T12 as the most effective temperature-sensitive points for thermal error prediction in dry gear hobbing.
Fourth, I established a CNN-BiGRU thermal error prediction model. The model uses CNN for local feature extraction and BiGRU for bidirectional temporal dependency learning. It achieved the best prediction performance among the compared models, with the lowest error metrics and the highest \(R^2\) value. The method is suitable for thermal error prediction in dry gear hobbing because it considers both forward and backward thermal information.
Fifth, I proposed a multi-objective optimization method for dry gear hobbing process parameters. The method considers heat generation, gear quality error, and machining time. Using MOEA/D, I obtained an optimized parameter set of \(n_h=905\) r/min and \(f_z=1.5\) mm/r. Experimental validation showed that heat generation and quality error were reduced by 50 percent and 80.68 percent, respectively, with only a 7.2 s increase in machining time. The steady thermal deformation of the worktable spindle decreased by about 30 micrometers. These results confirm that the proposed optimization method can improve the thermal state of dry gear hobbing machines.
8. Future Work
In future work, I plan to extend this research in several directions. One direction is the collaborative optimization of machine structure and cooling system. The thermal behavior of a dry gear hobbing machine depends on structural symmetry, component layout, material properties, and cooling paths. I will investigate thermally symmetric designs, thermal isolation of key functional components, and high-conductivity or low-expansion materials. Another direction is intelligent cooling control. I will study cooling path layout, flow rate control, and adaptive cooling strategies for different gear hobbing conditions. A third direction is the integration of digital twins and edge computing so that thermal error prediction and process optimization can be performed online during gear hobbing. These future efforts should further reduce thermal deformation and improve the accuracy and consistency of dry gear hobbing.