
In this study I focus on the experimental design and analysis of a lifting device used in a rack and pinion gear drilling rig. The rack and pinion gear lifting device is one of the most important subsystems of the rig because it transfers both load and motion during tripping, drilling, and active-pressure operations. Unlike a conventional drawworks-based hoisting system, the rack and pinion gear lifting device uses multiple pinions meshing with fixed racks, and therefore its mechanical behavior depends strongly on tooth load distribution, contact stiffness, tooth root bending, dynamic meshing force, and synchronization among the pinions. I designed static and dynamic experiments, built a physical test setup and a full-scale prototype, and compared experimental measurements with finite element and multibody dynamic simulations. The main objective of my work is to determine whether the rack and pinion gear lifting device satisfies strength requirements and whether it remains stable under representative working conditions.
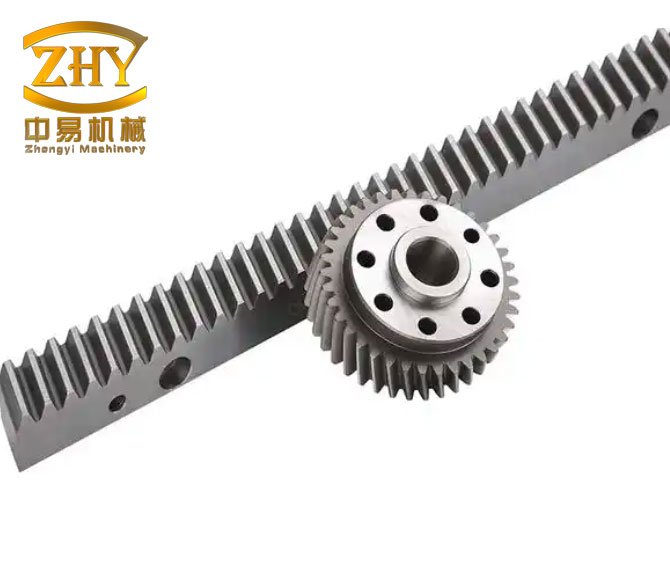
Working context and engineering requirements. The rack and pinion gear drilling rig considered in this study is intended for a nominal drilling depth of about 4000 m. Its maximum hook load is 2500 kN, and its maximum pull-down load is 600 kN. The maximum lifting speed of the pipe string is 1.2 m/s. Because the rack and pinion gear lifting device must frequently start and stop, and because it must operate under low-speed and heavy-load conditions, the design must meet demanding requirements for strength, stiffness, load sharing, and motion stability. I therefore divided the work into four connected parts: theoretical static analysis of the rack and pinion gear pair, theoretical dynamic analysis of the lifting device, static experimental measurement and finite element verification, and dynamic experimental measurement with multibody simulation.
Working conditions used for design and experiment. I selected working conditions according to the expected operating envelope of the rack and pinion gear rig. The conditions include no-load operation, automatic drilling, maximum-speed drilling, and limit hook load. These conditions are summarized in Table 1.
| Condition group | Case | Lifting tonnage (t) | Lifting speed (m/s) |
|---|---|---|---|
| No-load | 1 | 36 | 1.19 |
| Automatic drilling | 1 | 180 | 0.02 |
| 2 | 160 | 0.57 | |
| 3 | 140 | 0.65 | |
| 4 | 120 | 0.76 | |
| 5 | 100 | 0.91 | |
| Maximum-speed drilling | 1 | 76 | 1.19 |
| 2 | 66 | 1.19 | |
| 3 | 56 | 1.19 | |
| 4 | 46 | 1.19 | |
| Limit hook load | 1 | 250 | 0.18 |
| 2 | 220 | 0.41 | |
| 3 | 200 | 0.46 | |
| 4 | 180 | 0.51 |
Configuration of the rack and pinion gear lifting device. The rack and pinion gear lifting device in my study consists of fixed racks mounted on the derrick, climbing pinions installed on the lifting box, and the lifting box itself, which carries the top drive and connects the transmission components. The racks are arranged in a back-to-back configuration. The lifting box contains eight pinions in total, with four pinions on each side. On each side, the four pinions are arranged symmetrically in the vertical and horizontal directions. The racks are fixed to the derrick by bolts and are divided into segments for manufacturing, transportation, and maintenance. Each rack segment includes positioning holes and pins to ensure correct engagement between adjacent segments. The pinions are driven by hydraulic motors through reducers. This arrangement allows the rack and pinion gear lifting device to produce both lifting and pull-down motion, and it also provides better positioning accuracy than a conventional flexible hoisting system.
Material selection and basic parameters. The pinions are made of 20CrMnTi, and the racks are made of 40CrNi2Mo. Both materials are heat treated to obtain high surface hardness and sufficient core toughness. The material properties are listed in Table 2. The basic geometric parameters of the rack and pinion gear pair are listed in Table 3.
| Material | Elastic modulus (N/m²) | Poisson ratio | Density (kg/m³) | Yield strength (MPa) | Tensile strength (MPa) |
|---|---|---|---|---|---|
| 20CrMnTi | 2.12E11 | 0.289 | 7860 | ≥835 | ≥1180 |
| 40CrNi2Mo | 2.11E11 | 0.280 | 7800 | ≥1113 | ≥1265 |
| Parameter | Pinion | Rack |
|---|---|---|
| Module, m (mm) | 20 | 20 |
| Number of teeth, Z | 17 | — |
| Pressure angle, α (°) | 20 | 20 |
| Addendum coefficient, ha* | 1 | 1 |
| Clearance coefficient, c* | 0.25 | 0.25 |
| Face width, b (mm) | 120 | 140 |
| Single segment length, L (mm) | — | 3015 |
| Reference diameter, d (mm) | 340 | — |
Static load analysis of the rack and pinion gear. I began with a rigid-body static analysis of the rack and pinion gear pair. Because the lifting device has eight pinions and the load is assumed to be shared equally among them under ideal conditions, the tangential force on each pinion can be written as
$$F_t = \frac{F_g}{8}$$
where \(F_g\) is the hook load. For the maximum hook load of 2500 kN,
$$F_t = \frac{2500}{8} = 312.5 \text{ kN}.$$
The radial force and the normal meshing force of the rack and pinion gear pair are
$$F_n = F_t \tan \alpha$$
and
$$F = \frac{F_t}{\cos \alpha}.$$
With \(\alpha = 20^\circ\), I obtained
$$F_n = 312.5 \tan 20^\circ = 113.74 \text{ kN},$$
$$F = \frac{312.5}{\cos 20^\circ} = 332.56 \text{ kN}.$$
The torque on each pinion is therefore
$$M_g = F R = 332.56 \times 0.17 = 56.53 \text{ kN}\cdot\text{m}.$$
This calculation provides the nominal load level for the rack and pinion gear pair and establishes the basis for the experimental loading scheme.
Load sharing and load distribution. In a real rack and pinion gear pair, the load is not necessarily shared equally between mating teeth or between different pinions. For two pairs of teeth in contact, the normal load per unit face width can be represented as
$$p_{ni} = \frac{c_i p_n}{c_{\Sigma 2}},$$
where \(c_i\) is the stiffness of the \(i\)-th tooth pair and \(c_{\Sigma 2}\) is the combined stiffness. When a base pitch error \(\Delta\) is considered, the load sharing becomes
$$
\begin{cases}
p_{n1} = \frac{c_1}{c_1+c_2}(p_n + c_2 \Delta),\\
p_{n2} = \frac{c_2}{c_1+c_2}(p_n – c_1 \Delta).
\end{cases}
$$
To describe the non-uniform load distribution along the face width, I used the face load distribution factor
$$K_{F\beta} = \frac{p_{n\max}}{p_{np}},$$
where \(p_{n\max}\) is the maximum load and \(p_{np}\) is the average load. This factor is important for the rack and pinion gear because the rack is long and the lifting box may experience small angular misalignments during motion.
Dangerous loading points on the rack and pinion gear. For strength analysis, the critical stress usually occurs in the single-tooth contact region. The positions of the inner and outer points of the single-tooth contact region on the rack can be expressed as
$$h_{k1} = (2 h_a^* + c^*)m – \pi m(\varepsilon_\alpha – 1)\sin\alpha’,$$
$$h_{k2} = (2 h_a^* + c^*)m – \pi m \varepsilon_\alpha \sin\alpha’.$$
In my finite element analysis, I found that the maximum tooth root bending stress of the pinion is generally larger than that of the rack. The most severe condition appears when the rack and pinion gear pair is close to the outer point of the single-tooth contact region. I therefore used this position to guide the placement of strain gauges in the static experiment.
Contact and bending stress formulas. To estimate the static strength of the rack and pinion gear, I used standard gear load capacity formulas. The contact stress is
$$\sigma_H = Z_B Z_H Z_E Z_\varepsilon Z_\beta \sqrt{\frac{2T}{\phi_d d_1^3}\cdot\frac{u\pm1}{u}\cdot\sqrt{K_A K_V K_{H\alpha}K_{H\beta}}}.$$
The bending stress is
$$\sigma_F = \frac{2T}{\phi_d Z^2}\cdot\frac{Y_F Y_S Y_\varepsilon}{m^3} K_A K_V K_{F\alpha}K_{F\beta}.$$
The zone factor and elasticity factor are
$$Z_H = \sqrt{\frac{2}{\cos^2\alpha \tan\alpha’}},$$
$$Z_E = \sqrt{\left[\pi\left(\frac{1-\mu_1^2}{E_1}+\frac{1-\mu_2^2}{E_2}\right)\right]^{-1}}.$$
Using the parameters of the rack and pinion gear pair, I obtained \(\sigma_H = 1349.82\) MPa and \(\sigma_F = 526.506\) MPa. These values indicate that the rack and pinion gear must be carefully checked because the contact stress is relatively high under maximum load.
Dynamic model of the rack and pinion gear pair. The dynamic behavior of the rack and pinion gear lifting device is governed by meshing stiffness, transmission error, meshing impact, and the coupling among multiple pinions and racks. I represented the meshing deformation of the \(i\)-th tooth pair as
$$\delta_i = r\theta – s – e_i,$$
where \(r\) is the base circle radius, \(\theta\) is the pinion rotation angle, \(s\) is the rack displacement, and \(e_i\) is the tooth profile error. The profile error is
$$e_i = e_{i1} + e_{i2},$$
where \(e_{i1}\) and \(e_{i2}\) are the profile errors of the pinion and the rack. Including meshing damping, the dynamic normal meshing force can be written as
$$F = \sum_i \left(k_v \delta_i + c_v \dot{\delta}_i\right) = \sum_i \left[k_v(r\theta – s – e_i) + c_{vi}(r\dot{\theta} – \dot{s} – \dot{e}_i)\right].$$
The mechanical equilibrium equations of the rack and pinion gear pair are
$$
\begin{cases}
J\ddot{\theta} = T – rF,\\
m\ddot{s} = -G + F\cos\alpha.
\end{cases}
$$
Substituting the meshing force expression gives
$$
\begin{cases}
J\ddot{\theta} + r\sum_i \left[k_v(r\theta – s – e_i) + c_v(r\dot{\theta} – \dot{s} – \dot{e}_i)\right] = T,\\
m\ddot{s} – \cos\alpha \sum_i \left[k_v(r\theta – s – e_i) + c_v(r\dot{\theta} – \dot{s} – \dot{e}_i)\right] = -G.
\end{cases}
$$
This model is the basis for my multibody dynamic simulation of the rack and pinion gear lifting device.
System energy and Lagrange formulation. For the complete lifting device, I treated the eight pinions as rigid bodies in plane motion, the lifting box as an elastic body, and other internal components as moving masses. The total kinetic energy can be expressed as
$$T = \sum_{i=1}^{8}\left[\frac{1}{2}J_i \dot{\theta}_i^2 + \frac{1}{2}m_i \dot{x}_i^2\right] + \frac{1}{6}m_j(\dot{x}_1^2 + \dot{x}_1\dot{x}_2 + \dot{x}_2^2) + \sum_{k=1}^{n}\frac{1}{2}m_k \dot{x}_k^2.$$
The elastic potential energy of the rack and pinion gear meshing is
$$V_m = \sum_{i=1}^{8}\frac{1}{2}k_i(r\theta – x – e_i)^2.$$
The gravitational potential energy and the elastic potential energy of the lifting box are
$$V_g = \sum m_s g x_s,$$
$$V_b = \frac{1}{2}k_j(x_1 – x_2)^2.$$
The work done by non-conservative damping forces is
$$W = -\sum_{i=1}^{8}\int c_i(\dot{r}\theta – \dot{x} – \dot{e}_i)(r\theta – x – e_i)dt.$$
Applying the Lagrange equation,
$$\frac{d}{dt}\left(\frac{\partial T}{\partial \dot{q}_1}\right) – \frac{\partial T}{\partial q_1} + \frac{\partial V’}{\partial q_1} + \frac{\partial W}{\partial q_1} = Q_1,$$
I obtained the motion differential equations of the rack and pinion gear lifting device. These equations were later used to interpret the dynamic simulation results.
Static experimental design. The purpose of the static experiment was to measure the actual internal force and stress state of the rack and pinion gear under different static loads and to verify the finite element model. I built a test setup consisting of a test frame, a base, the lifting device, a test cylinder, a brake system, a hydraulic station, a test anchor, and a stress measurement system. The test cylinder applied a downward pull to simulate the hook load. The brake system allowed the lifting box to remain stationary during static loading. The stress measurement system included resistance strain gauges, bridge boxes, a static strain indicator, a data collector, and a computer.
Measurement principle. I used the electrical resistance strain measurement method. When the rack and pinion gear is loaded, the surface strain changes the resistance of the strain gauge. The relationship between resistance change and strain is
$$\frac{dR}{R} = K\frac{dL}{L} = K\varepsilon,$$
where \(K\) is the gauge factor. For a uniaxial stress state,
$$\sigma = E\varepsilon.$$
For a plane stress state, the stresses are
$$
\begin{cases}
\sigma_x = \frac{E}{1-\mu^2}(\varepsilon_x + \mu\varepsilon_y),\\
\sigma_y = \frac{E}{1-\mu^2}(\varepsilon_y + \mu\varepsilon_x),\\
\tau_{xy} = G\gamma_{xy}.
\end{cases}
$$
The principal stresses are
$$\sigma_{\max} = \frac{\sigma_x+\sigma_y}{2} + \sqrt{\left(\frac{\sigma_x-\sigma_y}{2}\right)^2 + \tau_{xy}^2},$$
$$\sigma_{\min} = \frac{\sigma_x+\sigma_y}{2} – \sqrt{\left(\frac{\sigma_x-\sigma_y}{2}\right)^2 + \tau_{xy}^2}.$$
The equivalent stress based on the von Mises criterion is
$$\sigma_{r4} = \sqrt{\frac{1}{2}\left[(\sigma_1-\sigma_2)^2 + (\sigma_2-\sigma_3)^2 + (\sigma_3-\sigma_1)^2\right]}.$$
Strain gauge selection and installation. I selected BE120-4AA uniaxial strain gauges with a resistance of \(120.2 \pm 0.1\) Ω and a gauge factor of \(2.18 \pm 0.01\). The installation process included surface grinding, cleaning, adhesive bonding, lead wire fixing, soldering, and protective coating. I placed the gauges near the tooth root of the pinion, close to the expected maximum bending stress region. Because the pinion and rack dimensions limited direct access to the exact maximum stress point, I placed the gauges on the end face near the tooth root of the outer pinions. Each measuring point contained two perpendicular strain gauges. I also installed backup gauges on other teeth to reduce the risk of data loss.
Loading scheme. The static experiment used an equal-increment loading method. The initial load was 500 kN, the final load was 2500 kN, and the load increment was 500 kN. Thus, the test had five load levels. The actual loads recorded during the experiment were slightly different from the nominal loads because of hydraulic pressure fluctuations. The load levels are listed in Table 4.
| Nominal load (kN) | Actual load, first run (kN) | Actual load, second run (kN) | Actual load, third run (kN) |
|---|---|---|---|
| 500 | 1050 | 1050 | 1050 |
| 1000 | 1500 | 1500 | 1500 |
| 1500 | 2075 | 2075 | 2075 |
| 2000 | 2500 | 2500 | 2500 |
| 2500 | 2500 | 2500 | 2500 |
Static experimental results under normal load. I measured the strain at two measuring points on two pinions on the same rack. Each point had two perpendicular gauges. After averaging three repeated measurements, I converted the strain values to stress using the elastic modulus of the pinion material. The measured stresses are listed in Table 5.
| Actual load (kN) | Gauge 1-1 stress (MPa) | Gauge 1-2 stress (MPa) | Gauge 2-1 stress (MPa) | Gauge 2-2 stress (MPa) |
|---|---|---|---|---|
| 1050 | 5.77 | -20.28 | 5.84 | -19.36 |
| 1500 | 7.24 | -23.86 | 7.07 | -21.34 |
| 2075 | 9.48 | -26.76 | 8.71 | -24.54 |
| 2500 | 9.73 | -26.24 | 8.33 | -22.01 |
The results show that the stress increases approximately linearly with load from 1050 kN to 2075 kN. The tangential direction stress is tensile, while the perpendicular direction stress is compressive. The two pinions on the same rack show similar stress magnitudes, which indicates that the rack and pinion gear load sharing is reasonably uniform under normal static conditions. At the highest load level, the lifting device moved slightly because the clutch pressure was insufficient. Therefore, the 2500 kN data point is less reliable than the lower-load data points.
Static experimental results under gear failure. I also simulated a special condition in which two pinions were released by cutting off the clutch air supply. In this condition, the load was carried by the remaining six pinions. I measured the strain at the same locations. The results are listed in Table 6.
| Actual load (kN) | Gauge 1-1 stress (MPa) | Gauge 1-2 stress (MPa) | Gauge 2-1 stress (MPa) | Gauge 2-2 stress (MPa) |
|---|---|---|---|---|
| 550 | 2.56 | -1.39 | 20.18 | -17.63 |
| 1000 | 5.95 | -1.80 | 29.59 | -26.70 |
| 1567 | 7.38 | -2.30 | 41.21 | -37.50 |
When one pinion on a rack was released, the stress on the failed pinion decreased significantly. However, the stress did not fall to zero because the pinion still had self-weight and some contact with the rack. The stress on the remaining pinion on the same rack increased considerably. This is because the total load was redistributed from eight pinions to six pinions. This result confirms that a rack and pinion gear failure changes the load sharing among the remaining pinions and increases the risk of overload.
Finite element model of the rack and pinion gear lifting device. I built a finite element model of the complete lifting device to simulate the static experiment and to perform strength verification. The model included the lifting box, eight pinions, four racks, and part of the derrick legs. I simplified internal pipelines and hydraulic components that do not significantly affect global stiffness. The constraints and loads were defined as follows: the gear inner surfaces were constrained to rotate about their axes, a torque of 56 kN·m was applied to each pinion, and downward hook loads of 1050 kN, 1500 kN, and 2075 kN were applied to the lifting box. The bottom of the derrick was fully constrained, and the racks were bonded to the derrick. The simulation model therefore represented the same load path as the static experiment.
Comparison between experimental and simulated stresses. I extracted the simulated stresses at the same locations as the strain gauges and compared them with the measured stresses. The comparison is listed in Table 7. The relative error is defined as
$$\text{Relative error} = \frac{|\sigma_{\text{exp}} – \sigma_{\text{sim}}|}{\sigma_{\text{sim}}} \times 100\%.$$
| Load (kN) | Experimental tangential stress (MPa) | Simulated tangential stress (MPa) | Experimental perpendicular stress (MPa) | Simulated perpendicular stress (MPa) | Tangential error | Perpendicular error |
|---|---|---|---|---|---|---|
| 1050 | 5.77 | 6.39 | -20.28 | -13.17 | 9.64% | 43.16% |
| 1500 | 7.24 | 10.07 | -23.86 | -17.75 | 28.11% | 34.45% |
| 2075 | 9.48 | 13.75 | -26.76 | -22.33 | 31.07% | 19.86% |
The experimental and simulated stresses follow similar trends with increasing load. The simulated stresses are generally larger than the experimental stresses, which means that the finite element model is conservative for strength assessment. The differences are caused by several factors: the actual meshing position may differ slightly from the assumed position, the hydraulic load is not perfectly constant, and the real boundary conditions are not as ideal as those in the finite element model. Despite these differences, the comparison supports the validity of the finite element model for engineering strength evaluation of the rack and pinion gear lifting device.
Strength assessment of the rack and pinion gear. Using the verified finite element model, I calculated the maximum von Mises stresses in the pinions and racks under normal load and under a two-pinion failure condition. The results are listed in Table 8. Under the maximum design load of 2500 kN, the maximum von Mises stress of the pinions is 744.38 MPa, which is below the yield strength of 20CrMnTi. The maximum von Mises stress of the racks is 575.01 MPa, which is below the yield strength of 40CrNi2Mo. Under the two-pinion failure condition, the maximum pinion stress increases to 823.02 MPa, but it still remains below the yield strength. I therefore concluded that the rack and pinion gear lifting device satisfies the static strength requirement. The results also show that the eight-pinion arrangement reduces the load on each individual rack and pinion gear and improves the overall safety margin.
| Component | Maximum stress, normal load (MPa) | Maximum stress, two-pinion failure (MPa) | Yield strength (MPa) | Assessment |
|---|---|---|---|---|
| Pinion 1 | 737.43 | 811.12 | ≥835 | Safe |
| Pinion 2 | 743.46 | — | ≥835 | Safe |
| Pinion 3 | 728.75 | 816.54 | ≥835 | Safe |
| Pinion 4 | 751.14 | 817.15 | ≥835 | Safe |
| Pinion 5 | 727.16 | — | ≥835 | Safe |
| Pinion 6 | 715.71 | 816.70 | ≥835 | Safe |
| Pinion 7 | 721.55 | 814.35 | ≥835 | Safe |
| Pinion 8 | 744.38 | 823.02 | ≥835 | Safe |
| Rack 1 | 538.10 | 609.10 | ≥1113 | Safe |
| Rack 2 | 547.65 | 603.51 | ≥1113 | Safe |
| Rack 3 | 549.28 | 610.82 | ≥1113 | Safe |
| Rack 4 | 575.01 | 611.54 | ≥1113 | Safe |
Dynamic experimental design. The dynamic performance of the rack and pinion gear lifting device determines whether the rig can operate smoothly and safely. I designed a dynamic experiment to measure the vibration response of the pinions and the spatial attitude of the lifting box. The original plan was to measure dynamic strain on all eight pinions under different loads, speeds, and pinion failure conditions. However, because the prototype was not fully commissioned, only no-load operation at limited speeds could be tested. I therefore focused on attitude measurement of the lifting box as the primary dynamic experimental quantity.
Attitude measurement of the lifting box. I used a ten-axis Bluetooth attitude sensor and its companion software to measure the spatial attitude of the lifting box. The sensor was mounted on a smooth, flat surface of the lifting box. I aligned the sensor z-axis with the vertical direction and the x-axis with the opening direction of the lifting box as closely as possible. Before measurement, I calibrated the accelerometer and configured the communication and sampling parameters. During the test, I recorded the angular changes about the x and y axes while the lifting box moved upward and downward. These angles reflect the dynamic stability of the rack and pinion gear lifting device.
Attitude measurement results. The maximum lifting speed achieved by the prototype was 0.28 m/s. The maximum lowering speed reached 1 m/s. The measured attitude angles are summarized in Table 9. At a lifting speed of 0.28 m/s, the maximum angular change about the x-axis was 0.099°, and the maximum angular change about the y-axis was 0.07°. At a lowering speed of 1 m/s, the maximum angular change about the x-axis was 0.171°, and the maximum angular change about the y-axis was 0.275°. All angles were below 1°, which indicates that the rack and pinion gear lifting device operates smoothly under the tested conditions. The attitude changes during lowering were slightly larger than those during lifting, which suggests that the load distribution and synchronization of the eight pinions may be influenced by the lifting direction and speed.
| Motion state | Speed (m/s) | Maximum x-axis angle (°) | Maximum y-axis angle (°) | Observed stability |
|---|---|---|---|---|
| Lifting | 0.28 | 0.099 | 0.070 | Very stable |
| Lowering | 1.00 | 0.171 | 0.275 | Stable |
Multibody dynamic simulation. I used ADAMS to simulate the dynamic behavior of the rack and pinion gear lifting device. The geometric model was simplified by removing reducers, motors, guardrails, and roller assemblies, while retaining the lifting box, pinions, racks, and stiffening plates. A 10 m rack section was used to support the meshing analysis. Fixed constraints were applied to the racks, revolute joints were applied to the pinions, and a translational joint was applied to the lifting box. A 0.5 s acceleration period was used to bring the pinions from rest to the specified speed. The contact force was defined using the IMPACT model. The key contact parameters are listed in Table 10.
| Parameter | Value |
|---|---|
| Stiffness coefficient | 2.1008E8 |
| Force exponent | 1.5 |
| Damping coefficient | 1% of stiffness |
| Penetration depth | 0.1 mm |
| Friction coefficient | 0.05 |
Comparison between dynamic experiment and simulation. I simulated the no-load condition at a lifting speed of 0.28 m/s and a lowering speed of 1 m/s. The simulated meshing force curves showed that the eight pinions had similar meshing force variation patterns. However, in the lowering condition at 1 m/s, small time differences appeared in the meshing force peaks among the pinions. The average meshing forces are compared in Table 11. For the lifting condition, the meshing forces were close to the theoretical value of 47.9 kN per pinion. For the lowering condition, the two lowest pinions showed higher meshing forces than the theoretical value, indicating a less uniform load distribution. These simulation results are consistent with the attitude experiment, in which the lowering condition produced larger attitude angle changes. The agreement supports the validity of the dynamic model of the rack and pinion gear lifting device.
| Pinion number | Average meshing force, lifting at 0.28 m/s (kN) | Average meshing force, lowering at 1 m/s (kN) | Theoretical value (kN) |
|---|---|---|---|
| 1 | 46.2 | 52.4 | 47.9 |
| 2 | 46.2 | 51.8 | 47.9 |
| 3 | 50.8 | 49.5 | 47.9 |
| 4 | 50.8 | 54.2 | 47.9 |
| 5 | 50.1 | 56.1 | 47.9 |
| 6 | 50.1 | 55.7 | 47.9 |
| 7 | 54.9 | 57.3 | 47.9 |
| 8 | 54.9 | 58.0 | 47.9 |
Influence of lifting state. To study the influence of the lifting state, I compared the meshing forces during lifting and lowering at a speed of 1 m/s and a load of 360 kN. The total meshing force during lifting was larger than that during lowering because the self-weight of the lifting device opposes upward motion. The lowering condition showed more noticeable peak time differences and a less uniform load distribution among the pinions. Therefore, the lowering state has a slightly negative effect on motion synchronization and load sharing. This finding agrees with the attitude experiment, where the lowering process produced larger angular changes.
Influence of lifting speed. I compared lifting speeds of 1.2 m/s, 1 m/s, and 0.28 m/s under a load of 360 kN. The meshing force variation patterns were almost identical for all three speeds. The average meshing forces remained close to the theoretical value, which indicates that lifting speed does not significantly affect load sharing or synchronization. However, the maximum meshing force increased slightly with speed because the collision velocity between the pinion and rack increases the momentum change and impulse. Therefore, speed has little effect on stability but should be considered in strength assessment.
Influence of pull-down load. I compared pull-down loads of 2500 kN, 1400 kN, and 360 kN at a lifting speed of 1 m/s. The meshing force curves had the same general form for all three loads. The average meshing forces were close to the corresponding theoretical values of 332.6 kN, 186.2 kN, and 47.9 kN per pinion. This confirms that the rack and pinion gear lifting device distributes the load uniformly over a wide load range. Pull-down load therefore does not reduce the dynamic stability of the lifting device under normal conditions.
Influence of pinion failure. I simulated two failure cases: upper and lower diagonal pinions released, and upper diagonal pinions released. In both cases, the failed pinions carried almost no meshing force, and the remaining six pinions shared the load. The average meshing forces on the remaining pinions were close to the theoretical value of 443.4 kN for six-pinion operation. The meshing force curves retained the same fluctuation pattern as in the normal condition. Therefore, a two-pinion failure does not significantly reduce the motion stability of the rack and pinion gear lifting device, but it does increase the meshing force on each remaining pinion and creates a strength safety concern. The load distribution and motion synchronization results are summarized in Table 12.
| Influence factor | Effect on load sharing | Effect on motion synchronization | Effect on strength | Overall assessment |
|---|---|---|---|---|
| Lifting state | Slight effect | Slight effect | Moderate effect | Lowering is less stable |
| Lifting speed | Negligible | Negligible | Maximum force increases with speed | Stable but check strength |
| Pull-down load | Negligible | Negligible | Proportional increase | Stable under normal load |
| Two-pinion failure | Redistribution to six pinions | Negligible | Higher force per pinion | Stable but safety margin reduced |
Discussion of experimental error. The static and dynamic experiments inevitably contained errors from instrument accuracy, hydraulic pressure fluctuations, strain gauge installation, boundary conditions, and environmental effects. I used repeated measurements and averaging to reduce random errors. The relative error between the experimental and simulated stresses reached about 40% at some points, but the trends were consistent, and the simulated stresses were generally conservative. The main sources of error were the difference between the actual and assumed meshing position, the difference between the actual and nominal loads, and the difference between real constraints and ideal finite element constraints. These errors do not change the main conclusion that the rack and pinion gear lifting device has sufficient strength and acceptable dynamic stability.
Engineering significance. My experimental and numerical results show that the eight-pinion, four-rack lifting device provides a favorable load path for a rack and pinion gear drilling rig. The multiple rack and pinion gear pairs reduce the load per tooth, improve redundancy, and allow continued operation after a limited pinion failure. The static experiment confirmed that the rack and pinion gear tooth root stress increases with load and that load redistribution occurs when a pinion fails. The dynamic experiment and simulation showed that the lifting box remains stable, with attitude changes below 1°, and that the lowering state has a slightly larger effect on synchronization than the lifting state. These findings are useful for the design, condition monitoring, and maintenance of rack and pinion gear lifting devices in drilling rigs.
Conclusions. I designed and analyzed static and dynamic experiments for a rack and pinion gear lifting device used in a drilling rig. The main conclusions are as follows. First, the theoretical static analysis and finite element simulation showed that the maximum von Mises stress in the pinions and racks remains below the material yield strength under the maximum design load, so the rack and pinion gear lifting device satisfies the strength requirement. Second, the static experiment confirmed that tooth root stress increases with load and that a pinion failure causes significant load redistribution to the remaining pinions. Third, the attitude measurement experiment showed that the lifting box remains nearly level during motion, with angular changes below 1° at the tested speeds. Fourth, the multibody dynamic simulation showed that lifting speed and pull-down load have little effect on load sharing and synchronization, while the lowering state has a small influence. Fifth, a two-pinion failure does not seriously affect dynamic stability, but it reduces the strength safety margin because the remaining six pinions must carry the full load. Overall, the rack and pinion gear lifting device is mechanically reliable under the tested conditions, and the combination of static experiments, dynamic experiments, finite element analysis, and multibody simulation provides a strong basis for its design verification.