
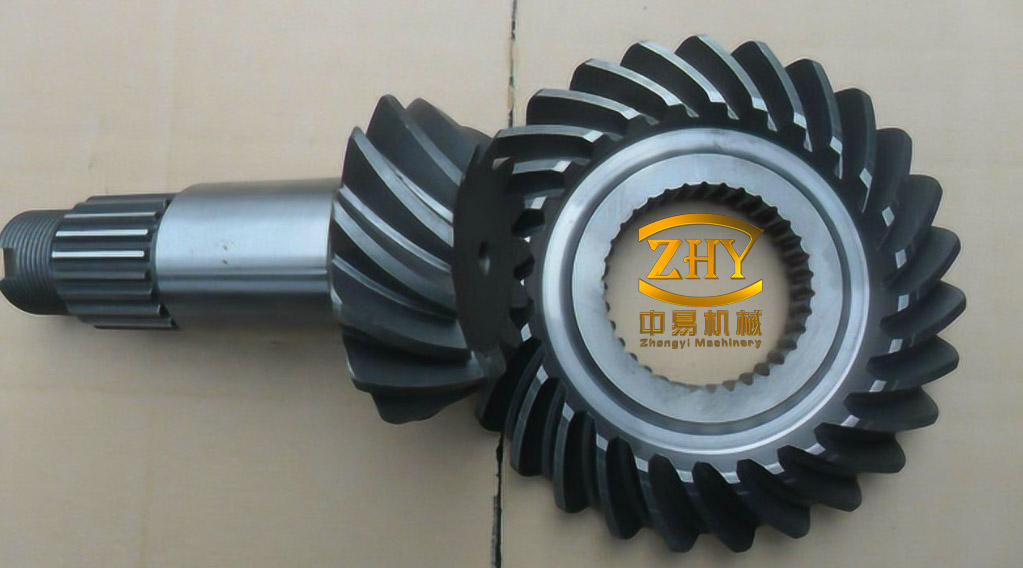
A central transmission spiral bevel gear in an aeroengine operates under a combination of high speed, high torque, and limited mass. The thin web that carries the gear teeth is deliberately flexible in the axial direction, which is favorable for weight but unfavorable for dynamic stability. When a nodal-diameter mode of the web coincides with the mesh excitation, the gear can enter traveling-wave resonance. The resulting alternating stress is not confined to the tooth contact; it can be concentrated at the small-end fillet and in the web, where a small manufacturing or service defect may grow into a block fracture.
The engineering problem is therefore not only to predict when resonance occurs, but also to interpret how the resonance signature changes once a crack starts to grow. A crack reduces local stiffness, breaks the axial symmetry of the web, and separates modal pairs that are otherwise nearly degenerate. Acoustic measurement through a waveguide can track the resonance peak without contacting the rotating part, making it possible to follow the transition from a stable resonance to a split, unstable response and finally to sudden fracture.
1. Traveling-wave resonance in a rotating gear web
Axial bending modes of a gear web are classified by their nodal circles and nodal diameters. A mode with m nodal diameters has m diameters along which the axial displacement remains zero. For a stationary gear, the two orthogonal forms of an m-diameter mode have the same natural frequency f and can be represented as forward and backward waves of equal wavelength. When the gear rotates at n r/min, the observed frequencies separate:
\[
f’_f=f+\frac{mn}{60},\qquad f’_b=f-\frac{mn}{60}
\]
where \(f’_f\) is the forward-wave frequency and \(f’_b\) is the backward-wave frequency in the stationary frame. The mesh excitation frequency for a gear with \(z\) teeth is
\[
f_e=\frac{zn}{60}
\]
Resonance occurs when the excitation frequency equals one of the traveling-wave frequencies. For the forward branch,
\[
\frac{zn}{60}=f+\frac{mn}{60}
\]
and for the backward branch,
\[
\frac{zn}{60}=f-\frac{mn}{60}
\]
The corresponding resonance speeds and frequencies are
\[
n_f=\frac{60f}{z-m},\qquad n_b=\frac{60f}{z+m}
\]
\[
f_f=f+\frac{mf}{z-m},\qquad f_b=f-\frac{mf}{z+m}
\]
These relations show why a thin-web spiral bevel gear can encounter more than one dangerous operating point. In the present gear pair, the three-nodal-diameter (3ND) forward branch and the four-nodal-diameter (4ND) backward branch fell within the test speed range. For an undamaged gear, the two symmetric forms of each branch are close in frequency, so a single acoustic peak can be tracked by adjusting speed. Once a crack grows, this single-peak picture is no longer valid.
2. Bench measurement and resonance tracking
The test article was an aeroengine central-drive spiral bevel gear pair with a driven gear tooth count \(z_2=47\) and a pinion tooth count \(z_1=35\). The driven-gear speed \(n_2\) was used as the reference speed, so the mesh excitation was \(f_e=z_2 n_2/60\). Two rigid-wall acoustic waveguides, each 1,000 mm long, were inserted through the gearbox side plate. The probe openings were about 10 mm above the small-end web of the driven gear. Measurement point 1 was projected 38 mm from the gear center; point 2 was at the same radius and separated by 45°. The signals were acquired with an LMS SCADAS-III system together with a speed sensor.
A free-modal impact test was first used to estimate the static natural frequencies of the driven gear. The measured static values, together with the forward/backward branch relations, predicted the resonance windows listed in Table 1. The actual peaks were then located acoustically by slowly adjusting speed. The measured 3ND forward peak appeared at 11,145 r/min and 8,730 Hz; the measured 4ND backward peak appeared at 15,288 r/min and 11,975 Hz. The small differences from prediction are consistent with the use of static modal data as an approximation to the rotating dynamic frequency.
| Resonance branch | Predicted \(n_2\) / (r/min) | Predicted frequency / Hz | Measured \(n_2\) / (r/min) | Measured frequency / Hz | Frequency deviation |
|---|---|---|---|---|---|
| 3ND forward | 11,036 | 8,645 | 11,145 | 8,730 | +0.98% |
| 4ND backward | 15,283 | 11,972 | 15,288 | 11,975 | +0.03% |
In the undamaged condition, the 3ND and 4ND branches were each tracked as a stable resonance. Speed control was sufficient to keep the excitation on the peak, and the acoustic spectrum showed a clear dominant line at the predicted branch frequency. This stability is the basis of the fatigue test: the gear can be held at resonance for a long period while the acoustic signal is monitored for changes in frequency and amplitude.
3. Baseline fatigue versus pre-cracked fatigue
The defect-free gear was first run at the 3ND forward resonance for 2.6 h and at the 4ND backward resonance for 128 min. Both runs exceeded the fatigue design qualification requirement for this gear. After the tests, inspection found no crack. Under these bench conditions, traveling-wave resonance alone was not sufficient to produce fracture in a sound gear.
The crack-growth tests used a starter notch at the small-end convex fillet, with a depth of 0.6 mm and a width of 0.27 mm. Modal stress analysis had identified this fillet as the high-stress site. The normalized maximum-to-reference stress ratio was 10.33 for the 3ND mode and 33.74 for the 4ND mode; the difference reflects the different axial stress distribution of the two nodal-diameter patterns. In the finite-element model, the initial notch was represented by a crack length \(L=1.84\) mm, depth \(H=0.6\) mm, and width 0.27 mm.
The pre-cracked gears failed by block fracture. In the 3ND forward test, the fractured block contained eight full teeth and two half teeth. In the 4ND backward test, the block contained twelve full teeth. In both cases the main crack started at the starter notch and followed two directions: from the small end toward the web, through the shaft bore or lightening holes, and then to another tooth root; and from the small end along the tooth slot toward the large end. These paths are consistent with a crack driven by a web-bending mode rather than by tooth-root bending alone.
The acoustic signal changed well before the final fracture. In the 3ND forward run, the dominant peak began at 8,730 Hz with a peak pressure of 333.1 Pa; the second harmonic at 17,460 Hz was 74.9 Pa. As the crack advanced, the main peak remained near 8,730 Hz but fell to 263.7 Pa and then 236.8 Pa, while the second harmonic fell to 42.0 Pa and then 32.6 Pa. In the mid-to-late stage, a second 3ND peak appeared near 7,231 Hz and the main peak shifted to 8,720 Hz; the corresponding pressures fell to 158 Pa and 51.7 Pa. In the late stage, the main peak was at 8,720 Hz with 55.1 Pa and the companion peak near 7,224 Hz with 30.8 Pa. After this point, the resonance point could no longer be tracked and the gear fractured suddenly.
In the 4ND backward run, the main peak began at 11,985 Hz with 159.3 Pa, and a characteristic spectral line appeared near 8,915 Hz with 85.1 Pa. The main peak pressure fell to 96.3 Pa, then to 51.1 Pa, and finally to 9.2 Pa at 11,930 Hz. The characteristic line near 8.9 kHz also decreased. As in the 3ND case, the last trackable state was followed by loss of the resonance peak and instantaneous fracture.
Two features are important. First, the resonance frequency decreased as the crack grew, which is consistent with a loss of local and global stiffness. Second, the acoustic amplitude fell much more strongly than the frequency in the early stage, and additional peaks appeared. A simple interpretation is that the crack increased structural asymmetry, so the two symmetric forms of the same nodal-diameter mode no longer responded as one stable traveling wave. The gear could not maintain a constant resonance condition, and the speed-tracking loop eventually lost the working point.
4. Modal splitting in the finite-element crack model
A finite-element model of the spiral bevel gear was built with the material properties of carburized gear steel at 200 °C: density 7,860 kg/m³, elastic modulus \(2.1\times10^5\) MPa, and Poisson ratio 0.41. The inner surface of the gear shaft was constrained in the radial and axial directions, with rotation about the shaft axis released. A tetrahedral mesh with a global size of 1.5 mm was used; mesh-independence checks gave convergence at about 600,000 elements. The crack was introduced as an axial slot normal to the web, and its length and depth were advanced through 22 stages for each of the two crack paths, giving 44 crack models in total.
The growth sequence was divided into four zones: P1 (stages 1–7), P2 (stages 7–17), P3 (stages 17–20), and P4 (stages 20–22). In P3, the crack extended mainly along its length while the depth remained at 15.55 mm; in P4, both length and depth increased again. For each model, only the 3ND or 4ND modal family was extracted, depending on the test branch being represented. Table 2 lists selected stages from the two sequences.
| Crack stage | 3ND vibration | 4ND vibration | ||||
|---|---|---|---|---|---|---|
| Mode 1 / Hz | Mode 2 / Hz | Δ / Hz | Mode 1 / Hz | Mode 2 / Hz | Δ / Hz | |
| Normal | 8,026.4 | 8,053.7 | 27.3 | 13,380 | 13,380 | 0 |
| 7 | 7,927.6 | 8,019.9 | 92.3 | 13,193 | 13,339 | 146 |
| 17 | 7,517.3 | 7,862.4 | 345.1 | 12,455 | 13,043 | 588 |
| 21 | 7,426.9 | 7,801.2 | 374.3 | 11,901 | 12,859 | 958 |
| 22 | 7,305.8 | 7,636.7 | 330.9 | 10,866 | 12,517 | 1,651 |
The undamaged 3ND pair already had a 27.3 Hz separation because the three nodal diameters can either pass through or avoid the lightening holes, producing two different axial stiffness states. The undamaged 4ND pair had equal frequencies because four nodal diameters cannot form the same two extreme hole-passing configurations. As the crack grew, both members of each pair decreased in frequency, but they decreased by different amounts. The 3ND separation reached 374.3 Hz at stage 21 and remained large at stage 22; the 4ND separation reached 1,651 Hz at stage 22. The mode shapes also changed from two closely related symmetric forms into two visibly different vibration modes.
This modal splitting explains the acoustic behavior. When the two symmetric modes are no longer degenerate, a rotating excitation can alternately drive one mode and then the other. The response is no longer a single steady traveling wave, and the acoustic spectrum can contain two competing peaks. A controller that follows only one peak may still find a local maximum, but it is no longer holding the gear at the original resonance condition.
5. A frequency-ratio relation for early crack growth
For early crack growth, the shift of the modal frequency is small but systematic. A normalized frequency ratio was defined as
\[
\lambda=\frac{f_i}{f_0}
\]
where \(f_i\) is the modal frequency at a given crack stage and \(f_0\) is the undamaged frequency. For the early stages in which the crack depth and length increased in a fixed proportion, a cubic fit gave
\[
\lambda_{(3)}=-3.457\times10^{-9}L^3-1.963\times10^{-5}L^2+1.115\times10^{-4}L+0.99981
\]
\[
\lambda_{(4)}=-8.279\times10^{-8}L^3-1.514\times10^{-5}L^2+5.574\times10^{-5}L+0.99994
\]
Here \(L\) is the crack length in millimetres, and the subscripts 3 and 4 denote the 3ND and 4ND sequences. The fits apply to the early stage represented by stages 1–7, where the depth-to-length ratio remained approximately constant. They are not intended for the later stage in which the crack extends mainly along the web or when the crack path deviates from the modeled path.
| Quantity | 3ND forward | 4ND backward |
|---|---|---|
| Frequency ratio from tracked end state | 0.99874 | 0.99541 |
| Crack length \(L\) predicted by cubic fit / mm | 10.74 | 18.25 |
| Frequency ratio from finite-element model at fitted \(L\) | 0.99888 | 0.99540 |
| Relative error in frequency ratio | 0.014% | <0.02% |
The validation used the last trackable state of each fatigue test. The measured branch-frequency ratios were 0.99874 for the 3ND case and 0.99541 for the 4ND case. Substituting these values into the cubic fits gave crack lengths of 10.74 mm and 18.25 mm. Rebuilding the finite-element model at those lengths gave frequency ratios of 0.99888 and 0.99540, with relative errors of 0.014% and less than 0.02%, respectively. The agreement supports the use of the frequency ratio as an early-stage crack-size indicator for this gear geometry.
The fitted crack length is a model path length, not a direct measurement of every individual crack front. Post-test sectioning of the fractured parts showed directional crack lengths of 5.82 mm along the web and 4.92 mm along the tooth slot for the 3ND case, and 9.99 mm and 8.26 mm for the 4ND case. These directional values describe the final fracture pattern; the fitted \(L\) represents the equivalent path length used in the modal model. The distinction matters when the relation is applied to inspection data.
6. Failure sequence and engineering implications
The combined acoustic and modal evidence supports a three-stage failure sequence. In the early stage, the crack lies at the high-stress small-end fillet and the gear is held at traveling-wave resonance. The alternating stress at the crack tip is high, and the crack grows in a stable, fatigue-like manner. The modal frequency decreases gradually, and the frequency ratio can be used to estimate the crack length if the local depth-to-length ratio is known.
In the intermediate stage, the crack extends into the web and the structural asymmetry becomes large. The two symmetric forms of the same nodal-diameter mode separate, and the excitation alternately drives the two branches. The acoustic peak broadens, shifts, or splits, and a single-speed tracking loop can no longer maintain the original resonance condition. The drop in peak pressure is not merely a damping effect; it reflects the loss of a coherent traveling-wave response.
In the final stage, the remaining section is too small to carry the resonant load. The crack-tip stress intensity factor is inferred to approach or exceed the fracture toughness of the carburized gear steel, so the crack accelerates and the gear fails by block fracture with little additional fatigue evidence. This inference is consistent with the sudden loss of the acoustic peak and the final fracture pattern, but the present measurements did not determine the stress intensity factor directly.
For condition monitoring, the practical implication is that a downward shift of the resonance frequency is only one indicator. The appearance of a companion peak, a growing separation between two modal branches, and the loss of speed-trackability can occur before a large frequency shift is visible. In these tests, the main 3ND peak moved by only about 10 Hz while its pressure fell from 333.1 Pa to 55.1 Pa; the 4ND peak moved by about 55 Hz while its pressure fell from 159.3 Pa to 9.2 Pa. Monitoring amplitude and spectral splitting alongside frequency therefore gives a more complete view of crack growth than frequency alone.
The frequency-ratio method is useful because it converts a measured resonance shift into an equivalent crack length without requiring a full transient simulation for every inspection. Its applicability is nevertheless bounded. The cubic fits are empirical, geometry-specific, and valid only for the early stage with a fixed depth-to-length ratio. A different spiral bevel gear, a different starter-notch location, or a crack that turns preferentially along the web will change the coefficients. The acoustic tracking also depends on a clean identification of the modal branch; if two branches are close or if the excitation order changes, the measured ratio can be ambiguous.
Within these limits, the spiral bevel gear tests show a consistent picture: traveling-wave resonance provides the cyclic stress that drives early crack growth; crack-induced asymmetry splits the symmetric modal pair and destroys stable resonance tracking; and the final fracture occurs when the remaining section can no longer sustain the crack-tip stress. The evolution from a single resonance peak to a split, weakening spectrum is a physically meaningful precursor of block fracture, and the frequency ratio provides a quantitative bridge between that precursor and early crack size.