
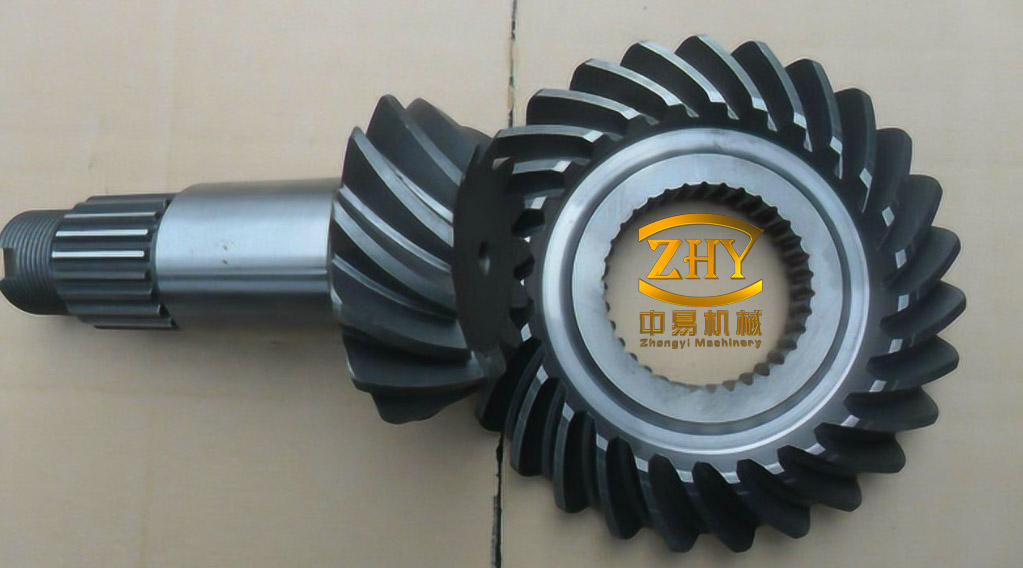
Spiral bevel gears carry the main power path of agricultural harvesters, converting rotation between intersecting shafts in the final drive and the main transmission gearbox. Their teeth are curved, contact is gradual and oblique, and the resulting motion is smooth and load-capable — properties that explain their use wherever a compact right-angle drive must survive high torque. The same properties make them difficult to monitor. A tooth-root crack does not announce itself as a dramatic change in overall vibration level; it appears as a weak, periodic impulse buried under mesh harmonics, bearing noise, and the load fluctuations of field operation. Detecting that impulse early enough to act on it is the technical problem this article addresses.
How a tooth crack appears in the vibration signal
The dominant excitation in a gear pair is the time-varying mesh stiffness. As teeth roll through contact, the number of load-sharing tooth pairs changes, so stiffness — and therefore the force transmitted to the housing — fluctuates periodically at the mesh frequency and its harmonics. A crack at the tooth root reduces the local bending stiffness of that tooth. Each time the damaged tooth enters mesh, the stiffness drops and recovers abruptly, imposing an impulse once per revolution of the damaged wheel. The consequence in the spectrum is a family of sidebands spaced at the shaft rotation frequency around the mesh frequency and its higher harmonics, together with broadband excitation of structural resonances.
Two factors weaken this signature in practice. First, the impulse is modulated by load variation, manufacturing error, and misalignment, so the measured signal is a multi-component amplitude- and frequency-modulated waveform rather than a clean pulse train. Second, the energy of the impulse is small relative to the mesh component. Envelope analysis — demodulating the resonance band — is the standard remedy, but when the raw envelope spectrum is computed directly, the shaft-order line often sits at nearly the same level as neighbouring noise lines, which is exactly what bench measurements of a cracked spiral bevel gear show below.
Wavelet packet decomposition and the basis-selection bottleneck
Wavelet analysis represents a signal with a scaled and translated oscillatory kernel,
$$\psi_{a,b}(t)=\frac{1}{\sqrt{a}}\,\psi\!\left(\frac{t-b}{a}\right),\qquad a>0,\; b\in\mathbb{R}$$
and the discrete transform takes inner products of the target signal with the dilated, shifted kernel. Wavelet packet decomposition extends this by splitting both the low- and high-frequency halves of each band, so a signal can be resolved into $2^{i}$ bands at level $i$ with a uniform time-frequency partition. The coefficient recursion and the reconstruction relation for filters $h_0$ (low-pass) and $h_1$ (high-pass) are
$$d_n^{i,2j}=\sum_l h_{0,l-2n}\,d_l^{i-1,j},\qquad d_n^{i,2j+1}=\sum_l h_{1,l-2n}\,d_l^{i-1,j}$$
$$d_n^{i,j}=\sum_l h_{0,n-2l}\,d_l^{i-1,2j}+\sum_l h_{1,n-2l}\,d_l^{i-1,2j+1}$$
Everything about the decomposition — band boundaries, time localization, and the shape of the atoms used to approximate transients — follows from the chosen basis. Daubechies, symlet, and coiflet families differ in support length, vanishing moments, and regularity; a basis whose atoms resemble a short impulse concentrates impulsive damage information into few coefficients, while a smoother basis smears it across bands. In routine practice the basis and the decomposition depth are fixed in advance from experience, and features are then taken as band energies or as inputs to a classifier. This works when the target signature happens to match the default basis, but it leaves the method without a principled, data-driven criterion for choosing the kernel, which limits its use on signals whose modulation structure is not known a priori.
A lumped-parameter gear model as a physical prior
An alternative to guessing is to generate the expected response from the physics of a cracked tooth and use it as a reference. A six-degree-of-freedom lumped-parameter model of the gear pair provides that reference:
$$M\ddot{\mathbf{x}}+C\dot{\mathbf{x}}+K\mathbf{x}=\mathbf{F}$$
where $M$, $C$, and $K$ are mass, damping, and support stiffness matrices and $\mathbf{F}$ collects the driving and load torques together with the forces induced by tooth contact and friction. The normal contact force and the tangential friction force are written as
$$F=k(t)\gamma_0 e(t)+C_m\gamma_0\dot{e}(t),\qquad F_f=\mu F$$
with $k(t)$ the time-varying mesh stiffness along the line of action, $C_m$ the mesh damping, $\mu$ the friction coefficient, $\gamma_0$ a nonlinear clearance function, and $e(t)=R_{bp}\theta_p-R_{bg}\theta_g+x_p-x_g$ the transmission error built from base-circle radii, angular displacements, and translational displacements of pinion and wheel. The mesh stiffness itself follows from elasticity: the contact compliance is the sum of contributions from tooth bending and shear, foundation flexibility, and Hertzian contact,
$$\frac{1}{k(t)}=\frac{1}{k_{pb}}+\frac{1}{k_{gb}}+\frac{1}{k_{pf}}+\frac{1}{k_{gf}}+\frac{1}{k_h}$$
and damage enters as a periodic perturbation of the healthy stiffness, $k(t)=k_n(t)+\Delta k(h_q,t)$, where $h_q$ encodes crack severity. Light, moderate, and severe crack cases therefore produce different stiffness losses within each mesh cycle, and the resulting impulse amplitude scales with that loss.
Solving the model with a Runge–Kutta scheme for a 37-tooth, 2.5 mm module gear running at 600 r/min yields the expected signature: as damage severity increases, the time response develops growing impulse peaks; a single tooth crack modulates the response at the shaft frequency of 10 Hz, and sidebands of 10 Hz spacing appear around the mesh frequency of 370 Hz (37 teeth × 10 Hz) and its harmonics. The model therefore produces, from physical parameters alone, the same qualitative features that a real crack generates — which is what makes it usable as a basis-selection reference.
| Parameter | Value | Parameter | Value |
|---|---|---|---|
| Number of teeth | 37 | Face width | 20 mm |
| Module | 2.5 mm | Pressure angle | 20° |
| Elastic modulus | 203 GPa | Gear mass | 1.133 kg |
| Mass moment of inertia | 2.813×10⁻³ kg·m² | Support radial stiffness | 6.56×10⁸ N/m |
| Support radial damping | 1.8×10³ N·s/m | Mesh damping coefficient | 67 |
| Friction coefficient | 0.02 | Input speed | 600 r/min |
Turning the model into a basis-selection criterion
The link between the model and the decomposition is the power spectral density recovered from the coefficients. The coefficient magnitude at a given scale measures how closely the local signal segment resembles the basis atom, and orthogonality of the basis gives the band power at frequency $f_n$ as a sum over the coefficients within the corresponding bandwidth. Comparing the model response and the measured signal in the spectral domain, two discrepancy indices are defined:
$$e=\frac{1}{N}\sum_{n=1}^{N}\left|G_M(f_n)-G(f_n)\right|$$
$$\mathrm{RMSe}=\sqrt{\frac{1}{N}\sum_{n=1}^{N}\left[\left|G_M(f_n)-G(f_n)\right|-e\right]^{2}}$$
where $G_M$ and $G$ are the power spectral densities of the physical reference and of the target signal over $N$ frequency bins. The two indices respond differently to basis choice, so they are combined with weights derived from their correlation with one another, and the basis is selected by solving
$$\min \sum_{n=1}^{N} f\!\left(d_n^{(m)},R\right),\qquad f=\frac{1}{R_e}\,e+\frac{1}{R_{\mathrm{RMSe}}}\,\mathrm{RMSe}$$
subject to $d_n^{(m)}\in\{\mathrm{db4},\mathrm{db8},\dots,\mathrm{sym5}\}$. In other words, the admissible kernels form a small candidate set, and the one whose decomposition best reproduces the model’s spectral structure — after the coefficients are corrected accordingly — is adopted for the actual measurement. The procedure adds a modeling stage ahead of the decomposition but removes the arbitrary choice of kernel, which is the step that normally determines whether the damage band separates from the rest.
Bench validation on a cracked spiral bevel gear
The reference and the measurement were brought together on a dedicated test rig: drive motor, coupling, reduction gearbox, torque sensor, magnetic-powder brake, and a data-acquisition chain, with a three-axis accelerometer bonded to the gearbox housing. The test gear carried a wire-cut crack at the tooth root. Vibration was sampled at 10,240 Hz for 3 s with the input shaft at 600 r/min (10 Hz) and a brake load of 4 N·m.
The damaged gear produced a larger overall amplitude than the healthy gear, and its amplitude spectrum showed sidebands around the higher harmonics of the mesh frequency. The envelope spectrum of the raw signal, however, did not isolate the fault: the shaft-order line used as the damage indicator was comparable in amplitude to neighbouring components, so a threshold-based call would have been unreliable.
A three-level decomposition split the signal into eight bands. Band 7 carried the largest share of energy and therefore most of the fault information, but the remaining bands still held non-negligible fractions, meaning the impulse energy was still spread across the partition. After the basis was optimized against the physical reference and the coefficients corrected, the energy redistributed markedly in favour of band 7. The reconstructed band-7 waveform showed clear modulation impulses in the time domain, and its envelope spectrum contained prominent lines at the damaged gear’s rotation frequency of 5 Hz and at its 3rd, 4th, and 5th multiples, all at amplitudes above the shaft-frequency line of the untreated signal. The gain comes from suppressing the mesh modulation and broadband interference while amplifying the once-per-revolution impulse.
Field validation on a Chinese onion harvester
To test whether the bench result was an artefact of a clean laboratory signal, the method was applied to the main transmission gearbox of a Chinese onion harvester during field harvesting. The gearbox has a 2:1 ratio with the driven gear damaged; the accelerometer was mounted above the driven-gear bearing housing; sampling was set to 4,096 Hz for 8 s while the tractor driveline turned at roughly 500 r/min under harvesting load.
| Item | Bench test | Field test |
|---|---|---|
| Object | Single spiral bevel gear pair, wire-cut root crack | Harvester main gearbox, 2:1 ratio, damaged driven gear |
| Transducer location | Gearbox housing, three-axis accelerometer | Above driven-gear bearing seat |
| Sampling rate | 10,240 Hz | 4,096 Hz |
| Record length | 3 s | 8 s |
| Speed / load | 600 r/min input, 4 N·m brake torque | ≈500 r/min driveline, harvesting load |
| Decomposition | 3 levels, 8 bands | 3 levels, 8 bands |
| Dominant band after optimization | Band 7 | Band 6 |
With the physical reference built for the harvester gear pair and the basis optimized accordingly, the corrected reconstruction concentrated energy in band 6. Its time waveform showed the interfering content removed and a visible pulse-modulation pattern. Envelope spectra of the three highest-energy bands (5, 6, and 7) all exhibited large lines at the shaft frequency and its second harmonic, and the shaft-frequency line in band 6 exceeded the corresponding lines in bands 5 and 7 — consistent with the energy ranking. Against the envelope spectrum of the untreated field signal, the improvement in shaft-order visibility is what supports a positive diagnosis of a fault in the main transmission gearbox.
Scope and remaining limitations
The method converts basis selection from an empirical decision into an optimization against a physically generated reference, and the two validation cases — a controlled root crack and an in-service harvester gearbox — show that the resulting decomposition separates the shaft-order fault signature where direct envelope analysis does not. The improvement is attributable to the change in kernel and the associated redistribution of energy, not to any change in the sensing hardware or in the envelope operation itself.
The costs and open issues are equally concrete. A dynamic model must be built for each gear object, since geometry, support stiffness, and load case all enter the reference spectrum; the modeling and optimization stages add computation ahead of what is otherwise a fast transform; and the fidelity of the reference depends on the assumed crack severity function $\Delta k(h_q,t)$, which is a modeling choice rather than a measured quantity. The reported evidence is also limited to qualitative comparisons of band energy, waveform shape, and envelope-line amplitude — no quantitative separation metric, detection threshold, or comparison against alternative basis choices is given, so the margin of benefit over a default db-basis decomposition remains to be established. Addressing model cost and object-to-object transferability would be the natural route to wider deployment on harvester drivetrains.