Compared with spur gear transmission, helical gear transmission has the advantages of stronger load-bearing capacity and smoother transmission process, and is widely used in high-speed and heavy-duty mechanical transmission systems such as wind power, ships, and aerospace. With the significant increase in transmission power of large equipment such as wind turbines and ships, tooth deformation and adhesion problems caused by thermal effects have gradually become one of the main forms of failure in helical gear transmission. At present, scholars at home and abroad have conducted extensive research on the thermal effect of helical gears. Blok obtained a steady-state approximate solution for flash temperature by establishing a one-dimensional simplified equation for the heat flux of two sliding objects. Li Guihua et al. analyzed the deformation of the base circle and tooth profile of involute spur gears under the influence of thermal effects based on heat transfer theory. Long Hui et al. studied the contact stress of spur gears using finite element analysis method in ABAQUS commercial software, and finally solved the steady-state temperature field of normal gears and modified gears. Based on heat transfer theory, Zhang Yueming et al. conducted steady-state temperature field analysis using ANSYS Workbench commercial software and studied the influence of the number of strip areas on temperature field accuracy.
At present, domestic and foreign scholars have conducted more research on the thermal effect of spur gears, while there is relatively less research on the temperature field of helical gears with high transmission power and heat generation. This article uses a combination of MATLAB numerical modeling and finite element analysis to analyze and study the contact characteristics and temperature field of helical gears, and proposes a calculation method for the steady-state temperature field of helical gears.
1. Contact analysis of helical gears
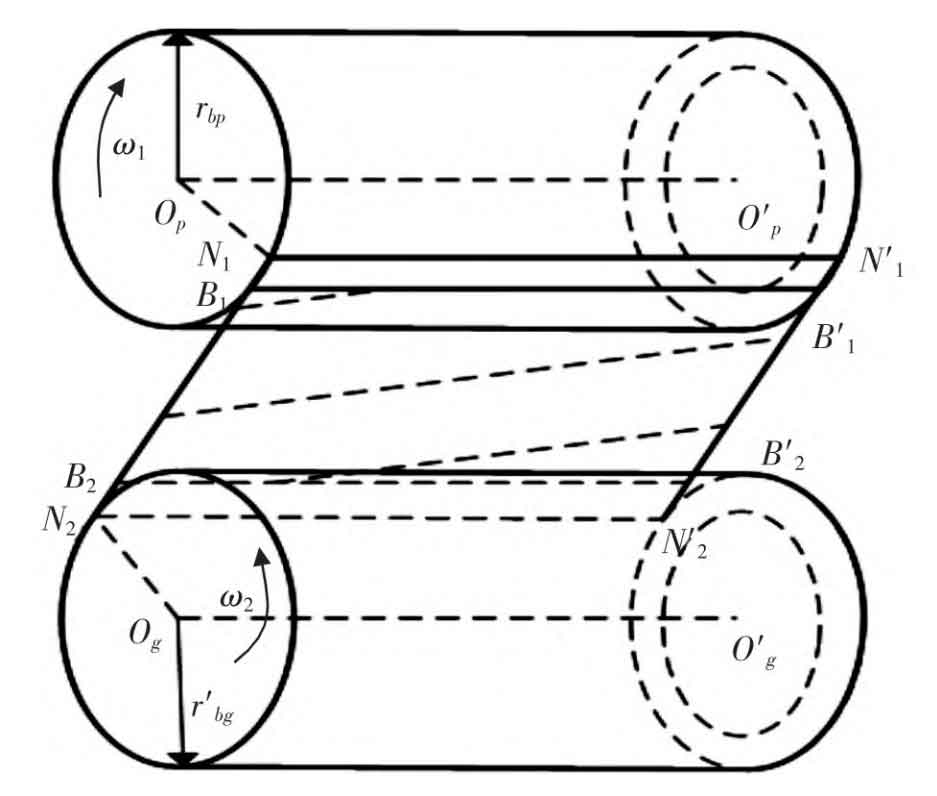
Due to the presence of helical angles, the meshing process of helical gears is different from that of spur gears. The established helical gear meshing geometric model is shown in Figure 1. In the figure, Op, O’p, Og, and O’g are the main driven wheel rotation axis, rbp, and rbg are the main driven wheel base circle radius, w1 and w2 are the corresponding rotation angular velocities, N1, N2, N’2, and N’1 are the theoretical meshing areas, B1, B2, B’2, and B’1 are the actual meshing areas, and the diagonal line in the meshing area is the contact line, whose length is a time-varying value. This article studies a pair of helical gears, and their basic parameters are shown in Table 1.
| Parameters | Driving wheel | Driven wheel |
| Number of teeth | 17.0 | 26.0 |
| Spiral angle/(°) | 15.0 | 15.0 |
| Normal surface modulus/mm | 4.5 | 4.5 |
| Pressure angle/(°) | 20.0 | 20.0 |
| Tooth width/mm | 20.0 | 20.0 |
The contact of helical gears is line contact, but due to the presence of helix angle, the length of the contact line during helical gear meshing is a time-varying value. Due to the fact that the end face overlap of helical gears is greater than the shaft surface overlap, the length of the contact line can be expressed as:
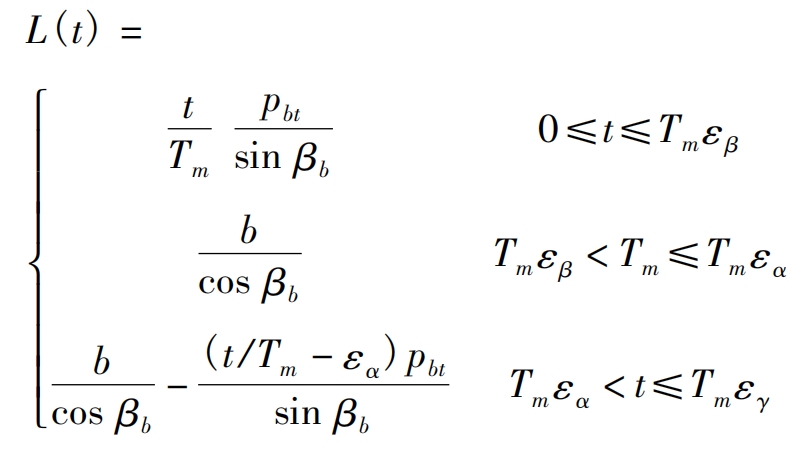
In the formula: εα、εβ、εγ They are the end face coincidence degree, axial plane coincidence degree, and total coincidence degree, respectively; Tm is the meshing period; β B is the helix angle; PBT is the tooth pitch; B is the width of the helical gear. According to the meshing principle, the total length of the contact wire is:

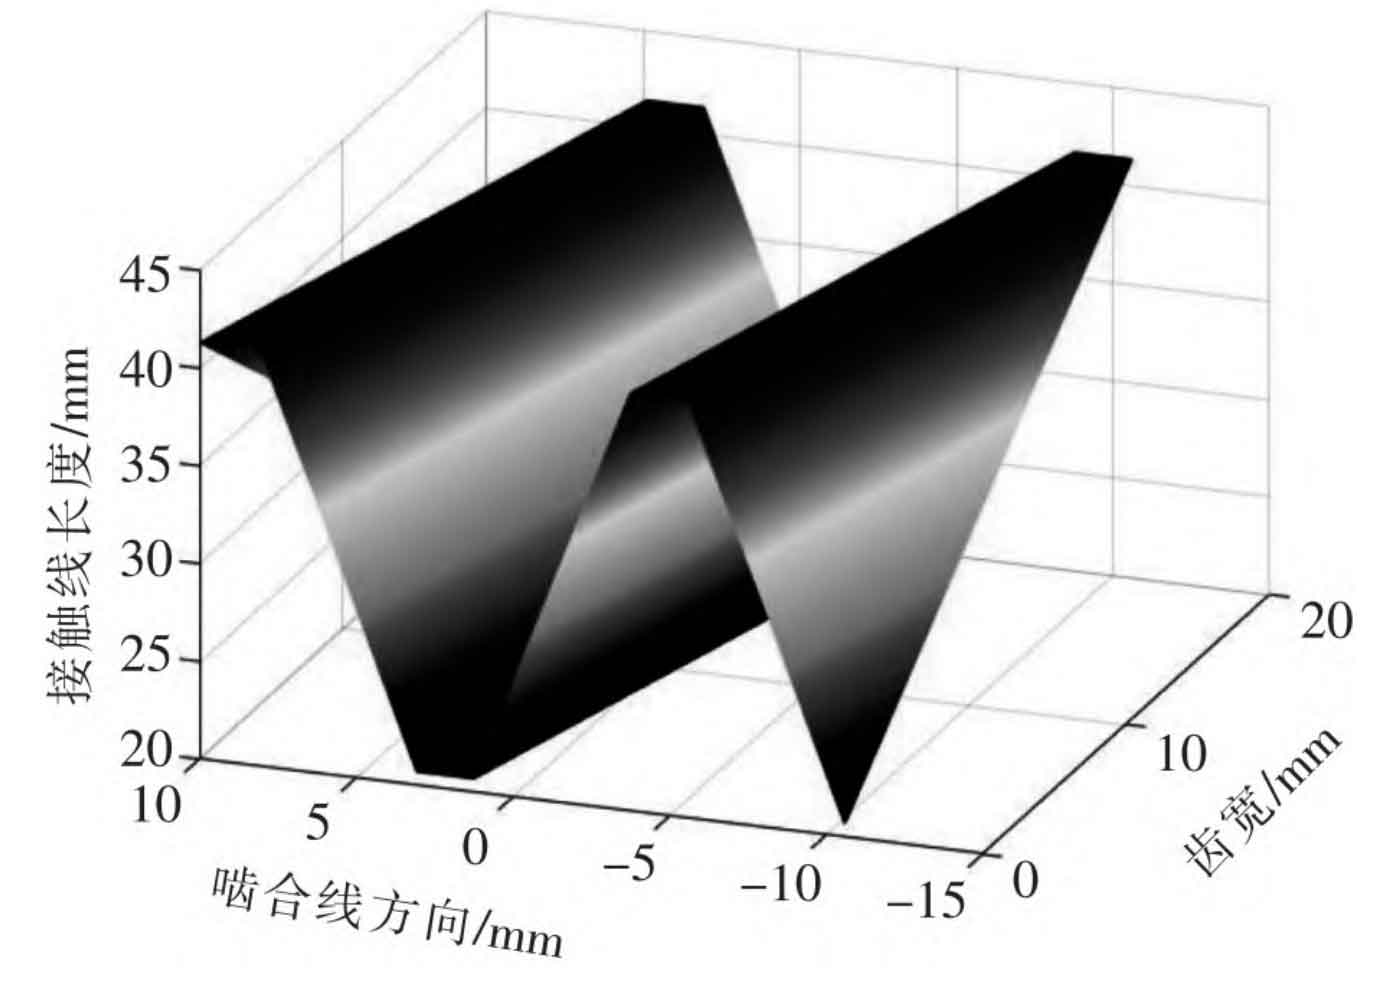
In the formula: N is the number of contact lines, Li (t) is the length of the i-th contact line at time t. The total length distribution of the contact line of the helical gear is shown in Figure 2.
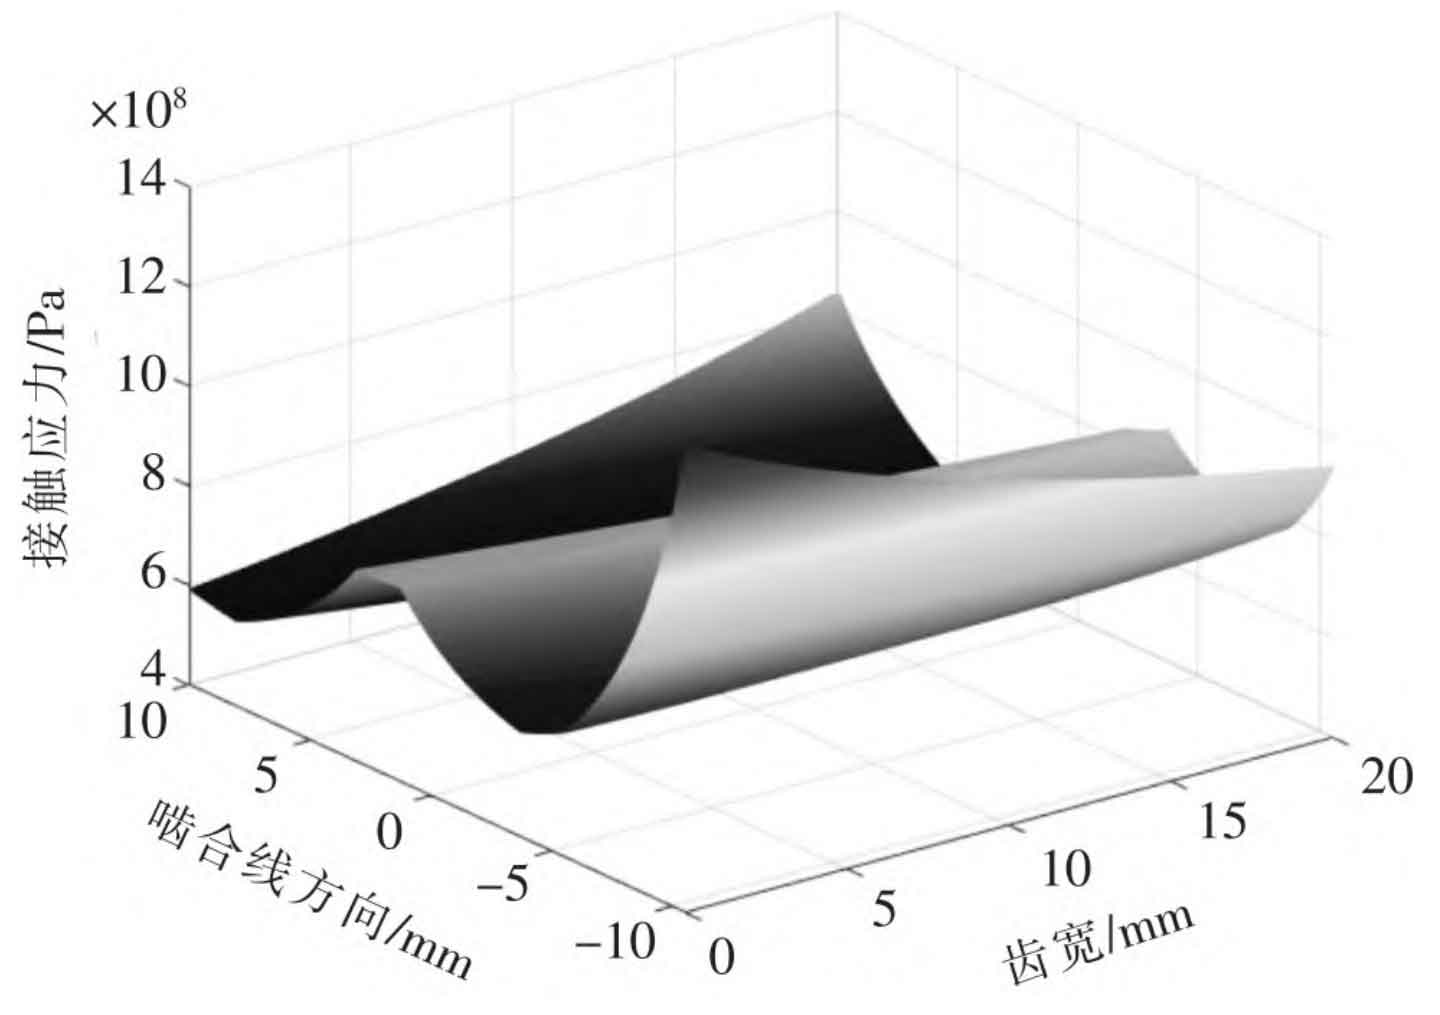
The contact of helical gears can be equivalent to the contact between a pair of cones. According to Hertz contact theory, the average contact stress on the tooth surface and the Hertz contact half width are:
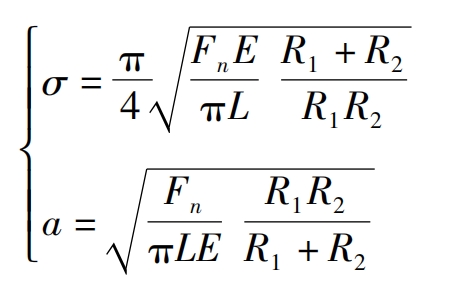
In the formula: Fn is the tangential load; R1 and R2 respectively have the main and driven wheel curvature radii; E is the equivalent elastic modulus; L is the length of the contact wire. The average contact stress distribution of helical gear meshing is shown in Figure 3.
2. Friction heat flux density
2.1 Friction heat flux density of the driving wheel
The frictional heat generated between the meshing surfaces of helical gears mainly includes sliding friction between teeth, rolling friction, and friction caused by metal elastic-plastic deformation. It is necessary to consider the frictional heat generated by sliding friction between teeth. The sliding friction heat flux from the meshing surface is determined by contact stress, relative sliding speed, and friction coefficient of the tooth surface. As the helical gear rotates one revolution, the formula for calculating the frictional heat at the meshing point of the helical gear tooth surface and the formula for calculating the frictional heat flux density of the driving wheel are:
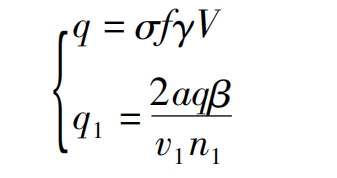
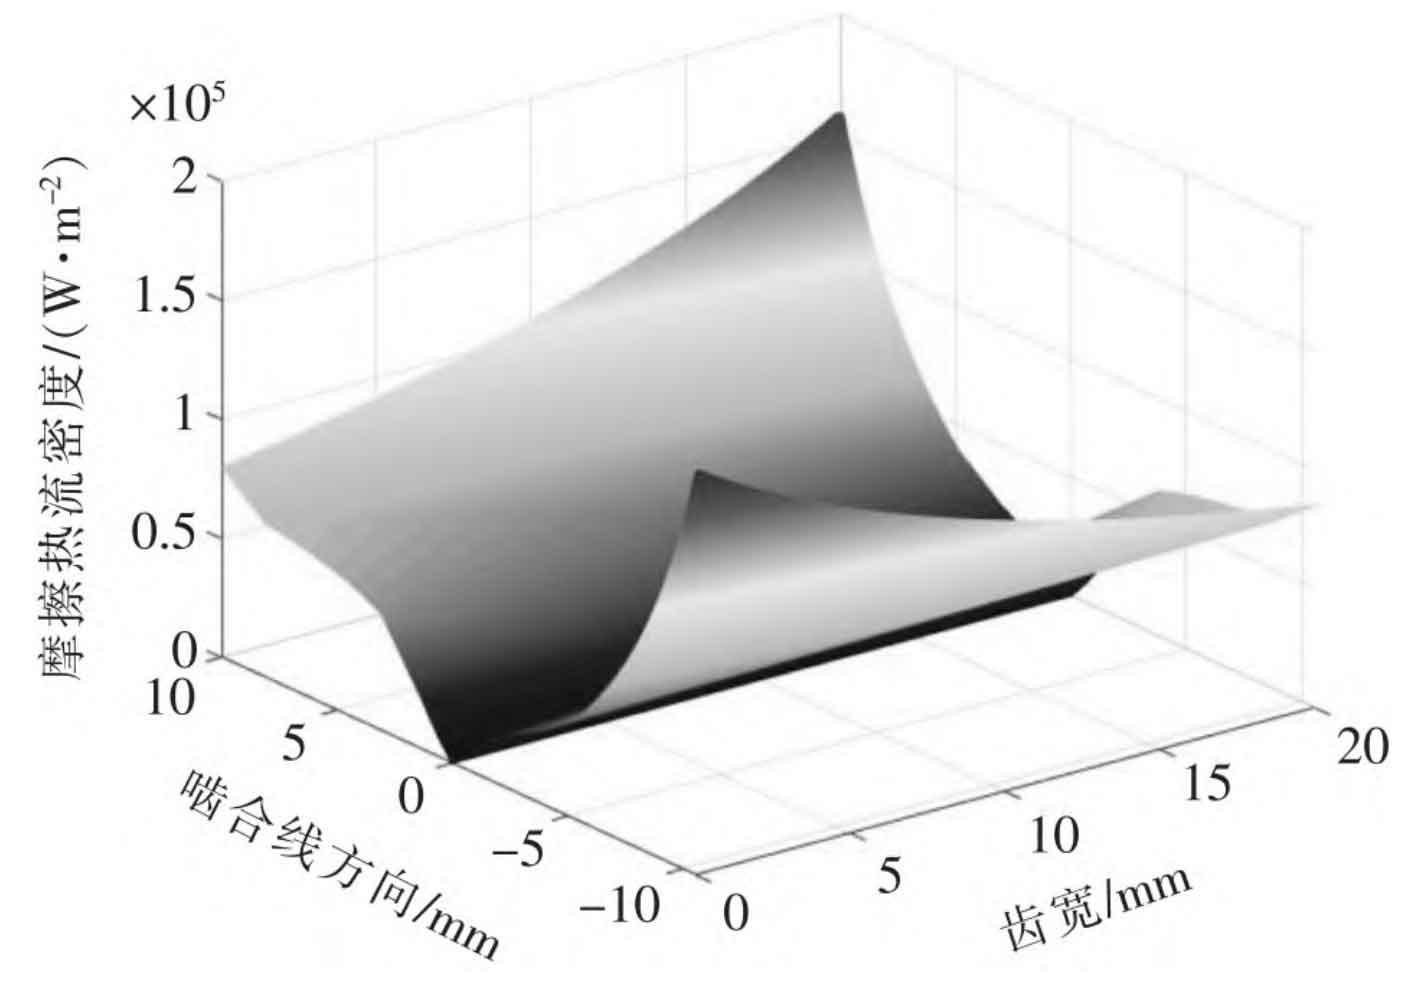
In the formula: σ Contact stress; F is the friction coefficient of the tooth surface; V is the relative sliding speed; γ Is the thermal energy conversion coefficient; A is the half width of the junction area; β Is the heat distribution coefficient; V1 represents the tangential speed of the driving wheel; N1 is the speed of the driving wheel. Assuming that the heat is evenly distributed on two helical gears, the distribution of frictional heat flux density on the tooth surface of the driving gear is shown in Figure 4.
2.2 Friction heat flux density under different parameters
According to the formula for calculating the frictional heat flux density of helical gears, it can be concluded that the relative sliding speed of the tooth surface, the contact stress of the tooth surface, and the linear velocity of the helical gear tooth surface are important factors affecting the frictional heat flux density, which mainly vary with the changes in speed and applied torque. Therefore, this article studied the distribution of frictional heat flux density on the tooth surface of the active gear under different rotational speeds (800, 1200, and 2400 r/min) and different torques (160, 260, and 360 N · m). Comparing the frictional heat flux density on one side of the helical gear end face, the results are shown in Figures 5 and 6, respectively.
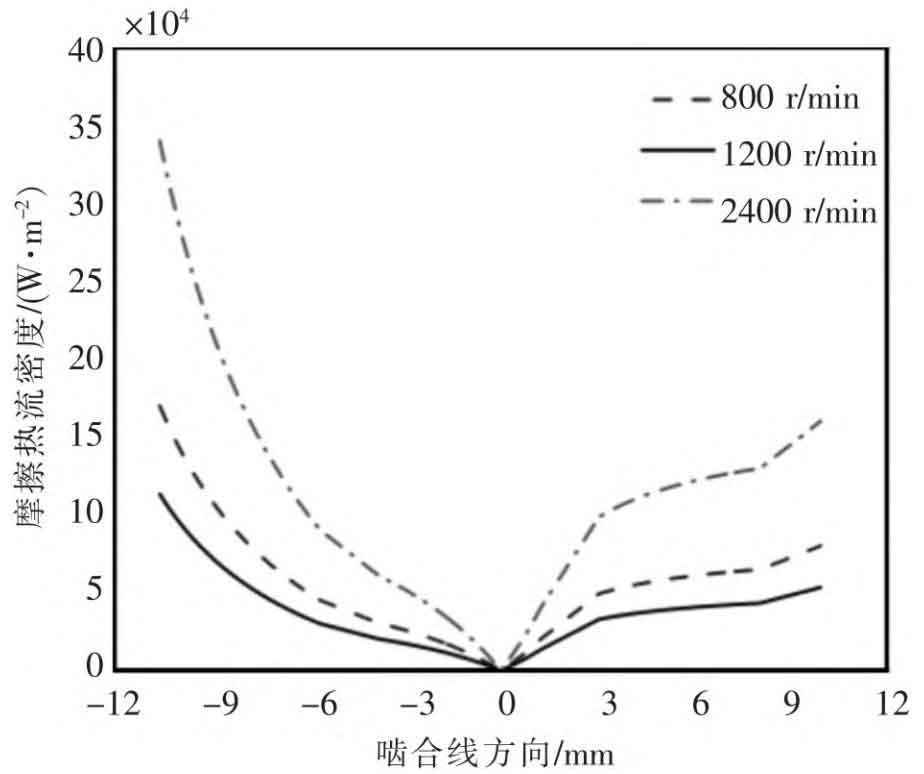
As shown in Figure 5, under the condition of a fixed torque of 260 N · m, the distribution pattern of frictional heat flux density on the helical gear tooth surface of different speed bars remains consistent: from the starting meshing point to the helical gear pitch line position, the frictional heat flux density on the tooth surface gradually decreases from the peak value, and finally becomes 0 at the node position. Then, from the node position to the exit meshing point, the frictional heat flux density on the tooth surface gradually increases, The main reason is that the relative sliding speed of the tooth surface at the meshing position and the meshing position of the helical gear is relatively high, while at the node position, the relative sliding speed of the tooth surface is 0. In addition, at speeds of 800, 1200, and 2400 r/min, the peak frictional heat flux density at the end position of the helical gear tooth surface is 1 fourteen × 105 W/m ^ 2, 1.7 × 10⁵ W/m ^ 2 and 3.44 × 10⁵ W/m ^ 2, increasing with increasing speed.
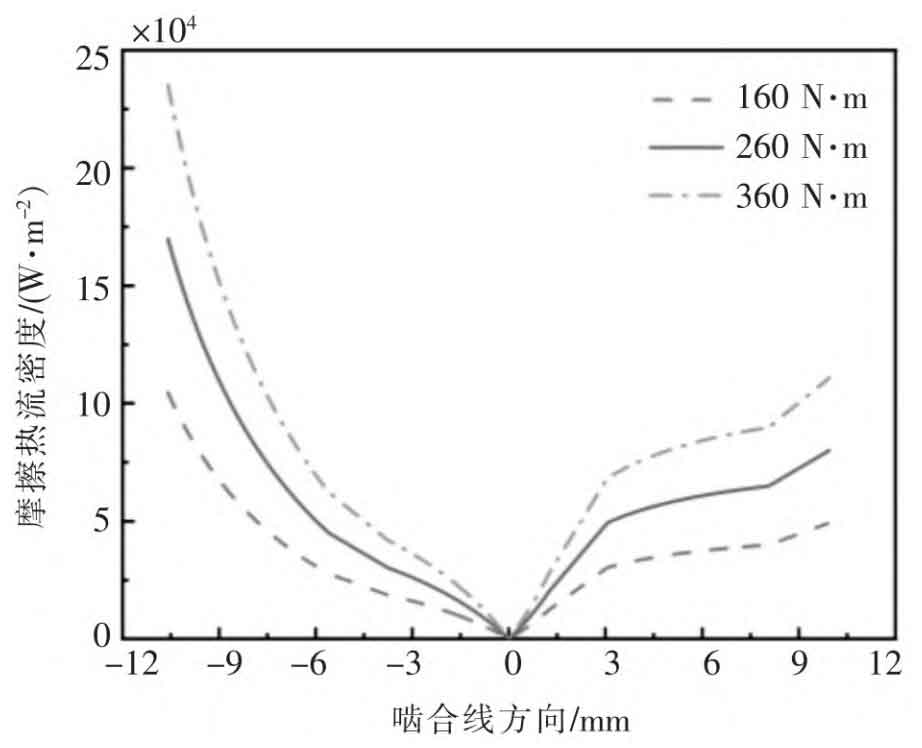
As shown in Figure 6, under the condition of fixed speed 1200 rpm, the distribution pattern of frictional heat flux density corresponding to different torques of 160, 260, and 360 N · m remains consistent, with corresponding peaks of 1.05, respectively × 105 W/m ^ 2, 1.7 × 10⁵ W/m ^ 2 and 2.35 × 10⁵ W/m ^ 2, increasing with increasing torque.
3. Steady state temperature field of helical gears
3.1 Calculation of convective heat transfer coefficient
The profile of a single helical gear is shown in Figure 7, and each surface is divided. The T area is the top surface of the helical gear teeth, the F area is the root surface, the D and E areas are the end faces of the gear teeth, the M and N areas are the profile surfaces, and the J and K areas are the symmetry surfaces of the gear teeth. J. There is no heat conduction in the K region, and there is no calculation of convective heat transfer coefficient. The calculation formula for convective heat transfer in other regions is as follows.
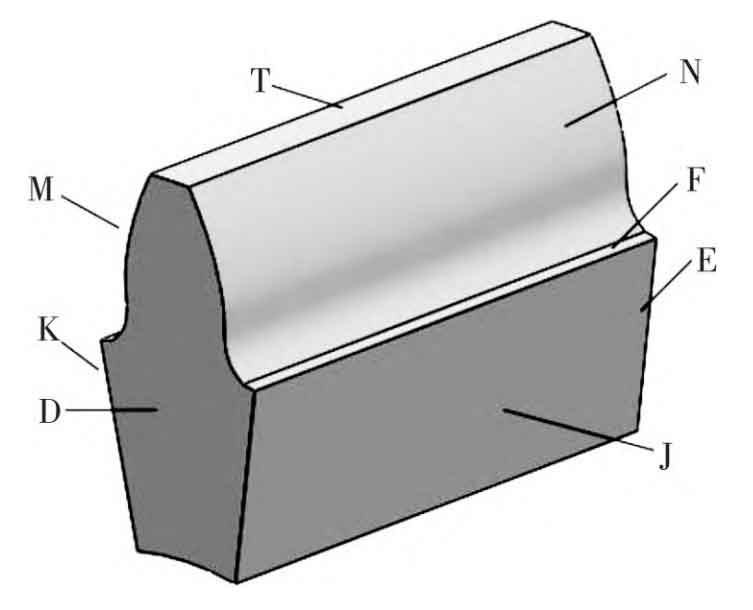
N. The convective heat transfer coefficient in region M is:

In the formula: λ Is the thermal conductivity coefficient; Re is the Reynolds number; Pr is the Prandtl number, and dp is the pitch diameter.
D. The convective heat transfer coefficient in region E is:

In the formula: w is the angular velocity; VR is the kinematic viscosity of the lubricating oil.
T. The convective heat transfer coefficient in region F is:

According to the basic parameters and application conditions of helical gears, the basic parameters of lubricating oil used in this article are shown in Table 2.
| Density/(kg · m ^ -3) | Thermal conductivity/(W/m · ℃) | Viscosity/(mm ^ 2 · s ^ -1) | Prandtl number |
| 860 | 0.131 | 46.05 | 587.35 |
3.2 Steady state temperature field
After establishing a single tooth model in SolidWorks, the tooth surface was divided and finally imported into ANSYS Workbench for mesh division, friction heat flux density, and convective heat transfer coefficient loading. Finally, the steady-state temperature field of helical gears under different torque conditions was obtained.
As shown in Figure 8, under different torque conditions, the steady-state temperature distribution pattern of helical gears is consistent with the distribution pattern of friction heat flux density. The highest temperature occurs at the tooth root position, and the tooth root and tooth top positions belong to the high-temperature region. The temperature peak increases with the increase of torque.
4. Conclusion
1) Numerical modeling is conducted in MATLAB to obtain the distribution patterns of relative sliding speed, surface contact pressure, and frictional heat flux density of helical gears. The distribution patterns of relative sliding speed and frictional heat flux density are basically consistent.
2) The relative sliding speed and torque of the tooth surface are the main parameters that affect the friction heat flux density and the temperature field of helical gears. As the relative sliding speed and torque increase, the friction heat flux density and tooth surface temperature correspondingly increase.
3) The high-temperature region of the steady-state temperature of the driving wheel appears at the top and root of the teeth, which is more prone to thermal deformation and bonding failure of the teeth. Therefore, appropriate adjustments should be made using methods such as helical gear modification.


