In order to study the vibration characteristics of spur gear pair considering the randomness of error and tooth surface friction, taking the spur gear pair shown in Table 1 as the research object, the fourth-order fixed step Runge Kutta method is used to solve the formula, and the simulation step is 0.5 000 15。
| Parameter | Driving wheel | Driven wheel |
| Number of teeth | 33 | 26 |
| Accuracy class | 6GJ | 6GJ |
| Mass / kg | 10.6 | 7.43 |
| Modulus / mm | 7 | 7 |
| Moment of inertia (/ kg ⋅ mm2) | 147 670 | 61 426 |
| Pressure angle (/ °) | 20 | 20 |
| Tooth width / mm | 69 | 69 |
| Input speed (/ R / min) | 2 000 | 2 000 |
| Input torque (/ N ⋅ m) | 2 340.7 | 2 340.7 |
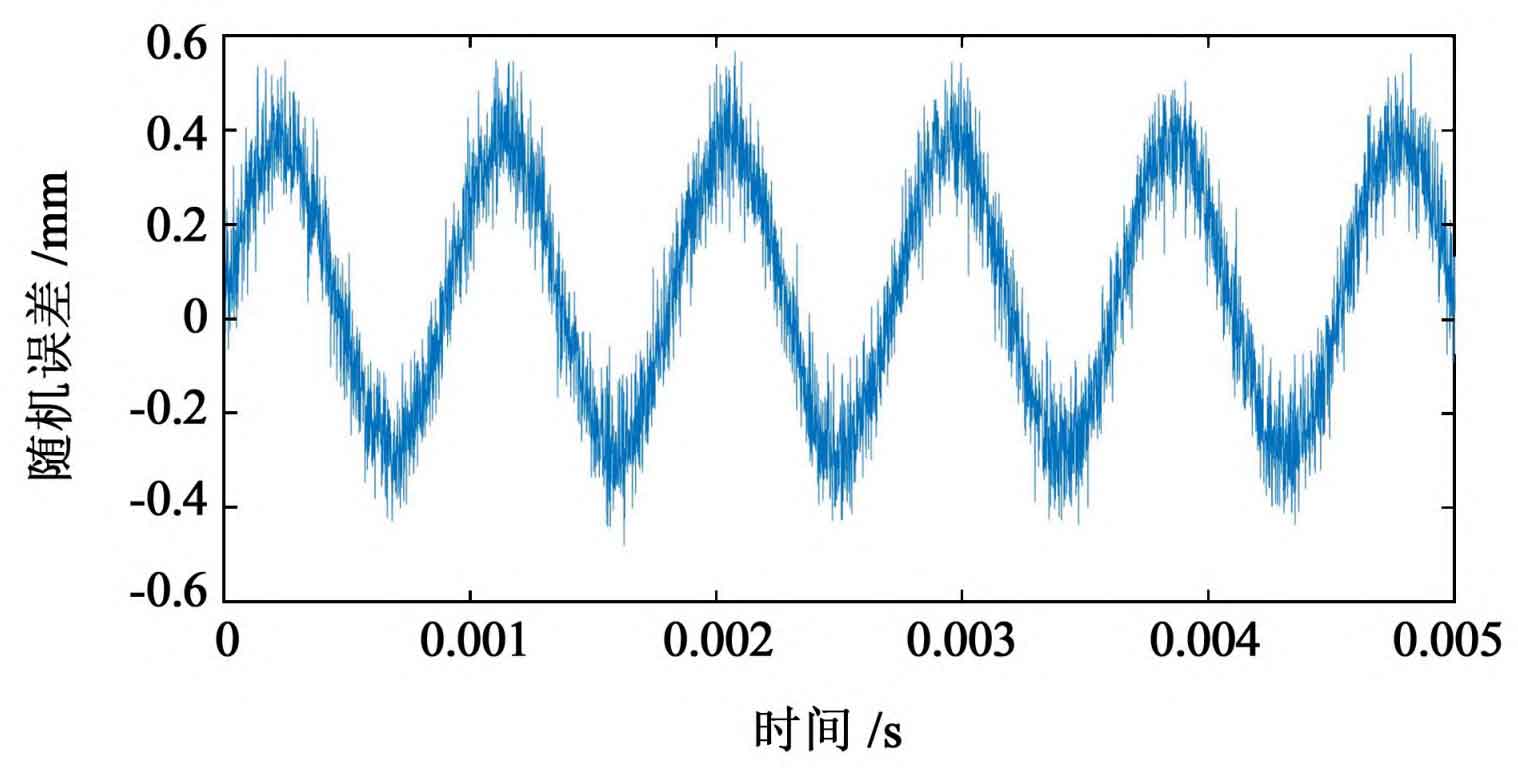
Under the interference of random error, the tooth surface friction coefficient and meshing radius also have a certain randomness. Analyze the response characteristics obtained from the solution, and obtain the vibration response of the driving and driven gears, as shown in Figure 1.
It can be seen from Figure 1 that the bending vibration amplitude of the driven wheel is larger, and the torsional vibration amplitude of the two gears is similar; For the same spur gear, the vibration amplitude in X direction is smaller than that in Y direction. It can be seen from table 2 that the randomness of the driven wheel response is stronger under the interference of random error; For the same gear, the randomness of the response in Y direction is stronger than that in X direction.
| Parameter | Driving wheel | Driven wheel |
| Response numerical characteristics | Mean square deviation | Mean square deviation |
| X direction (/ mm / S2) | 5.512 7 | 7.865 7 |
| Y direction (/ mm / S2) | 15.134 2 | 21.591 4 |
| Torsion (/ rad / S2) | 0.125 4 | 0.237 5 |
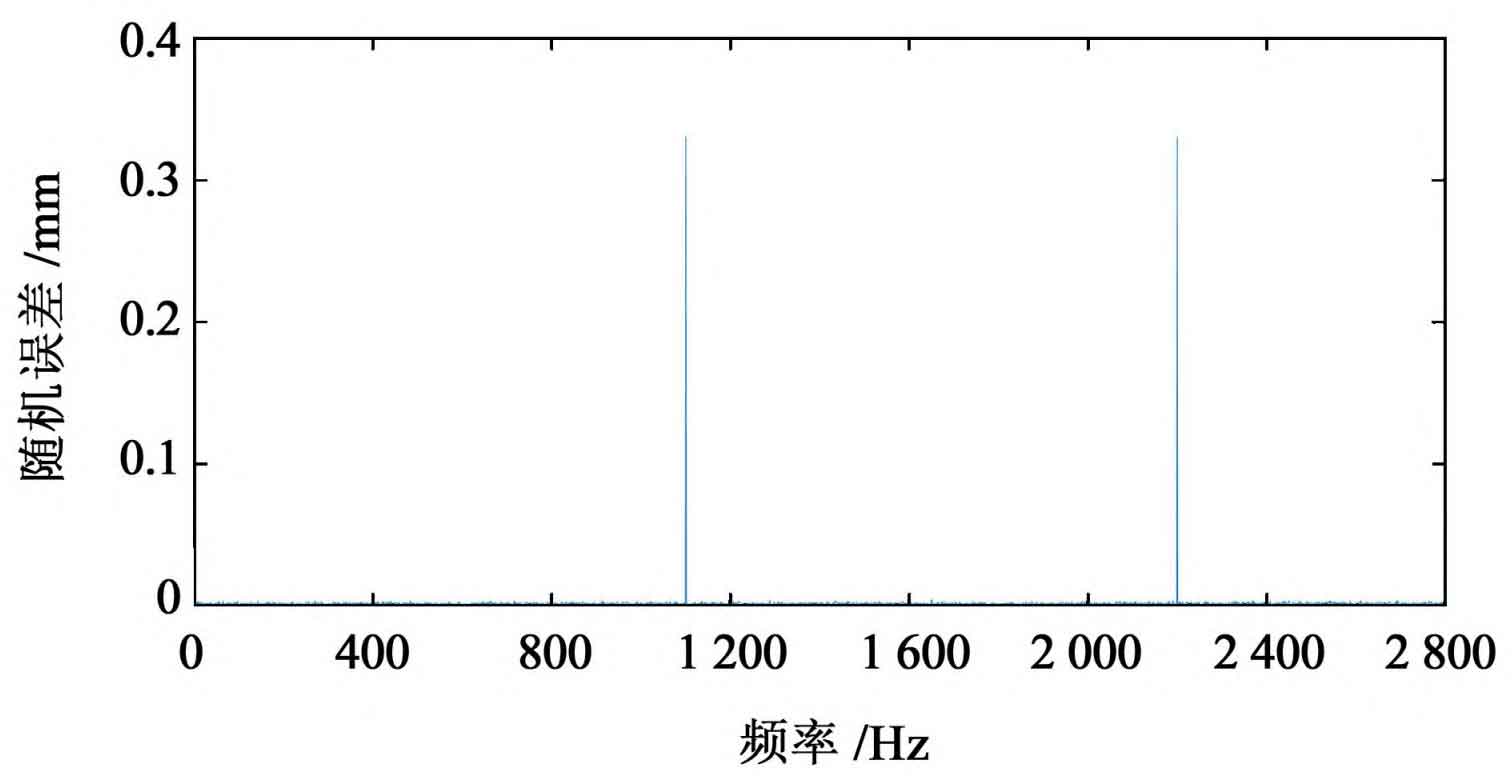
For the continuous transient response of random vibration, the statistical results under the excitation of multiple random variables are reflected by using the probability statistical method of power spectral density. The vibration power spectrum is obtained as shown in Figure 2.
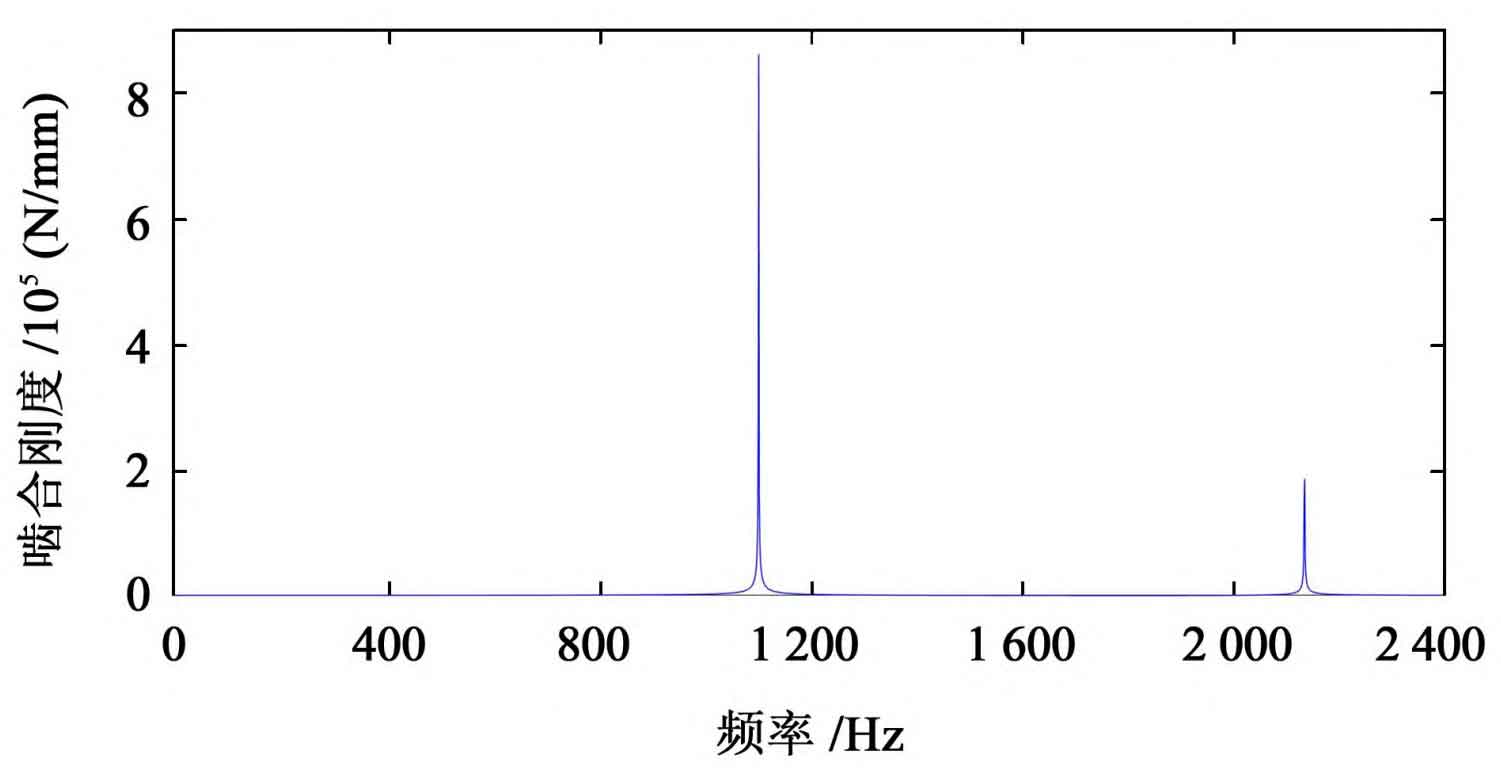
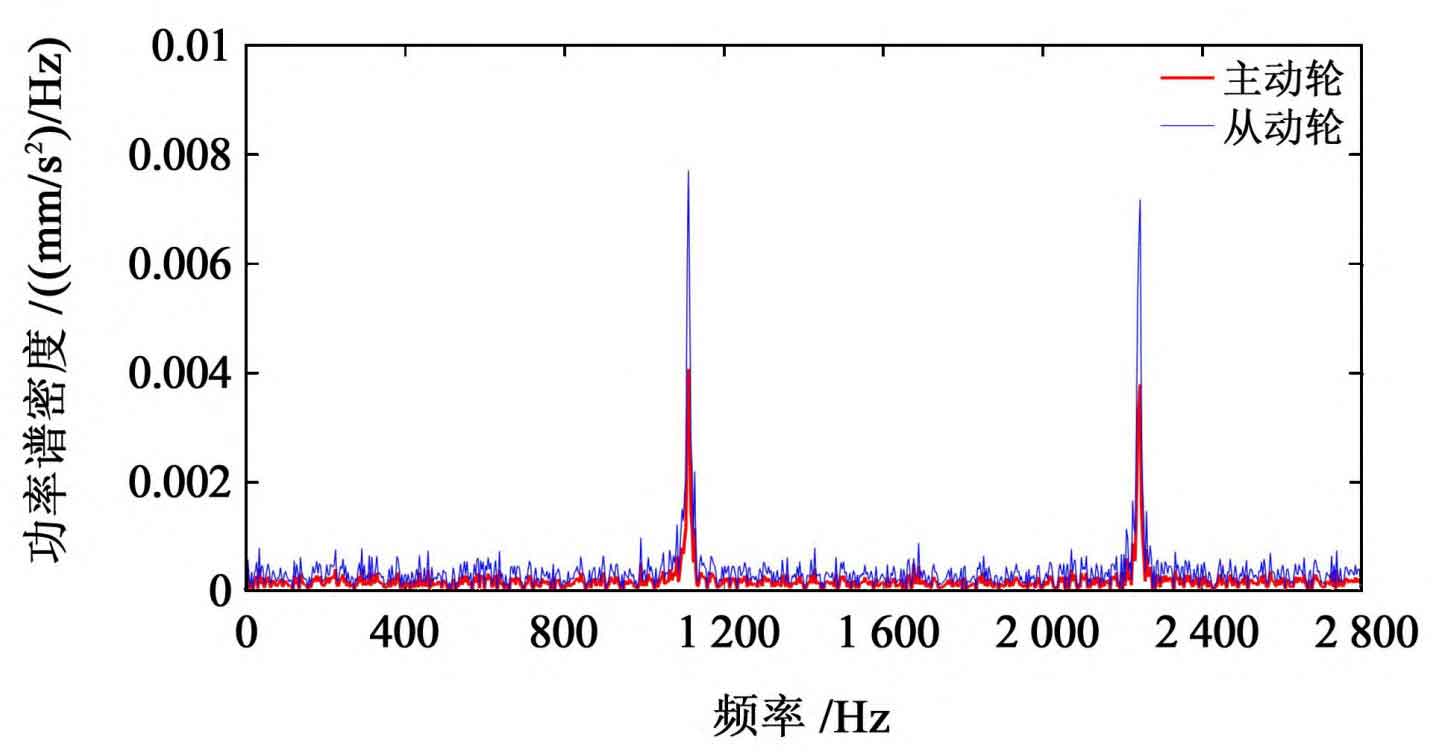
As shown in Fig. 3 and Fig. 4, the peak frequency of meshing stiffness corresponds to the meshing frequency of 1100 Hz; The peak frequency of random error is 1100 Hz and 2200 Hz respectively. It can be seen from Figure 2 that under the simulation conditions shown in Table 1, the peak energy of torsional vibration signal of spur gear transmission is concentrated at 1100 Hz and 2200 Hz, indicating that the spur gear vibration response signal is the modulation of excitation frequency to meshing frequency and its frequency doubling. Due to the convolution effect between meshing stiffness, friction factor and random error, there is a multilateral frequency band near the peak, and the amplitude is large.