
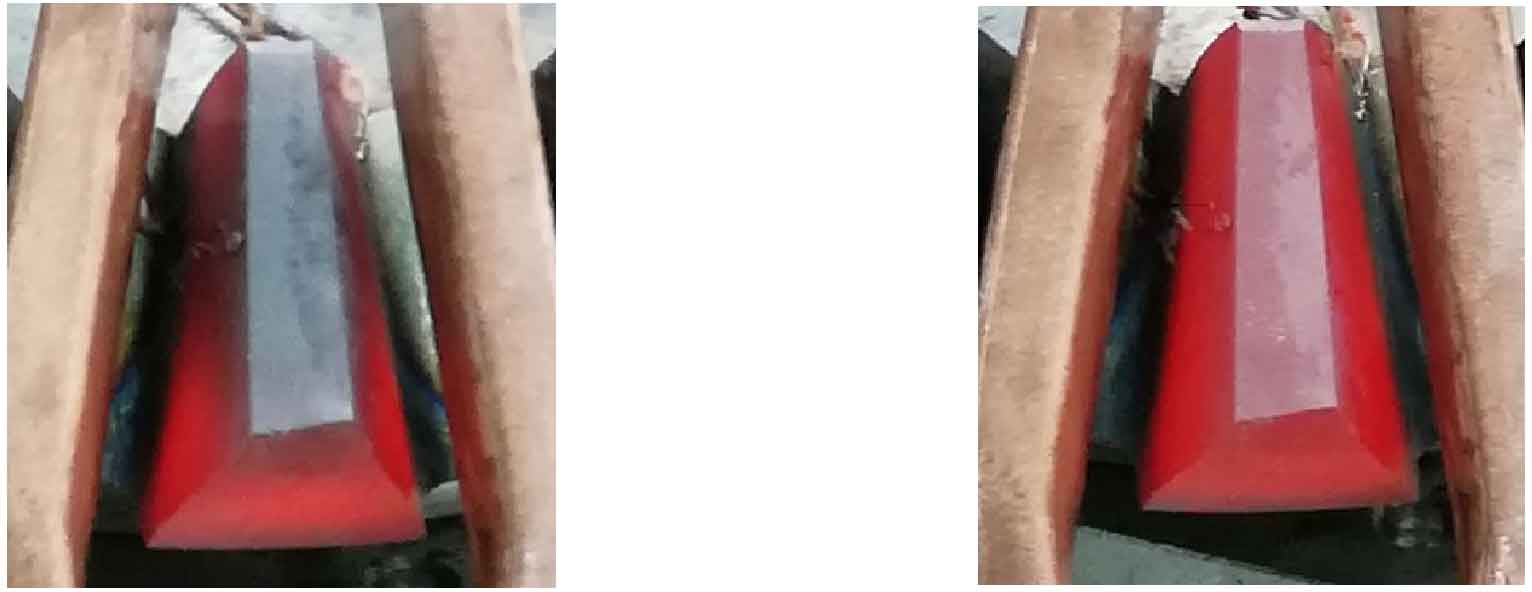
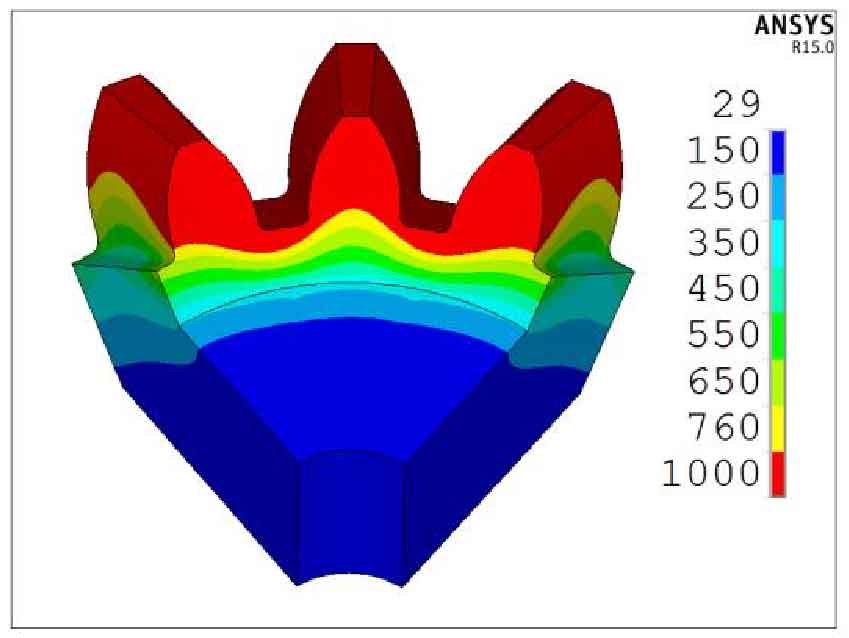
The double frequency heating experiment and numerical simulation of bevel gear are carried out with the determined process parameters. The medium and high frequency current is switched only once. First medium frequency induction heating for 40s, then cooling for 9s (for switching medium and high frequency induction coils), and then high frequency induction heating for 15s. First, conduct induction heating, and compare the temperature diagram taken at the double frequency induction heating experiment site of bevel gear with the temperature field diagram of numerical simulation, as shown in Fig. 1 and Fig. 2. It can be seen that the experimental verification results are good.
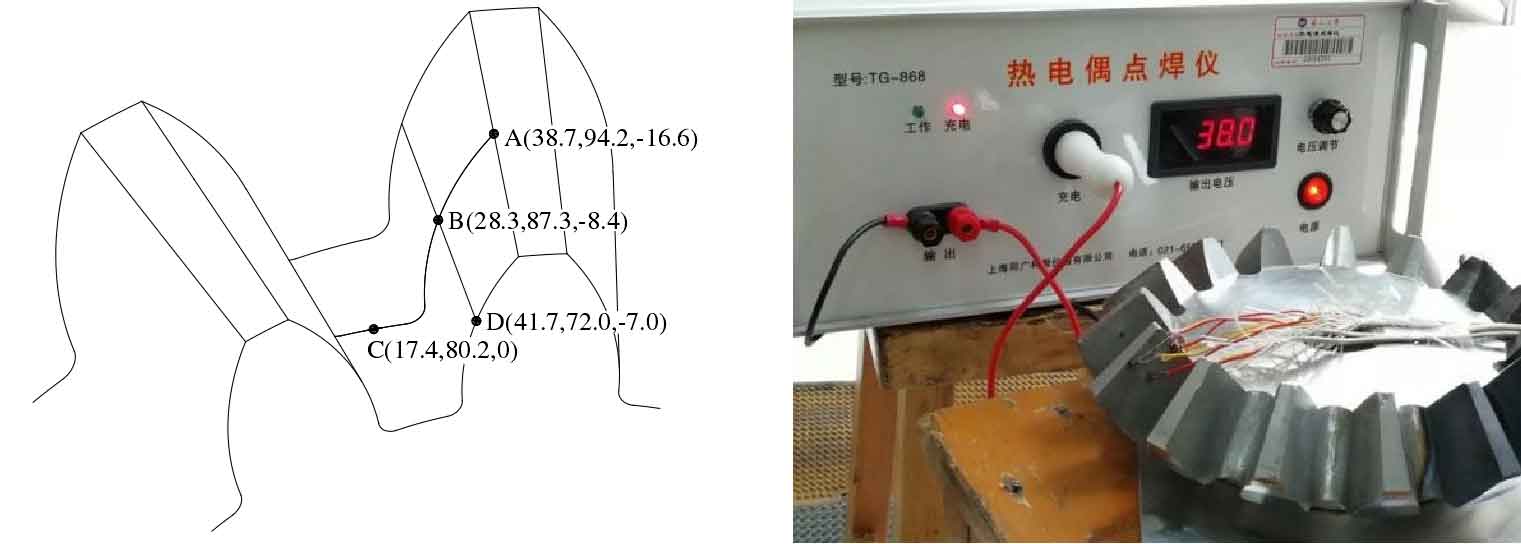
Extract three points on the tooth profile path on the middle section of the bevel gear, as shown in Figure 3. Extract the numerical simulation results and the experimental temperature measurement results for comparative analysis.
As can be seen from Fig. 4, the temperature trends of points a and B on the bevel gear tooth profile are basically the same. Except for the intermediate air cooling process, it has maintained an upward trend. The induction temperature fluctuates at about 880 ° C.
It can be seen from Figure 4 that the rising trend of the curve slows down at about 760 º C, because the surface temperature of the bevel gear reaches the Curie point temperature, and the permeability and other parameters of the material change significantly. The permeability parameter of No. 45 steel decreases rapidly to 1 at about 760 º C, and the permeability and other parameters are directly related to the heat generation rate in the induction heating process, As a result, the induced eddy current value on the surface of the bevel gear decreases rapidly, so the heat production is reduced.
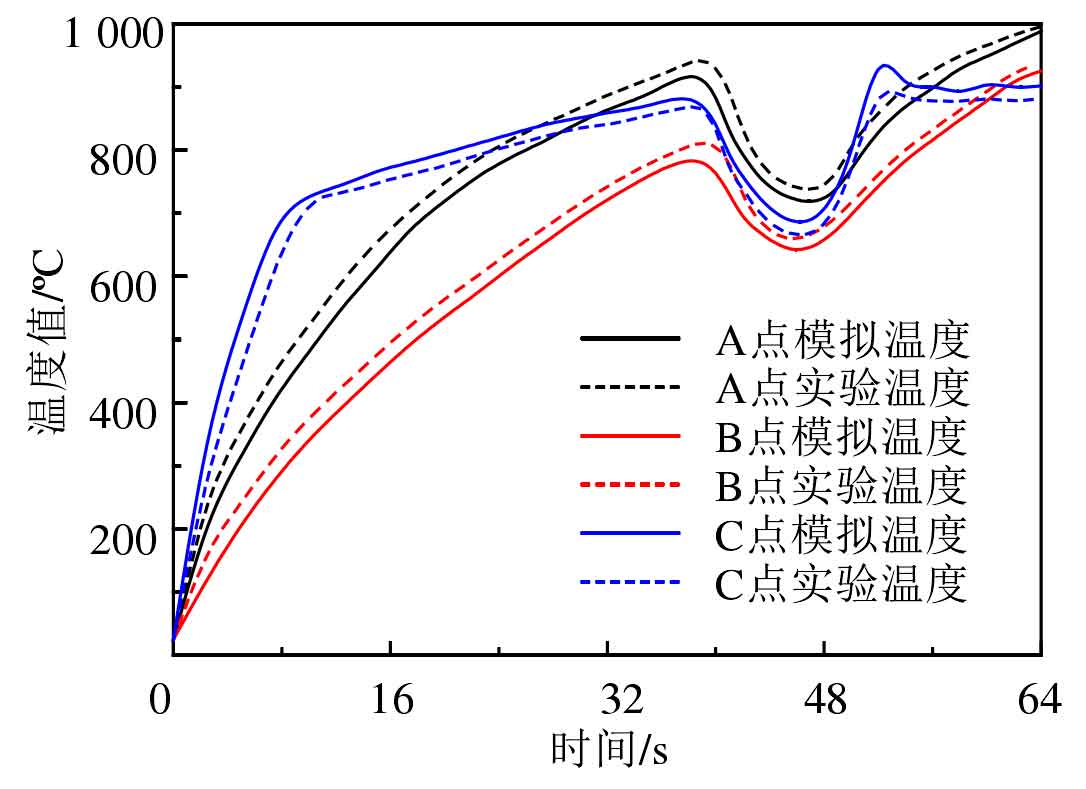
It can also be seen from Figure 4 that there will be a certain temperature difference between the experimental temperature rise curve and the simulated temperature rise curve. The experimental temperature rise curve of point a and B is higher than the simulated temperature rise curve, while the experimental temperature rise curve of point C is lower than the simulated temperature rise curve, which is mainly due to the low positioning accuracy of induction coil and gear during the experiment. During the experiment, the distance between the induction coil and the tooth root is too large, which leads to the reduction of the induction heating efficiency of the tooth root and the temperature rise speed of point C. On the contrary, the area of the induction coil directly heating the tooth top and tooth surface increases, resulting in the improvement of the induction heating efficiency of points a and B.
In addition, during induction heating, in addition to conducting the surface heat of the bevel gear to the interior of the substrate, the bevel gear also conducts convective heat exchange with the air and radiates heat to the air, which will lead to the loss of surface heat of the bevel gear. The first part of the heat loss is only related to the temperature difference between the surface and the substrate. If the difference between the surface temperature in the experiment and the surface temperature in the simulation is small, the error in this part will also be small. For the second part, because the boundary environment of the bevel gear in the experiment is difficult to be exactly the same as the boundary conditions set in the simulation, there is some error. Comparing the experimental temperature rise curve and the simulated temperature rise curve in Figure 4, it can be seen that the maximum temperature difference occurs at the end of medium frequency induction heating. At this time, the temperature difference at point a is 41.3 º C, the temperature difference at point B is 32.7 º C, and the temperature difference at point C is 45.2 º C. After high-frequency induction heating, the temperature difference at point a is 13.1 º C, the temperature difference at point B is 12.3 º C, and the temperature difference at point C is 20.5 º C.
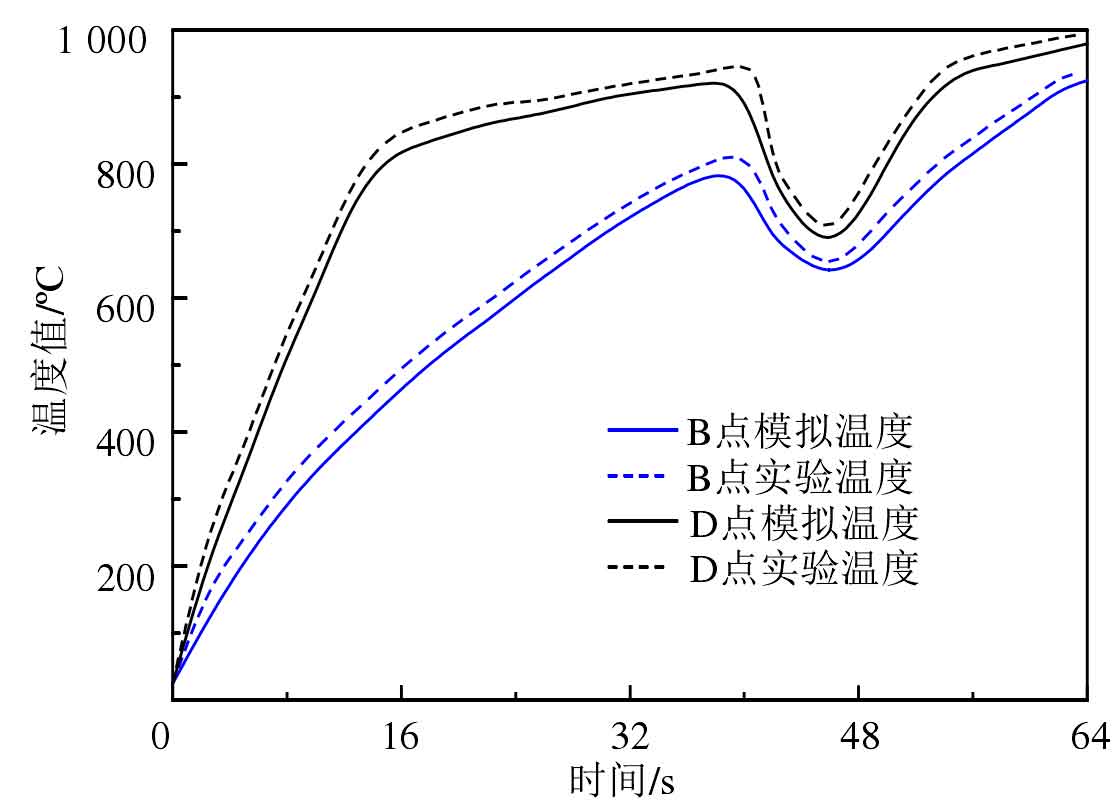
Figure 5 shows the temperature rise curve of two points along the tooth width direction on the bevel gear tooth surface. The specific positions of points B and D are shown in Figure 3. As can be seen from Figure 5, the temperature rise speed of point d at the end of the tooth surface is significantly higher than that of point d at the middle of the tooth surface, which is caused by the high induction heating efficiency of point d due to the “end effect”. At the beginning of medium frequency induction heating, the temperature at point D is significantly higher than that at point B. However, when the temperature at point d reaches the “Curie point” temperature of 760 º C, the temperature rise rate decreases significantly, and the temperature difference between points B and D decreases continuously. Moreover, because the temperature at the end point B of the bevel gear is high, during the induction heating process, the temperature at point B also continuously transmits to point d at the midpoint of the tooth surface. After about 16S, the temperature difference between points B and D gradually decreases. It can also be seen from Figure 5 that the temperature difference between points B and D decreases significantly during the cooling process after the completion of medium frequency induction heating. It can be seen that an appropriate cooling time will contribute to the uniformity of the temperature field on the tooth surface. Comparing the experimental temperature rise curve and simulated temperature rise curve of points B and D in Figure 4, it can be seen that the experimental temperature rise curve is higher than the simulated curve, which is also due to the insufficient positioning accuracy of the coil during the induction heating experiment and the error between the boundary condition of the bevel gear and the simulation. The maximum error of induction heating process occurs at the end of medium frequency induction heating. At this time, the temperature difference at point B is 32.7 º C and the temperature difference at point D is 36.5 º C. after high-frequency induction heating, the temperature difference on the surface of bevel gear changes slightly, the temperature difference at point B is 12.3 º C and the temperature difference at point D is 15.4 º C.
To sum up, the experimental temperature rise curves of points a, B, C and D are basically consistent with the temperature rise curve obtained by simulation with ANSYS software. The maximum temperature error during induction heating is 5.4%, and the temperature error at 64S is about 2.4%.