1. Introduction
High – linear – velocity gears play a crucial role in various mechanical systems, especially in high – speed rotating machinery such as aerospace engines, high – speed trains, and industrial gearboxes. However, the power loss of these gears, particularly windage power loss, has become a significant concern. Windage power loss not only reduces the transmission efficiency of the gear system but also leads to substantial energy consumption. As the demand for higher – efficiency and more energy – saving mechanical systems grows, understanding and minimizing windage power loss in high – linear – velocity gears is of great importance.
Previous studies by scholars around the world have explored different methods to address this issue. Many researchers focused on the impact of gear – related factors on windage power loss. For example, Fondelli et al. investigated the influence of boundary walls on airflow losses and found that placing gears in a shell similar to a fairing could reduce windage losses caused by airflow effects. Hill et al. used computational fluid dynamics (CFD) methods to analyze the windage torque of spur gears and achieved good agreement between simulation results and measured windage losses. Dawson and Anderson et al. proposed empirical formulas for calculating gear windage power loss based on experimental data. Rapley et al. analyzed the windage torque with and without gear fairings and studied the impact of inlet, outlet fairings, and the gap between the fairing and the tooth slot on windage. Domestic scholars such as Zhang Xuyang and Zhao Ning also conducted research on gear windage power loss using CFD software, exploring the pressure and velocity distribution of air in the gearbox with and without gear fairings.
Despite these efforts, the traditional method of using fairings to reduce windage power loss has limitations. Fairings cannot be completely sealed, which may lead to the generation of vortices, and they also add extra weight, resulting in limited windage reduction effects. Therefore, this paper aims to explore a more effective method – negative pressure regulation – to reduce the windage power loss of high – linear – velocity gears.
2. Simulation Model Establishment and Parameter Setting
2.1 Simulation Model Establishment
In this study, the object of research is a helical gear pair, and its parameters are presented in Table 1.
| Parameter | Active Gear | Driven Gear |
|---|---|---|
| Number of Teeth | 36 | 217 |
| Normal Module | 3.5 | 3.5 |
| Normal Pressure Angle | 20 | 20 |
| Helix Angle | 10.298 | 10.298 |
| Face Width | 70 | 70 |
| Rotational Speed | 16576 | 2750 |
When analyzing windage, the air in the gearbox is considered. It is assumed that the air in the gearbox is an incompressible flow, and the influence of temperature is neglected. Thus, the air in the gearbox follows the laws of mass conservation and energy conservation. The mass conservation equation is , and the energy conservation equation is , where is the fluid density, is the velocity vector, is the pressure, is the external force per unit volume of fluid, and is the dynamic viscosity.
The flow state of the fluid during flow can be laminar or turbulent, which is usually characterized by the Reynolds number . In engineering applications, when , the fluid flow is laminar; when , it is turbulent. The formula for calculating the Reynolds number in the flow field is , where is the average fluid velocity, is the pipe diameter, and is the fluid viscosity. In this study, the pitch – circle linear velocity of the gear is as high as 110 m/s. Under such a high – speed rotation, the air around the tooth surface also flows at a high speed. According to the literature, the Reynolds number of the gearbox at high speed can reach more than , indicating that the fluid in the gearbox is in a turbulent flow state. Therefore, the SST model suitable for high – Reynolds – number flows is selected for windage research. This model can more accurately predict the resistance and separation effects of the tooth surface on the airflow.
To simulate the real – world movement of the fluid in the gearbox, a method for simulating the rotation of components is needed. Common methods in simulation software include the reference – frame method, mixed – grid method, sliding – grid method, and dynamic – grid method. The dynamic – grid method is more reasonable for simulating the actual physical field in the gearbox. In the dynamic – grid model, the gear is defined as a rotating wall, and the inner wall of the gearbox is defined as a closed non – slip wall. When the gear pair meshes, the teeth are in contact with each other. When using the dynamic – grid method for simulation analysis, a negative – volume error may occur. Therefore, a certain gap needs to be maintained at the meshing position of the gears. Common adjustment methods include the two – way tooth – cutting method, the profile – shifting method, and the separation method. The two – way tooth – cutting method involves cutting a part of the upper half of the gear tooth; the profile – shifting method uses a negative profile – shifting coefficient to make the tooth thickness narrower; the separation method increases the center distance between the two gears to obtain a reasonable meshing gap. The first two methods change the normal shape of the gear and may affect the windage calculation results on the tooth surface. The separation method preserves the normal shape of the tooth and can better simulate the actual physical field on the tooth surface. Therefore, the separation method is selected in this study to adjust the gear meshing gap, as shown in Figure 1.
The air – fluid region in the gearbox is separated to establish a fluid domain. Its 3D model and grid division are shown in Figure 2. In the simulation software, the fluid domain is meshed with unstructured grids, and all grids are tetrahedral grids. The total number of grids is 5.1896 million, and the number of grid nodes is 979,800. At this time, the number of grids is sufficient, and the simulation calculation time is relatively short. The grid – division result is shown in Figure 2(b).
In the fluid simulation software, the fluid pressure cannot be directly set. To change the atmospheric pressure inside the gearbox to negative pressure, the state equation of the fluid can be referred to, and the negative pressure is achieved by changing the density of the air. The state equation of air is , where is the air constant and is the thermodynamic temperature. In this study, is set, and the state with an air density of is used to represent a certain negative – pressure condition. The grid – division result is imported into the simulation software. A pressure – based transient calculation is used, and the gear rotation is realized using the dynamic – grid model. The solution control remains the default, the solution time – step size is set to , and the number of time steps is determined. The small gear is the driving gear and rotates clockwise, while the large gear is the driven gear and rotates counter – clockwise. Two gear torque reports are set in the simulation software to record the windage torque received by the driven and driving gears at each time step during the calculation process.
2.2 Windage Power Loss Calculation
The resistance of the air to the tooth surface forms a windage torque on the gear. The windage torque of the gear consists of two parts: the pressure – difference torque and the viscous torque, that is , where is the gear windage torque, is the pressure – difference torque, and is the viscous torque.
Currently, the empirical formulas for windage power loss are obtained from experiments under normal pressure conditions and cannot directly obtain the windage loss under negative pressure like finite – element simulation analysis. Through finite – element simulation analysis, the windage torque of the gear under negative pressure can be obtained, and then, according to the conversion formula between power and torque , the windage power loss caused by the windage torque in the negative – pressure environment can be calculated.
When the gear rotates at a high speed in the gearbox, the air in the fluid domain moves in the opposite direction relative to the gear. At this time, a high – pressure area is generated on the windward tooth surface of a single tooth due to the accumulation of air, while a low – pressure area is generated on the leeward tooth surface due to the air being carried away, as shown in Figure 3. After the air enters the tooth groove, a vortex is formed in each tooth groove, which, to a certain extent, accelerates the flow of air from the leeward tooth surface to the windward tooth surface of the next tooth. The pressure difference between the local high – pressure and low – pressure areas generates a pressure – difference torque opposite to the rotation direction of the gear, thereby hindering the rotation of the gear and causing a certain power loss. It can be seen from the formation of the pressure – difference torque that it mainly acts on the tooth surface of the gear. For the flat end face, the pressure – difference torque is negligible.
3. Windage Power Loss Analysis
3.1 Flow – Field Characteristics Analysis in a Negative – Pressure Environment
The pressure inside the gearbox is set to 50 kPa (0.5 atm) negative pressure, and the gear linear velocity is 110 m/s. After the calculation is completed, the data is analyzed. Three analysis planes are selected in the fluid domain of the gearbox, namely the , , and planes, as shown in Figure 4. The plane is at the center of the two gears, the plane is at the gear – meshing position, and the plane is in the middle of the gear width.
The plane reflects the overall flow state of the air inside the gearbox. Only the distribution of the meshing area is intercepted, and its relative – pressure cloud diagram is shown in Figure 5. It can be seen from the figure that the pressure in the gear – meshing – in area is mostly positive, representing a relatively large positive pressure, while the pressure in the meshing – out area is mostly negative, representing a relatively large negative pressure. At this time, due to the high – speed rotation of the gear, the air converges in the meshing – in area, causing the pressure here to gradually increase, with a maximum value of 11693.6 Pa. In the meshing – out area, the gears disengage, resulting in an increase in the space volume and the formation of a vacuum area, generating a negative pressure, with a minimum value of – 28378.6 Pa. The rotational speed of the driving gear is very high, and the air on the tooth surface flows rapidly. The air in the tooth – groove part has no time to enter, so there is a lot of negative – pressure distribution near the tooth surface of the driving gear in the figure.
The change in pressure in the meshing area with the – coordinate is shown in Figure 6. It can be seen from the figure that as the – coordinate decreases, the pressure increases rapidly when approaching the meshing – in area, reaches a maximum value, then drops rapidly and forms a negative pressure. After the negative pressure reaches the maximum, it rises rapidly to near zero pressure. The pressure changes rapidly in the short distance between the meshing – in and meshing – out areas and fluctuates slightly in other areas. The rapid change in pressure in the meshing area will cause the fluid in this area to move violently, which, to a certain extent, hinders the movement of the gear and thus consumes part of the gear’s energy.
Figure 7 and Figure 8 are the velocity – distribution and turbulent – kinetic – energy – distribution cloud diagrams of the fluid in the plane, respectively, both of which reflect the movement state of the fluid. It can be seen from the velocity – cloud diagram that the velocity of the tooth surface is very large, and the maximum value appears near the gear node, reaching 173.4 m/s. Then, the velocity gradually decreases along the gear radius. Turbulent kinetic energy is an index to measure the development or decay of turbulence. The large turbulent kinetic energy near the tooth surface indicates that the turbulent flow is intense, which will cause significant energy loss to the gear. Its maximum value appears at the gear – meshing node, reaching . From the pressure – cloud diagram in Figure 5, it can be seen that the pressure changes violently in the meshing – in and meshing – out areas, and the flow – field movement is also intense. Therefore, the velocity and turbulent kinetic energy reach their maximum values in the meshing area. The fluid velocity and turbulent kinetic energy near the tooth surface are both very large, and the resistance of the fluid to the tooth surface will also be large, indicating that the tooth surface is the key area for the generation of windage power loss.
3.2 Composition of Windage Power Loss in a Negative – Pressure Environment
The windage torques received by the driving and driven gears of the gear are different, and the proportions of the pressure – difference torque and the viscous torque are also different. Taking the simulation data results of the last time step, the windage torque data under a negative pressure of 50 kPa (0.5 atm) can be obtained, as shown in Figure 9. It can be seen from the figure that the windage torque of the gear under negative pressure is mainly the pressure – difference torque, and the proportion of the viscous torque is small, indicating that the windage power loss mainly occurs on the tooth surface rather than the gear end face. The proportion of the viscous torque in the driven gear is relatively large, reaching 20.99%, which is related to the large end – face area of the driven gear. In the driving gear with a smaller end – face area, the proportion of the viscous torque is very small.
The torque magnitudes of the driving and driven gears are analyzed under a negative pressure of 50 kPa (0.5 atm) and normal pressure, respectively. The proportions of the viscous torque and the pressure – difference torque in the total torque are also analyzed. Taking the torque data of the last time step and sorting the data, Figure 10 can be obtained. It can be seen from the figure that the torques under negative pressure are much smaller than those under normal pressure, and the total windage torque is nearly half that under normal pressure. The pressure – difference torque accounts for at least 79.01% of the total torque. The proportion of the viscous torque is relatively large in the driven gear and very small in the driving gear. Compared with normal pressure, the proportions of the pressure – difference torque in the driving and driven gears under negative pressure are relatively reduced, while the proportions of the viscous torque are relatively increased.
To understand the impact of negative pressure on windage power loss, the total windage power loss of the gear under a negative pressure of 50 kPa (0.5 atm) is compared with that under normal pressure. The average value of the torques in the last 100 time steps is extracted, and after processing the data, Figure 11 can be obtained.
3.3 Influence of Different Working Conditions on Windage Power Loss
When the gear linear velocity is low, the influence of windage is small. When the gear linear velocity is high, a large windage torque will be generated near each tooth surface, which hinders the rotation of the gear and reduces the transmission efficiency of the gearbox. By using the control – variable method to keep the negative – pressure environment in the gearbox constant and 借助有限元仿真软件 (by using finite – element simulation software), the total windage power loss under different linear velocities is explored by modifying the gear linear velocity. The average value of the torques in the last 100 time steps is taken, and the torque data under 20 kPa (0.2 atm), 60 kPa (0.6 atm), and normal pressure 101 kPa (1.0 atm) are counted. Then, through the conversion formula between torque and power, the corresponding windage loss power is obtained, and finally, the data is sorted to get Figure 12. It can be seen from the figure that in a 60 kPa (0.6 atm) negative – pressure environment, the total windage power loss at 70 m/s can be reduced by about 90% compared with that at 150 m/s. In a 60 kPa (0.6 atm) negative – pressure environment, for every 20 m/s increase in the linear velocity, the total windage loss power shows an exponential increase. That is, the windage loss power shows a curve relationship similar to an exponential growth with the increase of the linear velocity, which is consistent with the data in the literature. Therefore, to reduce the windage power under the premise of ensuring the transmission efficiency, the linear velocity of the gear should not be too high.
In addition to the gear linear velocity, as can be seen from Figure 11, the lower the pressure in the gearbox, the smaller the power loss caused by windage when the gear rotates at a high speed. The control – variable method is used to analyze the windage power loss under different negative – pressure environments of the gearbox at the same linear velocity, and the power loss of the gearbox under different negative – pressure environments is studied. The pressure in the gearbox is evenly distributed in the range of 20 – 60 kPa (0.2 – 1 atm), and then its influence law is explored.
The influence of the negative – pressure environment on windage loss is analyzed at linear velocities of 70 m/s, 110 m/s, and 150 m/s respectively. The simulation – obtained data is sorted to get Figure 13. It can be seen from the figure that at a linear velocity of 150 m/s, the windage power loss under a 20 kPa (0.2 atm) negative pressure can be reduced by about 79% compared with that under normal pressure. The windage power loss under the three linear velocities shows a linear change with the increase of the gearbox pressure, but the slopes of the three curves are different. The higher the linear velocity, the larger the slope of the curve, and the greater the windage power loss at the same atmospheric pressure. The greater the gear linear velocity and the higher the gearbox pressure, the greater the windage loss power caused by the high – speed rotation of the gear. Therefore, under the premise of allowable conditions, choosing a smaller pressure and gear linear velocity can effectively reduce the power loss of the gearbox and improve the transmission efficiency of the gear pair.
3.4 Comparison between Simulation and Theoretical Formula
The windage power loss data of the driven gear obtained from the simulation under normal pressure is compared with Dawson’s empirical formula, and Figure 14 can be obtained. It can be seen from Figure 14 that with the increase of the gear linear velocity, the error between the simulation calculation data and the empirical formula gradually expands. When the linear velocity is below 130 m/s, the error between the two does not exceed 15%, which is relatively reliable. When the linear velocity reaches 150 m/s, the error can reach 17%, which is relatively large. The comparison results of the two show that the simulation data is consistent with the theoretical formula results at a lower linear velocity. The error at a linear velocity of 150 m/s is relatively large, which is related to the different gear – pair models and the fact that the empirical formula is based on low – linear – velocity experimental data.
4. Experimental Analysis
4.1 Test – Bench Construction
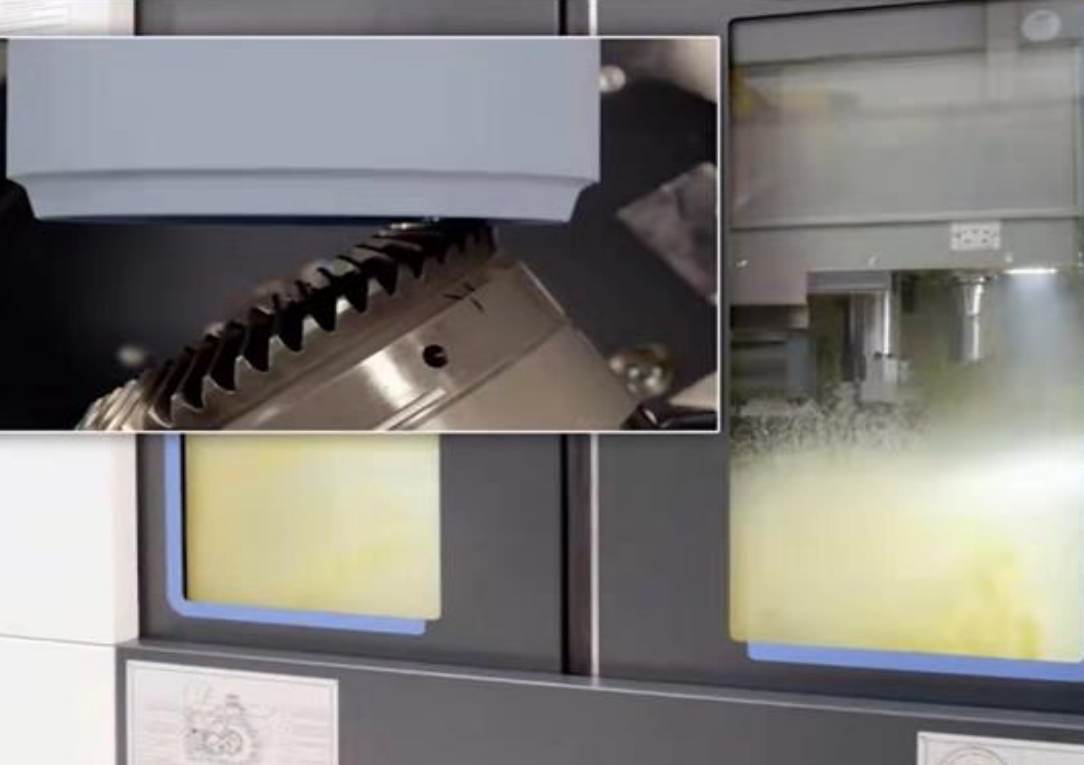
The experimental device mainly includes a transmission gearbox and a vacuum oil station. The power of the gearbox is 500 kW. In the experiment, the large gear is used as the driving gear, and the input rotational speed is 2750 r/min. The small gear is used as the driven gear, and the output rotational speed is 16576 r/min. The gearbox is shown on the left side of Figure 15, and its main internal structures include the driving gear, the driven gear, and the lubrication pipeline. The gearbox body is sealed to ensure its airtightness when evacuated. The vacuum oil station is shown on the right side of Figure 15, which mainly functions to cool and pump negative pressure.
To ensure the stability and accuracy requirements of the experiment, a high – linear – velocity gear oil – injection lubrication test bench is designed. The test bench includes a drive motor, a torque meter, a test gearbox, and negative – pressure equipment. The drive motor is mainly used to provide power for the gearbox. The power of the drive motor is 390 kW, and the maximum rotational speed is 3500 r/min, which can ensure that the linear velocity of the gear pair reaches more than 110 m/s. The torque sensor (torque meter) is used to measure the torque during the operation of the gear, as shown in Figure 16.
To verify the effectiveness of the method for improving the transmission efficiency of high – linear – velocity gears based on negative – pressure regulation, the windage power loss of high – speed transmission gears under negative pressure is measured. In the experiment, the resistance torque of the gear comes not only from the windage torque but also from the oil – agitation torque, friction torque, etc. Therefore, in this experiment, the focus is on measuring the reduced windage power loss in the negative – pressure environment. After measuring the resistance torque of the gear pair under different pressures, the reduced windage power loss in the negative – pressure environment compared with the normal – pressure environment can be obtained through conversion.
In the experiment, the JN – 338 torque – speed measuring instrument is used to measure the rotational speed and torque. It is used in conjunction with the torque sensor, with a measurement accuracy of less than or equal to 0.2%FS and a measurement division value of 0.1 N·m. It can measure the torque and rotational speed of the gear and display the data in real – time. Figure 17 shows the real – time measurement data of the instrument at different rotational speeds.
4.2 Results and Comparative Analysis of Windage Power Loss
In the experiment, at a linear velocity of 110 m/s and normal pressure, the measured resistance torque of the gear is 170.09 N·m, as shown in Figure 18(a). After evacuation, the negative pressure measured by the pressure instrument is 60 kPa (0.598 atm), and the resistance torque at this time is 158.07 N·m, as shown in Figure 18(b). Since only the negative – pressure environment is changed, the reduced resistance torque is the windage torque. At this time, the reduced windage power loss due to negative pressure is 3.46 kW. From the simulation analysis data in Figure 13, the windage power loss under a 60 kPa (0.6 atm) negative pressure is 5.03 kW, and the windage power loss under normal pressure is 8.24 kW. By interpolating and fitting the data in Figure 12 and Figure 13 using software, the windage power loss under a 60 kPa (0.598 atm) negative pressure can be estimated to be approximately 5.00 kW. At this time, the windage power loss reduced by negative pressure compared with normal pressure is 3.24 kW.
The data at a linear velocity of 100 m/s is further analyzed under the same working conditions. The measured data in the experiment is compared with the simulation data, and the reduced windage power loss of negative pressure compared with normal pressure can be obtained, as shown in Table 2.
| Linear Velocity / m·s⁻¹ | Experimental Value / kW | Simulation Value / kW | Error between the Two / % |
|---|---|---|---|
| 110 | 3.46 | 3.24 | – 6.36% |
| 100 | 2.33 | 2.47 | 6.01% |
It can be seen from Table 2 that the errors between the experimental and simulation values are very close, but with opposite signs. This is because in the simulation analysis, only the windage power loss is calculated, while in the experiment, the power loss is related to factors such as linear velocity, lubrication conditions, negative pressure, and vibration. Therefore, there are certain differences in the reduced losses measured at different linear velocities. Overall, the absolute values of the errors between the two do not exceed 10%, which verifies the reliability of the simulation calculation method. The windage loss is strongly related to the gear linear velocity (rotational speed). During the experiment (low – load) and rated – power operation, if the gear linear velocities are the same, the windage losses are also the same. The rated power of the test gearbox is 500 kW. Referring to the measured windage data in the experiment, it can be known that at a rated linear velocity of 110 m/s, a negative pressure of 60 kPa (0.598 atm) can reduce the total power loss of the gearbox by 0.69% compared with normal pressure, or it can increase the transmission efficiency by 0.69%.
5. Conclusion
This paper conducts an in – depth analysis of the windage power loss of high – linear – velocity gears in a negative – pressure environment and verifies it through relevant theories and experiments. The main conclusions are as follows:
(1) In a negative – pressure environment, the pressure on the meshing – in side of the gear is positive, and the pressure on the meshing – out side is negative. The pressure in the meshing area changes rapidly, and the fluid moves violently. The air velocity near the tooth surface is high, and the turbulent kinetic energy is also high. The tooth surface is the main area of windage power loss.
(2) In the windage torques of the driving and driven gears in a negative – pressure environment, the pressure – difference torque accounts for the largest proportion. Compared with normal pressure, the proportion of the pressure – difference torque in the negative – pressure environment decreases, while the proportion of the viscous torque increases. The total windage power loss under a 50 kPa (0.5 atm) negative pressure is reduced by 49.15% compared with that under normal pressure.
(3) The windage power loss increases linearly with the increase of the gearbox pressure and increases in an exponential – like relationship with the increase of the linear velocity. A low negative – pressure environment and linear velocity can effectively reduce the power loss of the gearbox. The error between the simulation value and the empirical formula value is within 15% when the linear velocity is below 130 m/s, showing good agreement.
(4) The experimental results show that the negative – pressure environment can effectively reduce the windage power loss of high – linear – velocity gears. At a negative pressure of 60 kPa (0.598 atm), it can increase the transmission efficiency of a 500 – kW high – linear – velocity gearbox by 0.69%.
In general, this research on the negative – pressure regulation method provides a new idea and technical support for reducing the windage power loss of high – linear – velocity gears, which is of great significance for improving the transmission efficiency and energy – saving performance of mechanical systems. Future research can further explore the combined application of negative – pressure regulation with other methods, as well as the influence of more complex working conditions on windage power loss, to continuously optimize the design and operation of high – linear – velocity gear systems.分享