
In recent years, the rapid expansion of urban areas has led to a significant increase in the demand for efficient and safe public transportation. Subway systems have become a primary mode of travel for millions of people. The safety of subway vehicles is paramount, and the transmission gearbox is a critical component that directly affects operational reliability. Among the various types of gears, the helical gear is widely used in subway vehicle transmissions due to its smooth meshing, high load capacity, and low noise. The bending fatigue life of helical gears determines maintenance intervals and overall operational costs. Therefore, accurately predicting the bending fatigue life and optimizing the gear design, particularly the profile shift coefficient, is of great practical importance.
In this work, I focused on the helical gear pair used in a subway vehicle transmission. I performed transient dynamic finite element analysis to obtain the tooth root stress distribution under actual operating conditions. I then developed a bending fatigue life prediction model based on linear cumulative damage theory and energy accumulation curves, validated through single-tooth bending fatigue tests. Furthermore, I investigated the influence of the profile shift coefficient on the bending fatigue life of helical gears. Finally, I optimized the gear pair using the equal-strength principle and the line chart method.
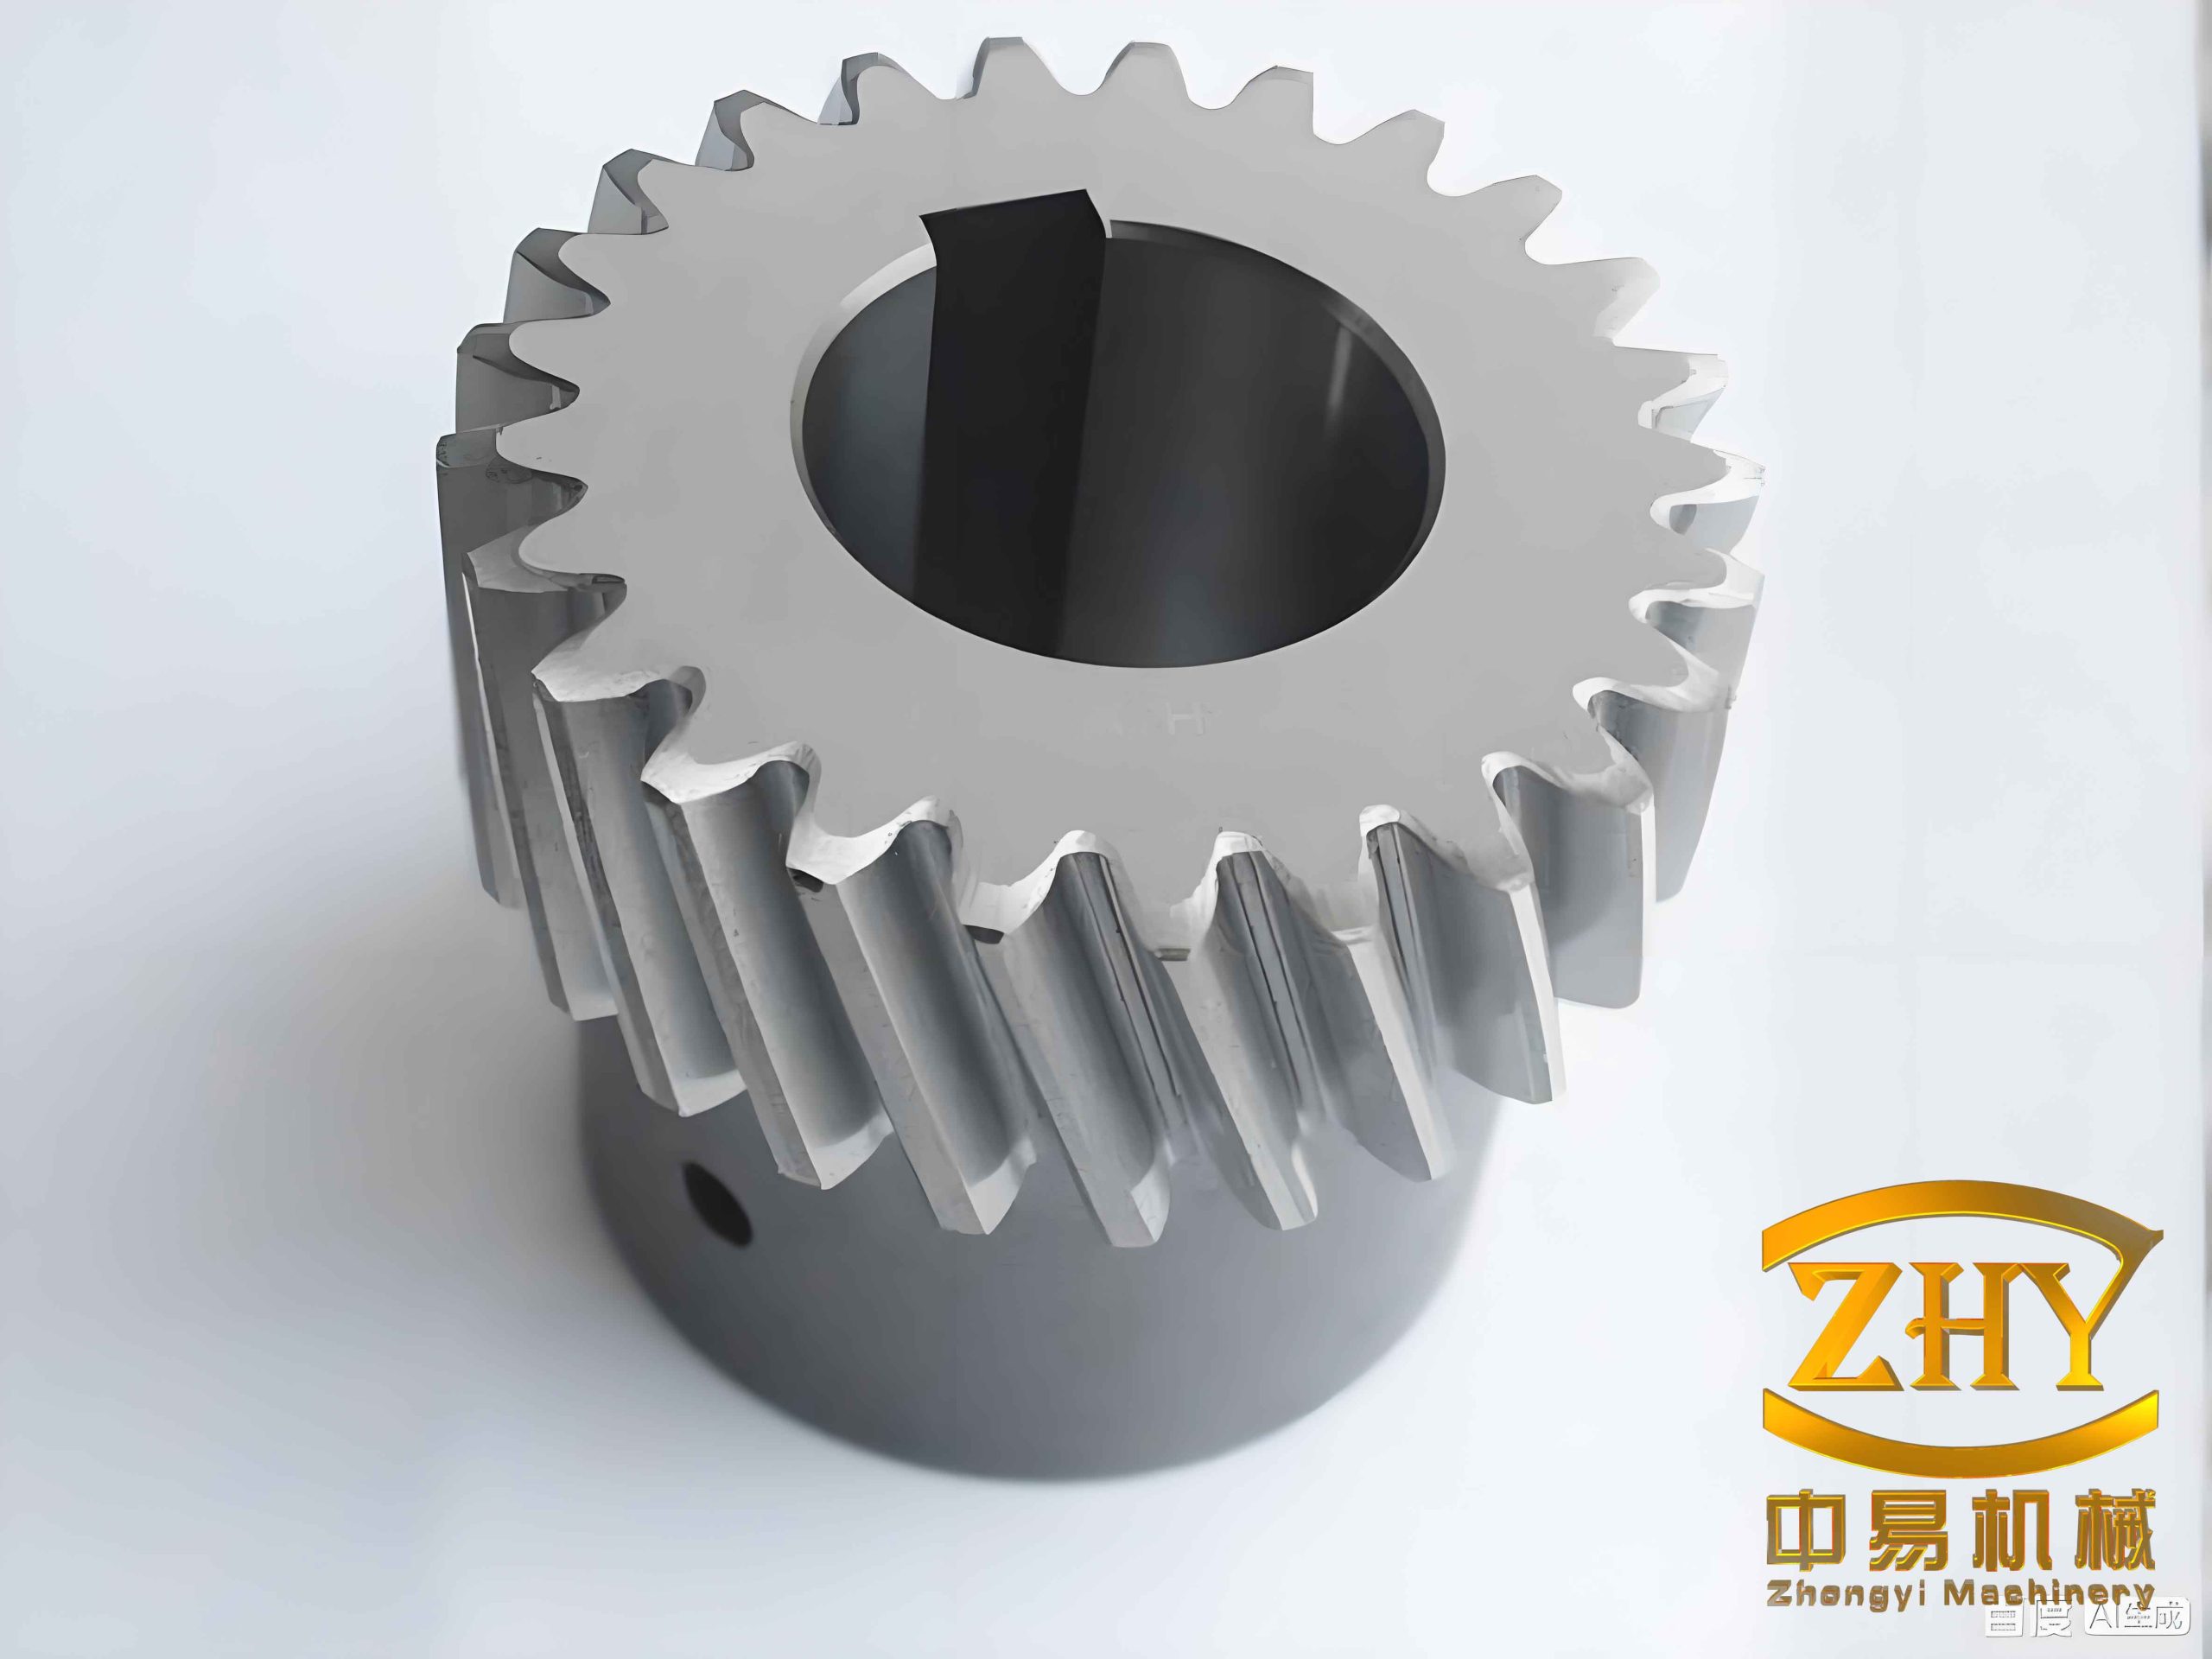
1. Finite Element Modeling and Transient Dynamic Analysis
To accurately predict the bending fatigue life of the helical gear, it is essential to determine the tooth root stress under real operating conditions. I established a three-dimensional model of the helical gear pair using the parameters of a subway vehicle gearbox. The gear parameters are listed in Table 1. The material is 18CrNiMo7-6, and its properties are given in Table 2. The chemical composition of this material is shown in Table 3. The gear pair has a module of 6 mm, a pressure angle of 20°, and a helix angle of 19°. The pinion has 18 teeth, while the wheel has 62 teeth. The face width of the pinion is 70 mm, and that of the wheel is 60 mm. The initial profile shift coefficients are 0.488 for the pinion and 0.257 for the wheel.
| Component | Module (mm) | Number of teeth | Pressure angle (°) | Face width (mm) | Helix angle (°) | Profile shift coefficient |
|---|---|---|---|---|---|---|
| Pinion | 6 | 18 | 20 | 70 | 19 | 0.488 |
| Wheel | 6 | 62 | 20 | 60 | 19 | 0.257 |
| Density (g/cm³) | Elastic modulus (GPa) | Poisson’s ratio | Fatigue limit (MPa) |
|---|---|---|---|
| 7.85 | 235 | 0.3 | 385.5 |
| C | Si | Mn | P | S | Cr | Ni | Mo |
|---|---|---|---|---|---|---|---|
| 0.18 | 0.25 | 0.60 | ≤0.025 | ≤0.015 | 1.65 | 1.55 | 0.30 |
I used a gear modeling plugin to generate the helical gear geometry and then imported it into Hypermesh for meshing. The contact region and tooth root were refined. The finite element model consisted of 147,050 elements and 191,109 nodes. The element type was C3D10, a ten-node quadratic tetrahedral element, which provides good accuracy for contact problems. The meshed model was then analyzed in ABAQUS using implicit dynamic analysis with geometric nonlinearity. The interaction between the gear teeth was defined as surface-to-surface contact with a friction coefficient of 0.1. A reference point was created at the center of each gear, and a coupling constraint was applied to the inner surface. The boundary conditions included a rotational speed applied to the pinion and a torque applied to the wheel.
The operating conditions of the subway vehicle were divided into four cases based on the traction characteristic curve and wheel circumferential traction force. The load parameters for each case are summarized in Table 4. In Case I, the vehicle speed is between 0 and 40 km/h, and the torque is 20,161 N·m. In Case II, the speed is 40–50 km/h, and the torque is 18,270 N·m. In Case III, the speed is 50–60 km/h, and the torque is 13,466 N·m. In Case IV, the speed is 60–80 km/h, and the torque is 8,400 N·m. The rotational speed of the pinion increases from 71.42 rad/s to 204.72 rad/s across these cases.
| Parameter | Case I | Case II | Case III | Case IV |
|---|---|---|---|---|
| Speed range (km/h) | 0–40 | 40–50 | 50–60 | 60–80 |
| Torque (N·m) | 20161 | 18270 | 13466 | 8400 |
| Rotational speed (rad/s) | 71.42 | 128.55 | 157.11 | 204.72 |
The transient dynamic analysis revealed that the helical gear pair operates in an alternating two-tooth and three-tooth meshing state. The two-tooth meshing state accounts for approximately 15% of the meshing cycle. The maximum tooth root bending stress under each operating condition is presented in Table 5. The maximum stress is 603.375 MPa in Case I, 472.877 MPa in Case II, 245.208 MPa in Case III, and 185.659 MPa in Case IV.
| Operating condition | Case I | Case II | Case III | Case IV |
|---|---|---|---|---|
| Maximum stress (MPa) | 603.375 | 472.877 | 245.208 | 185.659 |
From Table 5, I observed that the maximum tooth root bending stress is highest in Case I (0–40 km/h) and decreases as the vehicle speed increases. Only in Cases I and II does the maximum stress exceed the material fatigue limit of 385.5 MPa, meaning these two cases are the main contributors to bending fatigue damage. The location of the maximum stress shifts from the middle of the tooth root during three-tooth contact to the tooth root near the gear end face during two-tooth contact.
To further illustrate the stress variation, I extracted the stress history at the critical node. For Case III, the maximum stress during two-tooth meshing was 245.208 MPa, while during three-tooth meshing it was 222.022 MPa. For Case IV, the values were 185.659 MPa and 170.859 MPa, respectively. This confirms that the two-tooth meshing state produces higher tooth root stress. The stress difference between two-tooth and three-tooth meshing is about 10% in both cases. The stress distribution along the tooth root is non-uniform, with the highest stress occurring at the root fillet. The stress concentration factor at the root fillet is approximately 1.8, which is typical for helical gears with a pressure angle of 20°.
2. Bending Fatigue Life Prediction Model
Predicting the bending fatigue life of helical gears requires a robust damage accumulation model. The Palmgren-Miner linear cumulative damage theory is widely used in engineering. According to this theory, the damage caused by each stress cycle is independent and can be linearly summed. For a constant amplitude stress, the damage is:
$$ D = \frac{n}{N} $$
where \(n\) is the number of cycles and \(N\) is the fatigue life at that stress level. For multi-level loading, the total damage is:
$$ D = \sum_{i=1}^{k} \frac{n_i}{N_i} $$
When \(D\) reaches a critical value, typically 1, fatigue failure occurs. However, experimental data often show that the critical value can deviate from 1. To improve accuracy, the relative Miner theory uses an empirical critical value.
Nonlinear cumulative damage models, such as the Carten-Dolan model and the toughness dissipation model, have also been proposed. The Carten-Dolan model considers load interaction and defines damage as:
$$ D = m^c r^d $$
where \(m\) is the number of damage nuclei, \(r\) is the damage growth rate, and \(c\), \(d\) are material constants. The fatigue life is given by:
$$ N = \frac{N_1}{\sum_{i=1}^{k} \alpha_i \left( \frac{\sigma_i}{\sigma_1} \right)^d} $$
where \(\alpha_i\) is the cycle ratio and \(\sigma_i\) is the stress amplitude. The toughness dissipation model uses the reduction of material toughness to define damage:
$$ D = -\frac{1}{\ln N_f} \ln \left( 1 – \frac{n}{N_f} \right) $$
To develop a more accurate model for helical gears, I conducted single-tooth bending fatigue tests. The test gear had 22 teeth, module 5 mm, face width 10 mm, and was made of 18CrNiMo7-6. The fatigue limit at \(10^7\) cycles was 500.40 MPa. I performed crack propagation tests to determine the crack initiation life and propagation life. The results are shown in Table 6. The initiation life accounted for more than 92.33% of the total fatigue life, while the propagation life was less than 7.66%. This indicates that the large crack propagation stage is very short, and the fatigue life can be approximated by the crack initiation life.
| Test number | Initiation life \(N_i\) (10⁴ cycles) | End-face crack length \(a_i\) (mm) | Face-width crack length \(a_i^*\) (mm) | Propagation life \(N_s\) (10⁴ cycles) | Total life \(N\) (10⁴ cycles) |
|---|---|---|---|---|---|
| 1 | 280.62 | 0.73 | 0.49 | 23.29 | 303.91 |
| 2 | 310.70 | 0.91 | 0.58 | 16.79 | 327.49 |
| 3 | 263.39 | 0.82 | 0.56 | 19.27 | 282.66 |
I then performed single-tooth bending fatigue tests under five stress levels. The applied loads and corresponding tooth root stresses are given in Table 7. The fatigue lives are also listed. The tests were conducted using a high-frequency bending fatigue testing machine. The loading frequency was approximately 150 Hz. Strain gauges were attached near the tooth root to measure the local strain. The gauge length was 3.6 mm by 3.9 mm. The strain signals were collected at a sampling rate of 2000 Hz.
| Stress level (MPa) | Applied load (kN) | Fatigue life (10⁴ cycles) |
|---|---|---|
| 510.00 | 79.18 | 890.06 |
| 541.25 | 84.12 | 356.53 |
| 572.50 | 89.08 | 92.11 |
| 603.75 | 94.04 | 39.95 |
| 635.00 | 99.02 | 11.60 |
Using strain gauge data, I calculated the energy accumulation in the crack initiation region. The energy accumulation curve can be expressed as:
$$ E = C_1 n^2 + C_2 n + C_3 $$
where \(n\) is the number of cycles in \(10^4\) cycles, and the coefficients are:
$$ C_1 = 1.134 \times 10^{-3} \sigma_m^{1.488} $$
$$ C_2 = -0.535 \sigma_m + 210.613 $$
$$ C_3 = 0.122 \sigma_m^2 – 146.33 \sigma_m + 43942.74 $$
The energy growth rate \(v_E\) is defined as:
$$ v_E = \frac{dE}{dN} $$
The energy growth acceleration \(a_E\) is:
$$ a_E = \frac{dv_E}{dN} $$
I found that \(a_E\) is constant for a given stress level. The relationship between \(a_E\) and stress can be fitted as:
$$ a_E = A_1 e^{-\sigma_m / t_1} + B_1 $$
where \(A_1 = 3.70758 \times 10^8\), \(t_1 = -29.20627\), and \(B_1 = -0.9293\). The cumulative energy at fracture, \(E^*\), decreases as the stress increases. It can be expressed as:
$$ E^* = A_0 e^{-\sigma_m / t_0} + B_0 $$
with \(A_0 = 4.13196 \times 10^{10}\), \(t_0 = 38.42801\), and \(B_0 = 41.29492\). Based on the Palmgren-Miner linear cumulative damage theory and the energy accumulation, the fatigue life \(N\) under constant stress \(\sigma_m\) can be predicted by:
$$ D = \frac{E}{E^*} = \frac{\int_0^N a_E n \, dn}{E^*} = 1 $$
which yields:
$$ N = \sqrt{\frac{2 E^*}{a_E}} $$
I validated the model by comparing predicted lives with experimental lives. The results are shown in Table 8. All predicted lives fell within a factor of 3 of the experimental lives, confirming the validity of the energy-based model for bending fatigue life prediction of helical gears.
| Stress level (MPa) | Predicted life (10⁴ cycles) | Experimental life (10⁴ cycles) | Ratio (Exp/Pred) |
|---|---|---|---|
| 510.00 | 537.67 | 890.06 | 1.66 |
| 541.25 | 140.04 | 356.53 | 2.55 |
| 572.50 | 50.30 | 92.11 | 1.83 |
| 603.75 | 18.96 | 39.95 | 2.11 |
| 635.00 | 7.30 | 11.60 | 1.59 |
3. Effect of Profile Shift Coefficient on Bending Fatigue Life
The profile shift coefficient is a critical design parameter that affects the bending strength and fatigue life of helical gears. I selected a range of profile shift coefficients based on established design charts. The total profile shift coefficient \(x_\Sigma\) and the distribution between pinion and wheel are constrained by avoidance of undercut, adequate top land thickness, contact ratio \(\varepsilon \geq 1.2\), and balanced sliding. The allowable range was:
$$ -0.3 \leq x_\Sigma \leq 1.7 $$
$$ 0.35 \leq x_1 \leq 0.65 $$
$$ -0.65 \leq x_2 \leq 1.15 $$
I created seven sets of single-tooth meshing models with different profile shift coefficients. The pairs are listed in Table 9. For each model, I applied a torque to the pinion to simulate the meshing load. The torque \(T_{sim}\) was calculated from the wheel torque \(T_2\), the gear ratio \(i\), and the total contact ratio \(\varepsilon_\gamma\):
$$ T_1 = \frac{T_2}{i} $$
$$ T_{sim} = \frac{T_1}{\varepsilon_\gamma} $$
The total contact ratio is the sum of the transverse contact ratio \(\varepsilon_\alpha\) and the overlap ratio \(\varepsilon_\beta\):
$$ \varepsilon_\gamma = \varepsilon_\alpha + \varepsilon_\beta $$
The transverse contact ratio is calculated from the lengths of the lines of action:
$$ \varepsilon_\alpha = \frac{\overline{B_1 B_2}}{p_b} $$
and the overlap ratio is:
$$ \varepsilon_\beta = \frac{b \sin \beta}{\pi m_n} $$
Using these formulas, I computed the applied torques for each profile shift pair, as shown in Table 10. The transverse contact ratio ranges from 1.3987 to 1.5040, while the overlap ratio is constant at 1.0363. The total contact ratio ranges from 2.4350 to 2.5403.
| Set | Pinion shift \(x_1\) | Wheel shift \(x_2\) |
|---|---|---|
| 1 | 0.35 | -0.65 |
| 2 | 0.40 | -0.35 |
| 3 | 0.45 | -0.05 |
| 4 | 0.50 | 0.25 |
| 5 | 0.55 | 0.55 |
| 6 | 0.60 | 0.85 |
| 7 | 0.65 | 1.15 |
| \(x_1\) | \(\varepsilon_\alpha\) | \(\varepsilon_\beta\) | \(\varepsilon_\gamma\) | \(T_{sim}\) (N·m) |
|---|---|---|---|---|
| 0.35 | 1.5040 | 1.0363 | 2.5403 | 2304.1 |
| 0.40 | 1.4496 | 1.0363 | 2.4859 | 2354.5 |
| 0.45 | 1.4180 | 1.0363 | 2.4543 | 2384.9 |
| 0.50 | 1.4023 | 1.0363 | 2.4386 | 2400.2 |
| 0.55 | 1.3987 | 1.0363 | 2.4350 | 2403.8 |
| 0.60 | 1.4041 | 1.0363 | 2.4404 | 2398.5 |
| 0.65 | 1.4167 | 1.0363 | 2.4530 | 2386.1 |
To validate the finite element model, I compared the calculated tooth root stress with the standard method in GB/T 3480. The tooth root stress \(\sigma_F\) is given by:
$$ \sigma_F = \sigma_{F0} K_A K_v K_{F\beta} K_{F\alpha} $$
where \(K_A\) is the application factor, \(K_v\) is the dynamic factor, \(K_{F\beta}\) is the face load distribution factor, and \(K_{F\alpha}\) is the transverse load distribution factor. The basic tooth root stress \(\sigma_{F0}\) is:
$$ \sigma_{F0} = \frac{F_t}{b m_n} Y_F Y_S Y_\beta $$
For the case \(x_1 = 0.35, x_2 = -0.65\), the comparison is shown in Table 11. The pinion stress from finite element analysis is 649.00 MPa, compared with 656.40 MPa from the standard method, giving an error of -1.127%. The wheel stress is 785.80 MPa, compared with 745.63 MPa, giving an error of 5.387%. These small errors confirm that the single-tooth meshing finite element model is accurate enough for tooth root stress calculation.
| Component | Finite element result (MPa) | Calculated result (MPa) | Error |
|---|---|---|---|
| Pinion | 649.00 | 656.40 | -1.127% |
| Wheel | 785.80 | 745.63 | 5.387% |
I then performed static analysis for all seven profile shift pairs. The tooth root stresses are summarized in Table 12. I observed that the pinion stress varies by about 10.9%, while the wheel stress varies by about 35.25%. The pinion stress first decreases and then increases, while the wheel stress decreases, then slightly increases, and finally decreases again. The maximum stress location on the wheel is always at the root position corresponding to the farthest point of the line of action from the root. For the pinion, the maximum stress location can be either at that same position or at about one-third of the distance from the near end to the far end of the line of action.
| Pinion \(x_1\) | Pinion stress (MPa) | Wheel \(x_2\) | Wheel stress (MPa) |
|---|---|---|---|
| 0.35 | 649.0 | -0.65 | 785.8 |
| 0.40 | 645.7 | -0.35 | 710.0 |
| 0.45 | 646.2 | -0.05 | 628.8 |
| 0.50 | 648.8 | 0.25 | 676.9 |
| 0.55 | 590.3 | 0.55 | 618.3 |
| 0.60 | 648.8 | 0.85 | 516.8 |
| 0.65 | 662.5 | 1.15 | 508.8 |
Next, I imported the ABAQUS results into FE-Safe to perform fatigue analysis. I used the Smith-Watson-Topper stress correction method, suitable for uniaxial high-cycle fatigue. The bending fatigue lives for each profile shift pair are listed in Table 13. The pinion life varies by a factor of about 3.15, while the wheel life varies by a factor of about 22.3. The pinion life reaches \(10^7\) cycles at \(x_1 = 0.55\), and the wheel life reaches \(10^7\) cycles at \(x_2 = 0.85\) and \(1.15\). These results provide the basis for optimizing the helical gear pair.
| Pinion \(x_1\) | Pinion life (cycles) | Wheel \(x_2\) | Wheel life (cycles) |
|---|---|---|---|
| 0.35 | 4,016,000 | -0.65 | 448,400 |
| 0.40 | 4,259,000 | -0.35 | 1,437,000 |
| 0.45 | 4,220,000 | -0.05 | 5,837,000 |
| 0.50 | 4,039,000 | 0.25 | 2,492,000 |
| 0.55 | 10,000,000 | 0.55 | 7,026,000 |
| 0.60 | 4,032,000 | 0.85 | 10,000,000 |
| 0.65 | 3,179,000 | 1.15 | 10,000,000 |
4. Optimization of Helical Gear Pair for Fatigue Performance
Based on the finite element results, I constructed line charts of tooth root stress versus profile shift coefficient and bending fatigue life versus profile shift coefficient. These charts allow the selection of optimal profile shift coefficients that balance the strength and life of the pinion and wheel. I validated the line chart method by selecting intermediate profile shift pairs and comparing the predicted stress and life with finite element simulations. The validation results are shown in Table 14 and Table 15.
| Profile shift pair | Component | Predicted stress (MPa) | Simulated stress (MPa) | Error |
|---|---|---|---|---|
| \(x_1=0.438, x_2=-0.121\) | Pinion | 647 | 652.9 | 0.91% |
| \(x_1=0.438, x_2=-0.121\) | Wheel | 647 | 637.2 | -1.51% |
| \(x_1=0.469, x_2=0.065\) | Pinion | 647 | 646.9 | -0.02% |
| \(x_1=0.469, x_2=0.065\) | Wheel | 647 | 654.6 | 1.17% |
| Profile shift pair | Component | Predicted life (cycles) | Simulated life (cycles) | Error |
|---|---|---|---|---|
| \(x_1=0.438, x_2=-0.121\) | Pinion | 4.2e6 | 3.751e6 | -10.69% |
| \(x_1=0.438, x_2=-0.121\) | Wheel | 4.2e6 | 4.988e6 | 18.76% |
| \(x_1=0.469, x_2=0.065\) | Pinion | 4.2e6 | 4.175e6 | -0.59% |
| \(x_1=0.469, x_2=0.065\) | Wheel | 4.2e6 | 3.662e6 | -12.8% |
The maximum stress error was 1.51%, and the maximum life error was 18.76%. These errors are acceptable, confirming the line chart method can predict the tooth root stress and bending fatigue life of helical gears with different profile shift coefficients. Using the line chart method, I identified two optimization strategies: equal strength and equal life. For equal strength, I selected the profile shift pair where the pinion and wheel tooth root stresses are equal and minimized: \(x_1 = 0.559, x_2 = 0.603\), with a predicted maximum stress of 601 MPa. For equal life, I selected the pair where the pinion and wheel bending fatigue lives are equal and maximized: \(x_1 = 0.564, x_2 = 0.635\), with a predicted life of \(7.7 \times 10^6\) cycles. I then performed finite element simulations for both optimized pairs. The results are compared with the original gear pair in Table 16.
| Gear pair | Pinion life (cycles) | Wheel life (cycles) | Combined life (cycles) | Improvement factor |
|---|---|---|---|---|
| Original \(x_1=0.488, x_2=0.257\) | 4.039e6 | 2.492e6 | 2.492e6 | 1.00 |
| Equal strength \(x_1=0.559, x_2=0.603\) | 10e7 | 8.199e6 | 8.199e6 | 3.29 |
| Equal life \(x_1=0.564, x_2=0.635\) | 7.624e6 | 10e7 | 7.624e6 | 3.06 |
The equal strength optimization yielded a combined fatigue life of \(8.199 \times 10^6\) cycles, which is 3.29 times the original life. The equal life optimization yielded \(7.624 \times 10^6\) cycles, or 3.06 times the original. Therefore, the equal strength principle is preferred when using the line chart method for helical gear optimization. I also analyzed the transmission quality of the optimized gear pair. The contact ratio was calculated as:
$$ \varepsilon_\alpha = 1.3990, \quad \varepsilon_\beta = 1.0363, \quad \varepsilon_\gamma = 2.4353 $$
The overlap ratio is close to an integer (1.0363), which means the contact line length does not vary dramatically during meshing. The total contact ratio is 2.4353, indicating smooth transmission with multiple teeth in contact simultaneously. This satisfies the requirements for subway vehicle operation. Noise analysis showed that the optimized helical gear pair does not introduce additional noise compared to the original design, ensuring passenger comfort. The smooth meshing and low noise are attributed to the high contact ratio and the helical gear geometry, which distributes the load over multiple teeth and provides a gradual engagement.
5. Conclusions and Future Work
In this work, I investigated the bending fatigue life prediction and optimization of helical gears for subway vehicle transmission. The main conclusions are as follows:
(1) The helical gear pair operates in alternating two-tooth and three-tooth meshing states. The two-tooth state accounts for about 15% of the cycle and produces higher tooth root stress. Only in the speed range of 0–50 km/h does the maximum tooth root stress exceed the material fatigue limit, making this range the primary contributor to bending fatigue damage.
(2) Single-tooth bending fatigue tests showed that crack initiation life accounts for more than 92% of the total fatigue life. Therefore, predicting the initiation life is sufficient for fatigue life estimation. The energy-based prediction model, using the Palmgren-Miner linear cumulative damage theory and energy accumulation curves, predicted fatigue lives within a factor of 3 of experimental values.
(3) The single-tooth meshing finite element model accurately calculated tooth root stress, with errors of -1.127% for the pinion and 5.387% for the wheel compared with GB/T 3480.
(4) The profile shift coefficient significantly affects the tooth root stress and bending fatigue life of helical gears. The wheel stress is more sensitive to the shift coefficient than the pinion stress. The maximum stress location on the wheel is always at the root corresponding to the farthest point of the line of action.
(5) The line chart method predicted tooth root stress with errors between 0.02% and 1.51%, and bending fatigue life with errors between 0.59% and 18.76%. This method is accurate enough for engineering design.
(6) Using the equal strength principle and the line chart method, the optimized helical gear pair achieved a combined fatigue life 3.29 times that of the original design. The optimized gear pair also has a contact ratio of 2.4353 and maintains low noise, meeting the operational requirements of subway vehicles.
Future work should extend the study to other tooth numbers and gear sizes to generalize the findings. Additionally, bending fatigue tests on actual helical gears, rather than equivalent spur gears, should be conducted to further validate the prediction model. The effect of other design parameters, such as helix angle and face width, on bending fatigue life should also be explored. Furthermore, the influence of manufacturing errors and surface treatments on the bending fatigue life of helical gears could be investigated to provide a more comprehensive design guideline.
Overall, this research provides a comprehensive framework for predicting and optimizing the bending fatigue life of helical gears in subway vehicle transmissions, contributing to safer and more reliable urban rail transit systems.