
I began this investigation from a practical observation: a face gear transmission can carry high loads in a compact envelope, yet its tooth surface remains vulnerable to friction, wear, and lubrication breakdown. Because a face gear meshes with a cylindrical pinion in a point-contact manner that becomes an elliptical contact zone under load, the lubrication state is highly transient. I therefore asked whether a bio-inspired microtexture could be placed directly on the face gear tooth surface to store oil, trap debris, reduce stress concentration, and generate stronger hydrodynamic pressure. The work below reports my design, simulation, and experimental study of a bionic microtexture for face gear tooth surfaces.
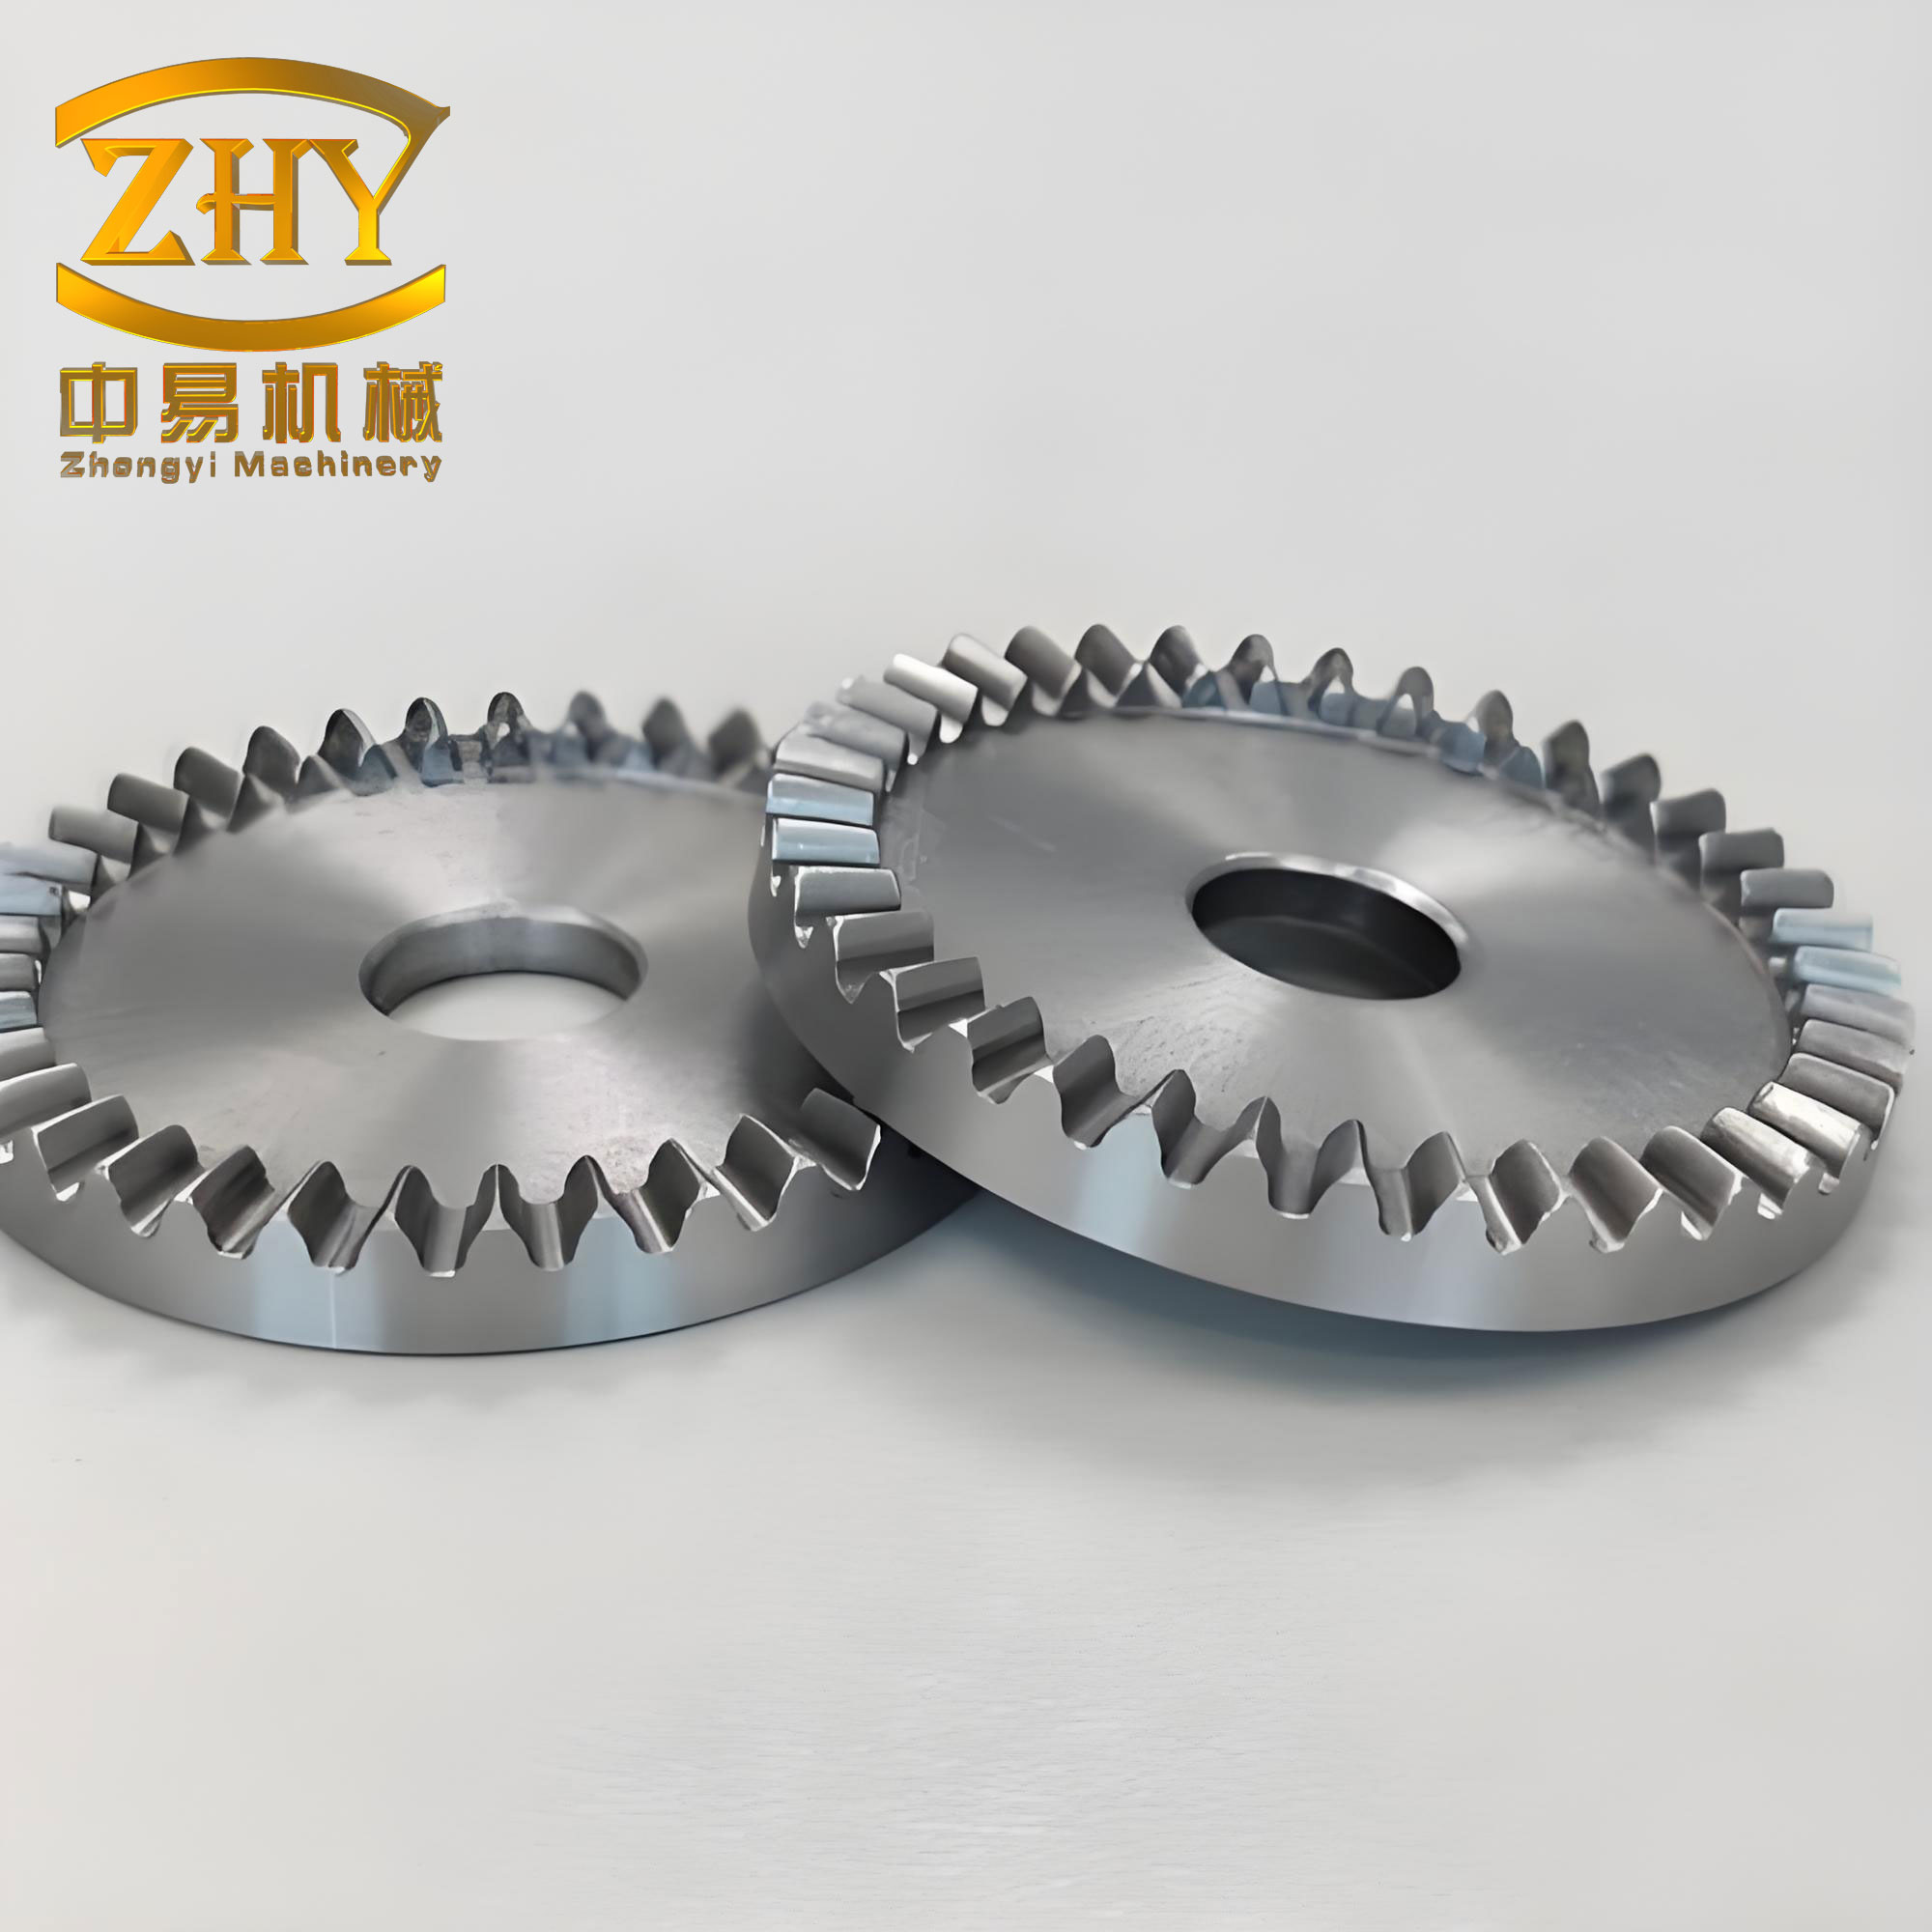
Background and Motivation
Friction is not a minor loss in a gearbox. It directly controls efficiency, temperature rise, surface durability, vibration, and service life. In a face gear pair, the contact path sweeps across a complex curved tooth surface, and the sliding velocity varies with both input speed and output torque. Under high-speed and heavy-load conditions, the oil film may become thin, starved, or locally broken. When that happens, asperities contact, wear particles are generated, and the resulting debris can plough the face gear tooth surface. This creates a feedback loop: more debris produces more wear, more wear changes the contact geometry, and the face gear loses precision and load capacity.
The face gear is especially important because it offers a combination of advantages that are difficult to obtain with other right-angle transmissions. I summarize the main advantages in Table 1.
| Face Gear Characteristic | Consequence for Transmission Design |
|---|---|
| Low axial positioning sensitivity | Installation and adjustment are simpler than for a bevel gear pair. |
| Large contact ratio | Load is shared over more teeth, giving smoother motion and lower noise. |
| Small transmission error | The theoretical ratio can remain nearly constant, reducing vibration excitation. |
| High load capacity | The pinion experiences little or no axial force, so support structures can be lighter. |
| Light weight and compact size | Useful in aerospace and rotorcraft systems where mass is critical. |
| Large single-stage ratio | Fewer stages may be needed, reducing overall transmission volume. |
These advantages explain why face gear drives have been adopted or considered for rotorcraft main transmissions, turboshaft engines, automotive center differentials, door mechanisms, fishing reels, and other right-angle power paths. However, the same geometric features that make the face gear attractive also make its tribology difficult. The tooth surface is a high-order complex surface. The contact is non-conformal. The entrainment velocity changes along the contact path. A uniform texture strategy is therefore unlikely to work. I needed a texture that could adapt to the local flow direction, retain oil, and avoid creating sharp stress raisers.
Surface Microtexture Concepts
Surface microtextures are deliberately fabricated micro-scale geometric features such as dimples, grooves, bumps, or bristles. They can store lubricant, trap wear debris, reduce real contact area, generate hydrodynamic pressure, and modify wettability. I compared the main texture families before choosing a geometry for the face gear tooth surface. Table 2 gives the comparison.
| Texture Type | Advantages | Limitations | Suitability for Face Gear |
|---|---|---|---|
| Dimple / pit | Stores oil and debris; produces local hydrodynamic effect; lower stress concentration than bumps. | Debris can accumulate if not flushed; excessive depth can reduce load capacity. | High |
| Groove | Easy to fabricate; guides oil; helps debris escape. | Open geometry can cause oil loss and pressure leakage; weaker hydrodynamic lift. | Moderate |
| Bump / protrusion | Reduces contact area; can improve oil flow. | Carries load directly; stress concentration; often requires additive manufacturing. | Low |
| Bristle / hair-like | Compliant contact; possible self-cleaning. | Wear, detachment, and deformation; difficult to fabricate on a gear tooth. | Low |
For a face gear, the most promising route is a dimple-type texture with an asymmetric surface shape and inclined walls. A dimple can act as a micro-reservoir for oil and debris. An asymmetric shape can create a converging wedge in the flow direction, which raises hydrodynamic pressure. Inclined walls can reduce stress concentration and help debris leave the texture. This combination is exactly what I pursued.
Bionic Design of the Face Gear Microtexture
I drew inspiration from two biological surfaces. The first is the lip of a pitcher plant, which contains duckbill-shaped pits. Those pits can retain a thin liquid film and reduce direct contact between the plant surface and an insect foot. The second is the back of a desert scorpion, which contains V-shaped grooves with inclined walls. Those grooves can reduce stress concentration, inhibit crack propagation, and help sand particles escape. I extracted the essential features of both surfaces and fused them into one bionic microtexture for the face gear tooth surface.
The resulting texture has a duckbill-like outline on the surface and a V-shaped or trapezoidal cross-section. The surface outline is formed by two parabolic curves and two straight boundaries. The cross-section is controlled by an inclined wall angle. The geometric parameters are listed in Table 3.
| Parameter | Meaning | Range Used in This Study |
|---|---|---|
| \(l_1\) | Total length of the bionic texture | 500–700 μm |
| \(l_2\) | Top length of the bionic texture | 200–400 μm |
| \(w_1\) | Total width of the bionic texture | 500–700 μm |
| \(w_2\) | Tail width of the bionic texture | 20–100 μm |
| \(h\) | Texture depth | 4–8 μm |
| \(\theta\) | Inclined wall angle | 0°, 30°, 60°, and V-shape |
| \(L\) | Center-to-center spacing | 1000 μm |
I described the surface outline with parabolic functions. For the first curve, I used a form that spans the total length and total width:
$$
y_1(x)=-\frac{4w_1}{l_1^2}x^2+\frac{4w_1}{l_1}x-\frac{w_1}{2},
\quad 0\le x\le l_1.
$$
For the second curve, which forms the narrower tail region, I used:
$$
y_2(x)=-\frac{4w_2}{(l_1-l_2)^2}(x-l_1+l_2)^2+\frac{4w_2}{l_1-l_2}(x-l_1+l_2)-\frac{w_2}{2},
\quad l_1-l_2\le x\le l_1.
$$
The projected area of one bionic texture unit can be estimated as:
$$
S_V=\frac{l_1w_1}{2}+\frac{l_2w_2}{2}-\frac{(l_1-l_2)(w_1-w_2)}{2}.
$$
The area density on the face gear tooth surface is then:
$$
S_p=\frac{S_V}{L^2}.
$$
I kept the area density below approximately twenty percent so that the face gear tooth surface would retain enough load-bearing area. If the texture were too large, the face gear would lose contact area and could vibrate; if it were too small, the texture would not store enough oil or produce a useful hydrodynamic effect. The bionic shape was therefore a compromise between reservoir volume, wedge effect, debris escape, and structural integrity.
Governing Equations for Lubrication of a Textured Face Gear Tooth Surface
To model the oil film on a textured face gear tooth surface, I started from the Navier–Stokes equations. The general vector form is:
$$
\rho\left(\frac{\partial \mathbf{u}}{\partial t}+\mathbf{u}\cdot\nabla\mathbf{u}\right)=-\nabla p+\mu\nabla^2\mathbf{u}+\mathbf{f}.
$$
I made the following assumptions. The lubricant is incompressible and Newtonian. The flow is steady. Body forces are negligible. The density and dynamic viscosity are constant. The no-slip condition applies at the walls. Under these assumptions, the continuity equation becomes:
$$
\nabla\cdot\mathbf{u}=0.
$$
The momentum equation reduces to:
$$
\mathbf{u}\cdot\nabla\mathbf{u}=-\frac{1}{\rho}\nabla p+\nu\nabla^2\mathbf{u}.
$$
For a two-dimensional texture cross-section, the velocity vector is \(\mathbf{u}=(u_x,u_y)\). The continuity equation is:
$$
\frac{\partial u_x}{\partial x}+\frac{\partial u_y}{\partial y}=0.
$$
The momentum equations in the \(x\) and \(y\) directions are:
$$
u_x\frac{\partial u_x}{\partial x}+u_y\frac{\partial u_x}{\partial y}
=
-\frac{1}{\rho}\frac{\partial p}{\partial x}
+
\nu\left(\frac{\partial^2 u_x}{\partial x^2}+\frac{\partial^2 u_x}{\partial y^2}\right),
$$
$$
u_x\frac{\partial u_y}{\partial x}+u_y\frac{\partial u_y}{\partial y}
=
-\frac{1}{\rho}\frac{\partial p}{\partial y}
+
\nu\left(\frac{\partial^2 u_y}{\partial x^2}+\frac{\partial^2 u_y}{\partial y^2}\right).
$$
For the three-dimensional case, the velocity vector is \(\mathbf{u}=(u_x,u_y,u_z)\). The continuity equation becomes:
$$
\frac{\partial u_x}{\partial x}+\frac{\partial u_y}{\partial y}+\frac{\partial u_z}{\partial z}=0.
$$
The three momentum equations are:
$$
u_x\frac{\partial u_x}{\partial x}+u_y\frac{\partial u_x}{\partial y}+u_z\frac{\partial u_x}{\partial z}
=
-\frac{1}{\rho}\frac{\partial p}{\partial x}
+
\nu\left(\frac{\partial^2 u_x}{\partial x^2}+\frac{\partial^2 u_x}{\partial y^2}+\frac{\partial^2 u_x}{\partial z^2}\right),
$$
$$
u_x\frac{\partial u_y}{\partial x}+u_y\frac{\partial u_y}{\partial y}+u_z\frac{\partial u_y}{\partial z}
=
-\frac{1}{\rho}\frac{\partial p}{\partial y}
+
\nu\left(\frac{\partial^2 u_y}{\partial x^2}+\frac{\partial^2 u_y}{\partial y^2}+\frac{\partial^2 u_y}{\partial z^2}\right),
$$
$$
u_x\frac{\partial u_z}{\partial x}+u_y\frac{\partial u_z}{\partial y}+u_z\frac{\partial u_z}{\partial z}
=
-\frac{1}{\rho}\frac{\partial p}{\partial z}
+
\nu\left(\frac{\partial^2 u_z}{\partial x^2}+\frac{\partial^2 u_z}{\partial y^2}+\frac{\partial^2 u_z}{\partial z^2}\right).
$$
These equations are still difficult to solve analytically for a textured face gear tooth surface. I therefore non-dimensionalized them. I defined the following dimensionless variables:
$$
x^*=\frac{x}{L},\quad y^*=\frac{y}{L},\quad z^*=\frac{z}{L},
$$
$$
u_x^*=\frac{u_x}{U},\quad u_y^*=\frac{u_y}{U},\quad u_z^*=\frac{u_z}{U},
$$
$$
p^*=\frac{p}{P_0},\quad P_0=\frac{\rho\nu U}{L},\quad Re=\frac{UL}{\nu}.
$$
After substitution, the two-dimensional dimensionless momentum equations take the form:
$$
Re\left(u_x^*\frac{\partial u_x^*}{\partial x^*}+u_y^*\frac{\partial u_x^*}{\partial y^*}\right)
=
-\frac{\partial p^*}{\partial x^*}
+
\frac{\partial^2 u_x^*}{\partial x^{*2}}
+
\frac{\partial^2 u_x^*}{\partial y^{*2}},
$$
$$
Re\left(u_x^*\frac{\partial u_y^*}{\partial x^*}+u_y^*\frac{\partial u_y^*}{\partial y^*}\right)
=
-\frac{\partial p^*}{\partial y^*}
+
\frac{\partial^2 u_y^*}{\partial x^{*2}}
+
\frac{\partial^2 u_y^*}{\partial y^{*2}}.
$$
The three-dimensional dimensionless equations follow the same pattern with the additional \(z^*\) derivative. These equations formed the basis of my CFD models.
I also introduced dimensionless texture parameters:
$$
h^*=\frac{h}{H},\quad l_1^*=\frac{l_1}{L},\quad l_2^*=\frac{l_2}{L},\quad w_1^*=\frac{w_1}{L},\quad w_2^*=\frac{w_2}{L}.
$$
In my simulations, the film thickness was \(H=10\ \mu\text{m}\). The dimensionless depth ranged from \(h^*=0.4\) to \(h^*=0.8\). The dimensionless lengths and widths ranged from 0.2 to 0.7 depending on the parameter.
CFD Model of the Textured Face Gear Contact
In a real face gear pair, the contact between the face gear and the cylindrical pinion is a point contact that becomes an ellipse under load. The texture size is much smaller than the contact ellipse. I therefore treated the local contact as two nearly parallel plates. The lower plate represented the textured face gear tooth surface and remained fixed. The upper plate represented the mating pinion surface and moved with velocity \(U\). The oil film thickness was \(H\). The texture depth was \(h\). The texture spacing was \(L\). This simplified model allowed me to isolate the effect of the bionic texture on the oil film.
I used the following boundary conditions for the two-dimensional model. The lower wall was a no-slip stationary wall. The upper wall was a no-slip moving wall with velocity \(U=10\ \text{m/s}\) in the positive \(x\) direction. The left and right boundaries were periodic, simulating an infinite array of identical texture units. For the three-dimensional model, I added symmetry boundaries on the sides parallel to the flow direction. Table 4 summarizes the simulation settings.
| Item | Setting |
|---|---|
| Lubricant | Aviation gear oil |
| Density | \(870\ \text{kg/m}^3\) |
| Dynamic viscosity | \(0.0083\ \text{Pa}\cdot\text{s}\) |
| Temperature | \(25^\circ\text{C}\) |
| Upper wall velocity | \(10\ \text{m/s}\) |
| Film thickness \(H\) | \(10\ \mu\text{m}\) |
| Flow regime | Laminar, because \(Re \approx 1048 < 2300\) |
| Pressure–velocity coupling | SIMPLE |
| Pressure discretization | Second order |
| Momentum discretization | QUICK |
| 2D mesh type | Quadrilateral with boundary layers |
| 3D mesh type | Tetrahedral with boundary layers |
| First boundary layer height | \(0.12\ \mu\text{m}\) |
| Boundary layer growth rate | 1.2 |
| Number of boundary layers | 5 |
Mesh independence was essential. For the two-dimensional model, the dynamic performance parameter changed by less than one percent when the mesh exceeded 20,474 cells. For the three-dimensional model, the same criterion was reached above 3,191,026 cells. These mesh sizes were used for the final simulations.
I evaluated lubrication with three quantities. The first was the oil film load capacity:
$$
F_y=\int p\,dx.
$$
The second was the wall friction force:
$$
F_x=\int \tau\,dx.
$$
The third was the dynamic pressure performance parameter:
$$
f=\frac{F_y}{F_x}.
$$
The corresponding dimensionless quantities were:
$$
F_x^*=\frac{F_xH^2}{S\mu UL},\quad F_y^*=\frac{F_yH^2}{S\mu UL}.
$$
A higher \(F_y\), a higher \(F_y^*\), and a higher \(f\) indicate better hydrodynamic lubrication. A lower \(F_x\) or \(F_x^*\) indicates lower friction. In my results, the texture shape and size strongly affected \(F_y\) and \(f\), while \(F_x\) remained almost constant for the cases I studied.
Two-Dimensional CFD Results for the Face Gear Texture Cross-Section
I first studied the texture cross-section. I compared four wall geometries: rectangular, trapezoidal type I, trapezoidal type II, and V-shaped. Table 5 summarizes the qualitative trend. The rectangular cross-section produced the highest pressure amplitude. The trapezoidal type I was slightly lower. The trapezoidal type II was lower still. The V-shaped cross-section produced the smallest pressure amplitude.
| Cross-Section Shape | Wall Angle | Pressure Amplitude | Dynamic Performance | Vortex Behavior |
|---|---|---|---|---|
| Rectangular | \(0^\circ\) | Highest | Best | Large stable vortices at inlet and outlet |
| Trapezoidal I | \(30^\circ\) | Slightly lower | Good | Vortices move inward and shrink |
| Trapezoidal II | \(60^\circ\) | Lower | Moderate | Smaller vortices near center |
| V-shaped | Maximum | Lowest | Lowest | Large low-speed vortex at the bottom |
The smooth face gear surface produced an almost uniform pressure. That means it did not generate strong local hydrodynamic lift. The textured surfaces produced alternating positive and negative pressure zones. The positive zone occurred where the oil was forced into a converging gap. The negative zone occurred where the flow expanded. Because the bionic texture was asymmetric, the positive pressure was not fully cancelled by the negative pressure. This asymmetry is important for a face gear, because the entrainment direction changes only slightly over a local contact region but the load must still be supported.
Depth had a strong effect. For rectangular and trapezoidal cross-sections, the pressure amplitude first increased and then decreased as depth increased. The optimal depth depended on width. For narrower textures, the optimum was around \(h^*=0.5\). For wider textures, the optimum shifted to \(h^*=0.6\). For the V-shaped cross-section, the pressure amplitude increased with depth and then plateaued. Table 6 summarizes the depth trend.
| Texture Shape | Depth Trend | Optimal Depth | Reason |
|---|---|---|---|
| Rectangular | Increases then decreases | \(h^*=0.5\) to \(0.6\) | Balance between wedge effect and vortex loss |
| Trapezoidal I | Increases then decreases | \(h^*=0.5\) to \(0.6\) | Similar to rectangular but smoother flow |
| Trapezoidal II | Increases then decreases | \(h^*=0.5\) to \(0.6\) | Reduced vortex strength |
| V-shaped | Increases then plateaus | Higher depth | Bottom vortex limits further gain |
Width had a more monotonic effect. For all cross-sections, the pressure amplitude increased with width. The rectangular and trapezoidal cases improved at similar rates. The V-shaped case improved more slowly. As depth increased, the differences among cross-sections became smaller. This suggests that once the texture is deep enough, the flow pattern is dominated by the overall depth and width rather than by the detailed wall angle.
The dynamic performance parameter followed the same trend as the pressure amplitude. The dimensionless load capacity increased with width and with the optimal depth, while the dimensionless friction force remained nearly constant. This is a useful result for face gear design: the main benefit of the texture is not a direct reduction of viscous shear in the cross-section, but an increase in hydrodynamic load support. That load support reduces the probability of asperity contact and thus lowers the risk of wear on the face gear tooth surface.
Streamline analysis explained the mechanism. At the texture inlet and outlet, recirculating vortices formed. These vortices consumed kinetic energy and reduced local pressure. A rectangular texture produced large, stable vortices. A trapezoidal texture guided the flow and reduced the vortex area. A V-shaped texture produced a large low-speed vortex at the bottom, which was detrimental to dynamic pressure. The optimal cross-section therefore had to balance two effects: a converging wedge that raises pressure, and a vortex structure that does not dissipate too much energy. For my face gear application, the trapezoidal type I with \(\theta=30^\circ\) gave the best compromise. It retained strong pressure generation while offering an inclined wall for stress reduction and debris escape.
Three-Dimensional CFD and Orthogonal Optimization
After the two-dimensional study, I carried out three-dimensional simulations of the full bionic texture. The three-dimensional model included the duckbill surface outline and the optimized cross-section. Because a full factorial study would be expensive, I used an orthogonal array. The factors were the dimensionless total length \(l_1^*\), the dimensionless total width \(w_1^*\), and the dimensionless tail width \(w_2^*\). I used five levels for each factor. The standard orthogonal array with three factors and five levels is not available, so I used an \(L_{25}\) array with virtual factors. Table 7 shows the orthogonal design.
| Run | \(l_1^*\) | \(w_1^*\) | \(w_2^*\) |
|---|---|---|---|
| 1 | 0.50 | 0.50 | 0.02 |
| 2 | 0.50 | 0.55 | 0.06 |
| 3 | 0.50 | 0.60 | 0.10 |
| 4 | 0.50 | 0.65 | 0.04 |
| 5 | 0.50 | 0.70 | 0.08 |
| 6 | 0.55 | 0.50 | 0.10 |
| 7 | 0.55 | 0.55 | 0.04 |
| 8 | 0.55 | 0.60 | 0.08 |
| 9 | 0.55 | 0.65 | 0.02 |
| 10 | 0.55 | 0.70 | 0.06 |
| 11 | 0.60 | 0.50 | 0.08 |
| 12 | 0.60 | 0.55 | 0.02 |
| 13 | 0.60 | 0.60 | 0.06 |
| 14 | 0.60 | 0.65 | 0.10 |
| 15 | 0.60 | 0.70 | 0.04 |
| 16 | 0.65 | 0.50 | 0.06 |
| 17 | 0.65 | 0.55 | 0.10 |
| 18 | 0.65 | 0.60 | 0.04 |
| 19 | 0.65 | 0.65 | 0.08 |
| 20 | 0.65 | 0.70 | 0.02 |
| 21 | 0.70 | 0.50 | 0.04 |
| 22 | 0.70 | 0.55 | 0.08 |
| 23 | 0.70 | 0.60 | 0.02 |
| 24 | 0.70 | 0.65 | 0.06 |
| 25 | 0.70 | 0.70 | 0.10 |
I compared the bionic texture with circular, square, and groove textures at the same area density. The bionic texture produced the highest positive pressure and the largest difference between positive and negative pressure. Table 8 summarizes the comparison.
| Texture Shape | Pressure Distribution | Positive–Negative Difference | Load Capacity | Dynamic Performance |
|---|---|---|---|---|
| Circular | Nearly symmetric | Small | Moderate | Moderate |
| Square | Nearly symmetric | Small | Moderate | Moderate |
| Groove | Connected and leaky | Smallest | Low | Low |
| Bionic | Asymmetric and converging | Large | High | Highest |
The bionic texture generated a positive pressure amplitude of about \(16000\ \text{Pa}\). The circular and square textures were near \(13000\ \text{Pa}\). The groove texture was only about \(6000\ \text{Pa}\). The bionic texture also had a positive-to-negative pressure difference of about \(12000\ \text{Pa}\), which means it did not cancel its own load support. The groove texture suffered from pressure leakage because its open geometry allowed oil to escape. This is a critical finding for a face gear: an open groove may help debris escape, but it can also weaken hydrodynamic lift. The bionic dimple retained the debris-storage benefit while preserving a closed, converging pressure zone.
I then analyzed the orthogonal results with the range method. Table 9 gives the range analysis.
| Factor | Level 1 Average | Level 2 Average | Level 3 Average | Level 4 Average | Level 5 Average | Range \(R\) | Rank |
|---|---|---|---|---|---|---|---|
| \(l_1^*\) | 7.60 | 6.64 | 5.75 | 5.00 | 4.04 | 3.55 | 1 |
| \(w_1^*\) | 5.97 | 5.93 | 5.85 | 5.79 | 5.71 | 0.34 | 3 |
| \(w_2^*\) | 5.29 | 5.55 | 5.76 | 6.11 | 6.33 | 1.04 | 2 |
The total length \(l_1^*\) had the largest effect. Shorter total length produced better dynamic performance. The tail width \(w_2^*\) was the second most important factor. A larger tail width increased the effective inlet area and allowed more oil to enter the texture, which raised the pressure at the outlet. The total width \(w_1^*\) had the smallest effect. Based on the range analysis, the best combination was \(l_1^*=0.5\), \(w_1^*=0.5\), and \(w_2^*=0.1\). Together with the two-dimensional optimum of \(h^*=0.6\) and \(\theta=30^\circ\), this defined the bionic texture I used for the later experiments.
Pin-on-Disc Friction Experiments
Before testing a real face gear, I prepared flat specimens to isolate the texture effect. The lower specimens were made of 45 steel, the same material as the face gear. The upper pins were made of GCr15 bearing steel. The lower specimen was a stepped disk. The upper specimen was a cylindrical pin. I used an ultraviolet picosecond laser to fabricate three textures on the lower specimens: the bionic texture, a circular texture, and a groove texture. Table 10 lists the laser parameters.
| Parameter | Value |
|---|---|
| Pulse width | \(5000\ \mu\text{s}\) |
| Pulse frequency | \(400\ \text{kHz}\) |
| Scanning passes | 32 |
| Scanning speed | \(1500\ \text{mm/s}\) |
| Wavelength | \(355\ \text{nm}\) |
| Pulse duration | less than \(12\ \text{ps}\) |
After laser processing, I cleaned the specimens in an ultrasonic bath with anhydrous ethanol. I measured the texture profiles with a digital microscope. The measured depth and width differed from the designed values by less than one micrometer. Table 11 gives the measured dimensions.
| Texture | Measured Depth (\(\mu\text{m}\)) | Designed Depth (\(\mu\text{m}\)) | Difference (\(\mu\text{m}\)) | Measured Width (\(\mu\text{m}\)) | Designed Width (\(\mu\text{m}\)) | Difference (\(\mu\text{m}\)) |
|---|---|---|---|---|---|---|
| Bionic | 6.762 | 6 | 0.762 | 400.12 | 400 | 0.12 |
| Circular | 6.746 | 6 | 0.746 | 432.97 | 432.14 | 0.83 |
| Groove | 6.414 | 6 | 0.414 | 146.81 | 146.7 | 0.11 |
I performed pin-on-disc tests with a rotary tribometer. The pin was fixed in the upper holder and loaded against the rotating disk. I used aviation gear oil for lubrication. Each test ran for 1200 s. The baseline conditions were 100 N load and 500 rpm. I also varied the load and speed to study their effects. Table 12 lists the test conditions.
| Condition | Values |
|---|---|
| Load | 50 N, 75 N, 100 N, 125 N, 150 N |
| Rotational speed | 100 rpm, 200 rpm, 300 rpm, 400 rpm, 500 rpm |
| Test duration | 1200 s |
| Lubricant | Aviation gear oil |
| Temperature | Room temperature |
The friction coefficient curves showed clear differences. The smooth surface had a relatively stable friction coefficient at the beginning, but after about 800 s the curve became unstable and rose. This indicated lubricant starvation and a transition to boundary lubrication. The textured surfaces remained more stable. During the first 100 s, the friction coefficient increased slightly as the contact settled. After that, it gradually decreased and then stabilized. This behavior is consistent with the oil reservoir effect: the texture released stored oil into the contact, maintaining a film and reducing direct metal-to-metal contact.
Table 13 compares the average friction coefficients. The bionic texture gave the lowest value. It reduced the average friction coefficient by 31.0 percent relative to the smooth surface. The circular texture reduced it by 20.9 percent. The groove texture reduced it by 13.6 percent.
| Surface | Average Friction Coefficient | Reduction Relative to Smooth Surface |
|---|---|---|
| Smooth | Baseline | 0% |
| Groove | Lower than baseline | 13.6% |
| Circular | Lower than groove | 20.9% |
| Bionic | Lowest | 31.0% |
The worn surface morphology supported the friction data. The smooth surface showed deep ploughing grooves and oxidized debris. The textured surfaces showed lighter wear. Debris was found inside the bionic and circular dimples, confirming that the textures trapped wear particles and prevented them from ploughing the surface. The groove texture had less debris inside because its open geometry allowed debris to escape, but the same openness reduced hydrodynamic pressure and gave a higher friction coefficient than the bionic texture.
Load and speed had important effects. As load increased, the average friction coefficient first decreased and then increased. The initial decrease occurred because the real contact area increased and the oil film became more load-supporting. The later increase occurred because the film was squeezed thinner and eventually ruptured locally. As speed increased, the average friction coefficient decreased. Higher speed helped the oil film form and reduced asperity contact. The bionic texture performed best at high speed and high load, which is exactly the operating regime of an aerospace face gear.
Face Gear Pair Friction Experiments
After the flat-specimen tests, I fabricated the bionic texture on a real face gear. The face gear had 48 teeth. The mating cylindrical pinion had 21 teeth. The normal module was 3.9 mm. The normal pressure angle was \(25^\circ\). The shaft angle was \(90^\circ\). The precision grade was 5. The face gear was made of 45 steel, and the pinion was made of 20CrMnTi. I used the same ultraviolet picosecond laser system to process the face gear teeth. Table 14 lists the processing parameters.
| Parameter | Value |
|---|---|
| Pulse width | \(5000\ \mu\text{s}\) |
| Pulse frequency | \(630\ \text{kHz}\) |
| Scanning passes | 32 |
| Scanning speed | \(800\ \text{mm/s}\) |
I measured the processed face gear tooth surface with a digital microscope. The maximum texture depth was \(6.43\ \mu\text{m}\), and the maximum texture width was \(401.6\ \mu\text{m}\). These values were within about one to two micrometers of the design values, so the processing was acceptable for friction testing.
I built a face gear pair service performance test platform. The platform used two servo motors with a rated power of 63 kW. The input side had a rated speed of 1500 rpm and a maximum torque of 400 N·m. The output side had a rated speed of 300 rpm and a maximum torque of 2000 N·m. Torque sensors were mounted on both shafts. The lubrication system supplied aviation gear oil at a controlled temperature and flow rate. I used spray lubrication with a flow rate of 3.6 L/min and an oil temperature of about \(30^\circ\text{C}\).
Before loading, I ran the face gear pair without load for 30 minutes at 171.3 rpm to complete a run-in. Then I applied load and measured the input torque, output torque, input speed, and output speed. I calculated the transmission efficiency as:
$$
\eta=\frac{P_2}{P_1}=\frac{T_2n_2}{T_1n_1}.
$$
Here \(P_1\) and \(P_2\) are the input and output powers, \(T_1\) and \(T_2\) are the input and output torques, and \(n_1\) and \(n_2\) are the input and output speeds. I compared a smooth face gear with a bionic microtextured face gear under the same conditions.
Table 15 shows the efficiency results as a function of output torque. At low torque, the efficiency was lower and the standard deviation was larger. At high torque, the efficiency increased and the standard deviation decreased. The bionic textured face gear had a higher average efficiency and a lower standard deviation at every torque level. The minimum improvement was 1.6 percent, and the improvement was larger at low torque, where lubrication is most vulnerable.
| Output Torque (N·m) | Smooth Face Gear Efficiency | Bionic Face Gear Efficiency | Improvement |
|---|---|---|---|
| 5 | Lower and variable | Higher and more stable | >1.6% |
| 10 | Lower and variable | Higher and more stable | >1.6% |
| 20 | Moderate | Higher | >1.6% |
| 30 | Moderate | Higher | >1.6% |
| 40 | High | Higher | >1.6% |
| 50 | Near 90% | Higher | >1.6% |
Table 16 shows the efficiency results as a function of input speed. The input speed had a smaller effect than the output torque. The efficiency changed only slightly as the speed increased from 50 rpm to 150 rpm. However, the bionic textured face gear still showed a higher average efficiency and a lower standard deviation at all speeds. This indicates that the bionic texture improved the lubrication state across the operating range, not just at one speed.
| Input Speed (rpm) | Smooth Face Gear Efficiency | Bionic Face Gear Efficiency | Improvement |
|---|---|---|---|
| 50 | Baseline | Higher and more stable | >1.6% |
| 75 | Baseline | Higher and more stable | >1.6% |
| 100 | Baseline | Higher and more stable | >1.6% |
| 125 | Baseline | Higher and more stable | >1.6% |
| 150 | Baseline | Higher and more stable | >1.6% |
The face gear tests confirmed the simulation and pin-on-disc results. The bionic microtexture improved the transmission efficiency and reduced the fluctuation of the face gear pair. The improvement was consistent across output torque and input speed. This is strong evidence that the bionic texture is effective on a real face gear tooth surface, not only on a simplified flat specimen.
Discussion
The bionic texture works through several coupled mechanisms on a face gear tooth surface. First, the duckbill-shaped dimple stores oil. When the contact pressure rises, the stored oil is released into the contact, providing secondary lubrication. Second, the asymmetric shape creates a converging wedge. This wedge raises the hydrodynamic pressure and increases the load capacity of the oil film. Third, the inclined walls reduce stress concentration at the texture edge. A sharp edge can become a crack initiation site under repeated contact loading. The inclined wall distributes the stress and helps the texture survive in a heavy-load face gear. Fourth, the dimple traps wear debris. Once debris is trapped, it cannot plough the face gear tooth surface and generate more debris. Fifth, the tail region and the inclined walls help debris escape during the non-contact part of the meshing cycle.
The relative importance of these mechanisms depends on the operating condition. At low speed and low load, the oil reservoir effect and the debris trapping effect dominate. At high speed and high load, the hydrodynamic wedge effect becomes more important. The bionic texture performed well across both regimes because it combines a closed reservoir with an asymmetric converging shape. A simple circular dimple stores oil but has a weaker wedge effect. A simple groove helps debris escape but leaks pressure and reduces load support. The bionic texture balances these trade-offs.
The face gear application imposes additional constraints. The texture must not reduce the contact area so much that the face gear loses load capacity. The area density must remain moderate. The texture depth must be comparable to the oil film thickness. If the texture is too shallow, it cannot store enough oil. If it is too deep, the oil film may not bridge the texture, and the load capacity may drop. In my study, a dimensionless depth near \(h^*=0.6\) gave the best balance for the bionic cross-section. The texture must also be placed where the sliding direction is reasonably consistent. On a face gear tooth surface, the contact path changes along the tooth, so a texture that is asymmetric in one direction may not be perfectly aligned everywhere. Nevertheless, the experiments showed a net improvement, which means the bionic texture is robust enough to tolerate some misalignment.
Conclusions
I designed a bionic microtexture for a face gear tooth surface by combining the duckbill-shaped pits of a pitcher plant lip with the V-shaped grooves of a desert scorpion back. I derived the lubrication equations from the Navier–Stokes equations, built two-dimensional and three-dimensional CFD models, optimized the texture with a two-dimensional parametric study and a three-dimensional orthogonal study, fabricated the texture with an ultraviolet picosecond laser, and tested it in pin-on-disc and face gear pair experiments. The main findings are as follows.
First, the bionic texture changed the oil film pressure distribution on the face gear tooth surface. The smooth surface produced nearly uniform pressure and weak hydrodynamic lift. The textured surface produced alternating positive and negative pressure zones, with a strong positive pressure peak that increased load capacity.
Second, the cross-section shape controlled the balance between wedge effect and vortex loss. A rectangular section gave the highest pressure amplitude, but a trapezoidal section with an inclined wall of about \(30^\circ\) gave the best compromise between pressure generation, stress reduction, and debris escape. A V-shaped section produced a large low-speed vortex and reduced dynamic performance.
Third, the depth had an optimum. For rectangular and trapezoidal textures, the pressure amplitude and dynamic performance first increased and then decreased with depth. The optimum depended on width and was near \(h^*=0.5\) to \(0.6\). The width increased the pressure amplitude monotonically. The wall friction force remained nearly constant, so the main benefit of the texture was improved load support rather than reduced shear in the cross-section.
Fourth, the three-dimensional orthogonal study showed that the total length had the largest effect on dynamic performance, followed by the tail width and then the total width. Shorter total length, smaller total width, and larger tail width improved dynamic performance. The best combination was \(l_1^*=0.5\), \(w_1^*=0.5\), and \(w_2^*=0.1\), together with \(h^*=0.6\) and \(\theta=30^\circ\).
Fifth, the pin-on-disc experiments showed that all textured surfaces reduced friction compared with a smooth surface. The bionic texture gave the lowest average friction coefficient, with a reduction of 31.0 percent. The circular texture reduced friction by 20.9 percent, and the groove texture reduced it by 13.6 percent. The friction coefficient first decreased and then increased with load, and it decreased with speed. The bionic texture was most effective at high speed and heavy load.
Sixth, the face gear pair experiments showed that the bionic microtextured face gear had a higher and more stable transmission efficiency than the smooth face gear at all tested output torques and input speeds. The minimum improvement was 1.6 percent, and the standard deviation was lower for the textured face gear. This confirmed that the bionic texture improves the tribological performance of a real face gear pair.
Overall, the bionic microtexture offers a practical route to improve face gear lubrication, reduce friction, and extend service life. The design uses a closed reservoir for oil and debris, an asymmetric converging shape for hydrodynamic pressure, and inclined walls for stress reduction. These features are well matched to the high-speed and heavy-load conditions of a face gear transmission. Future work should explore the effect of texture parameters in the actual face gear pair test, the vibration and noise behavior of textured face gears, and the long-term durability of the texture under repeated meshing cycles.