
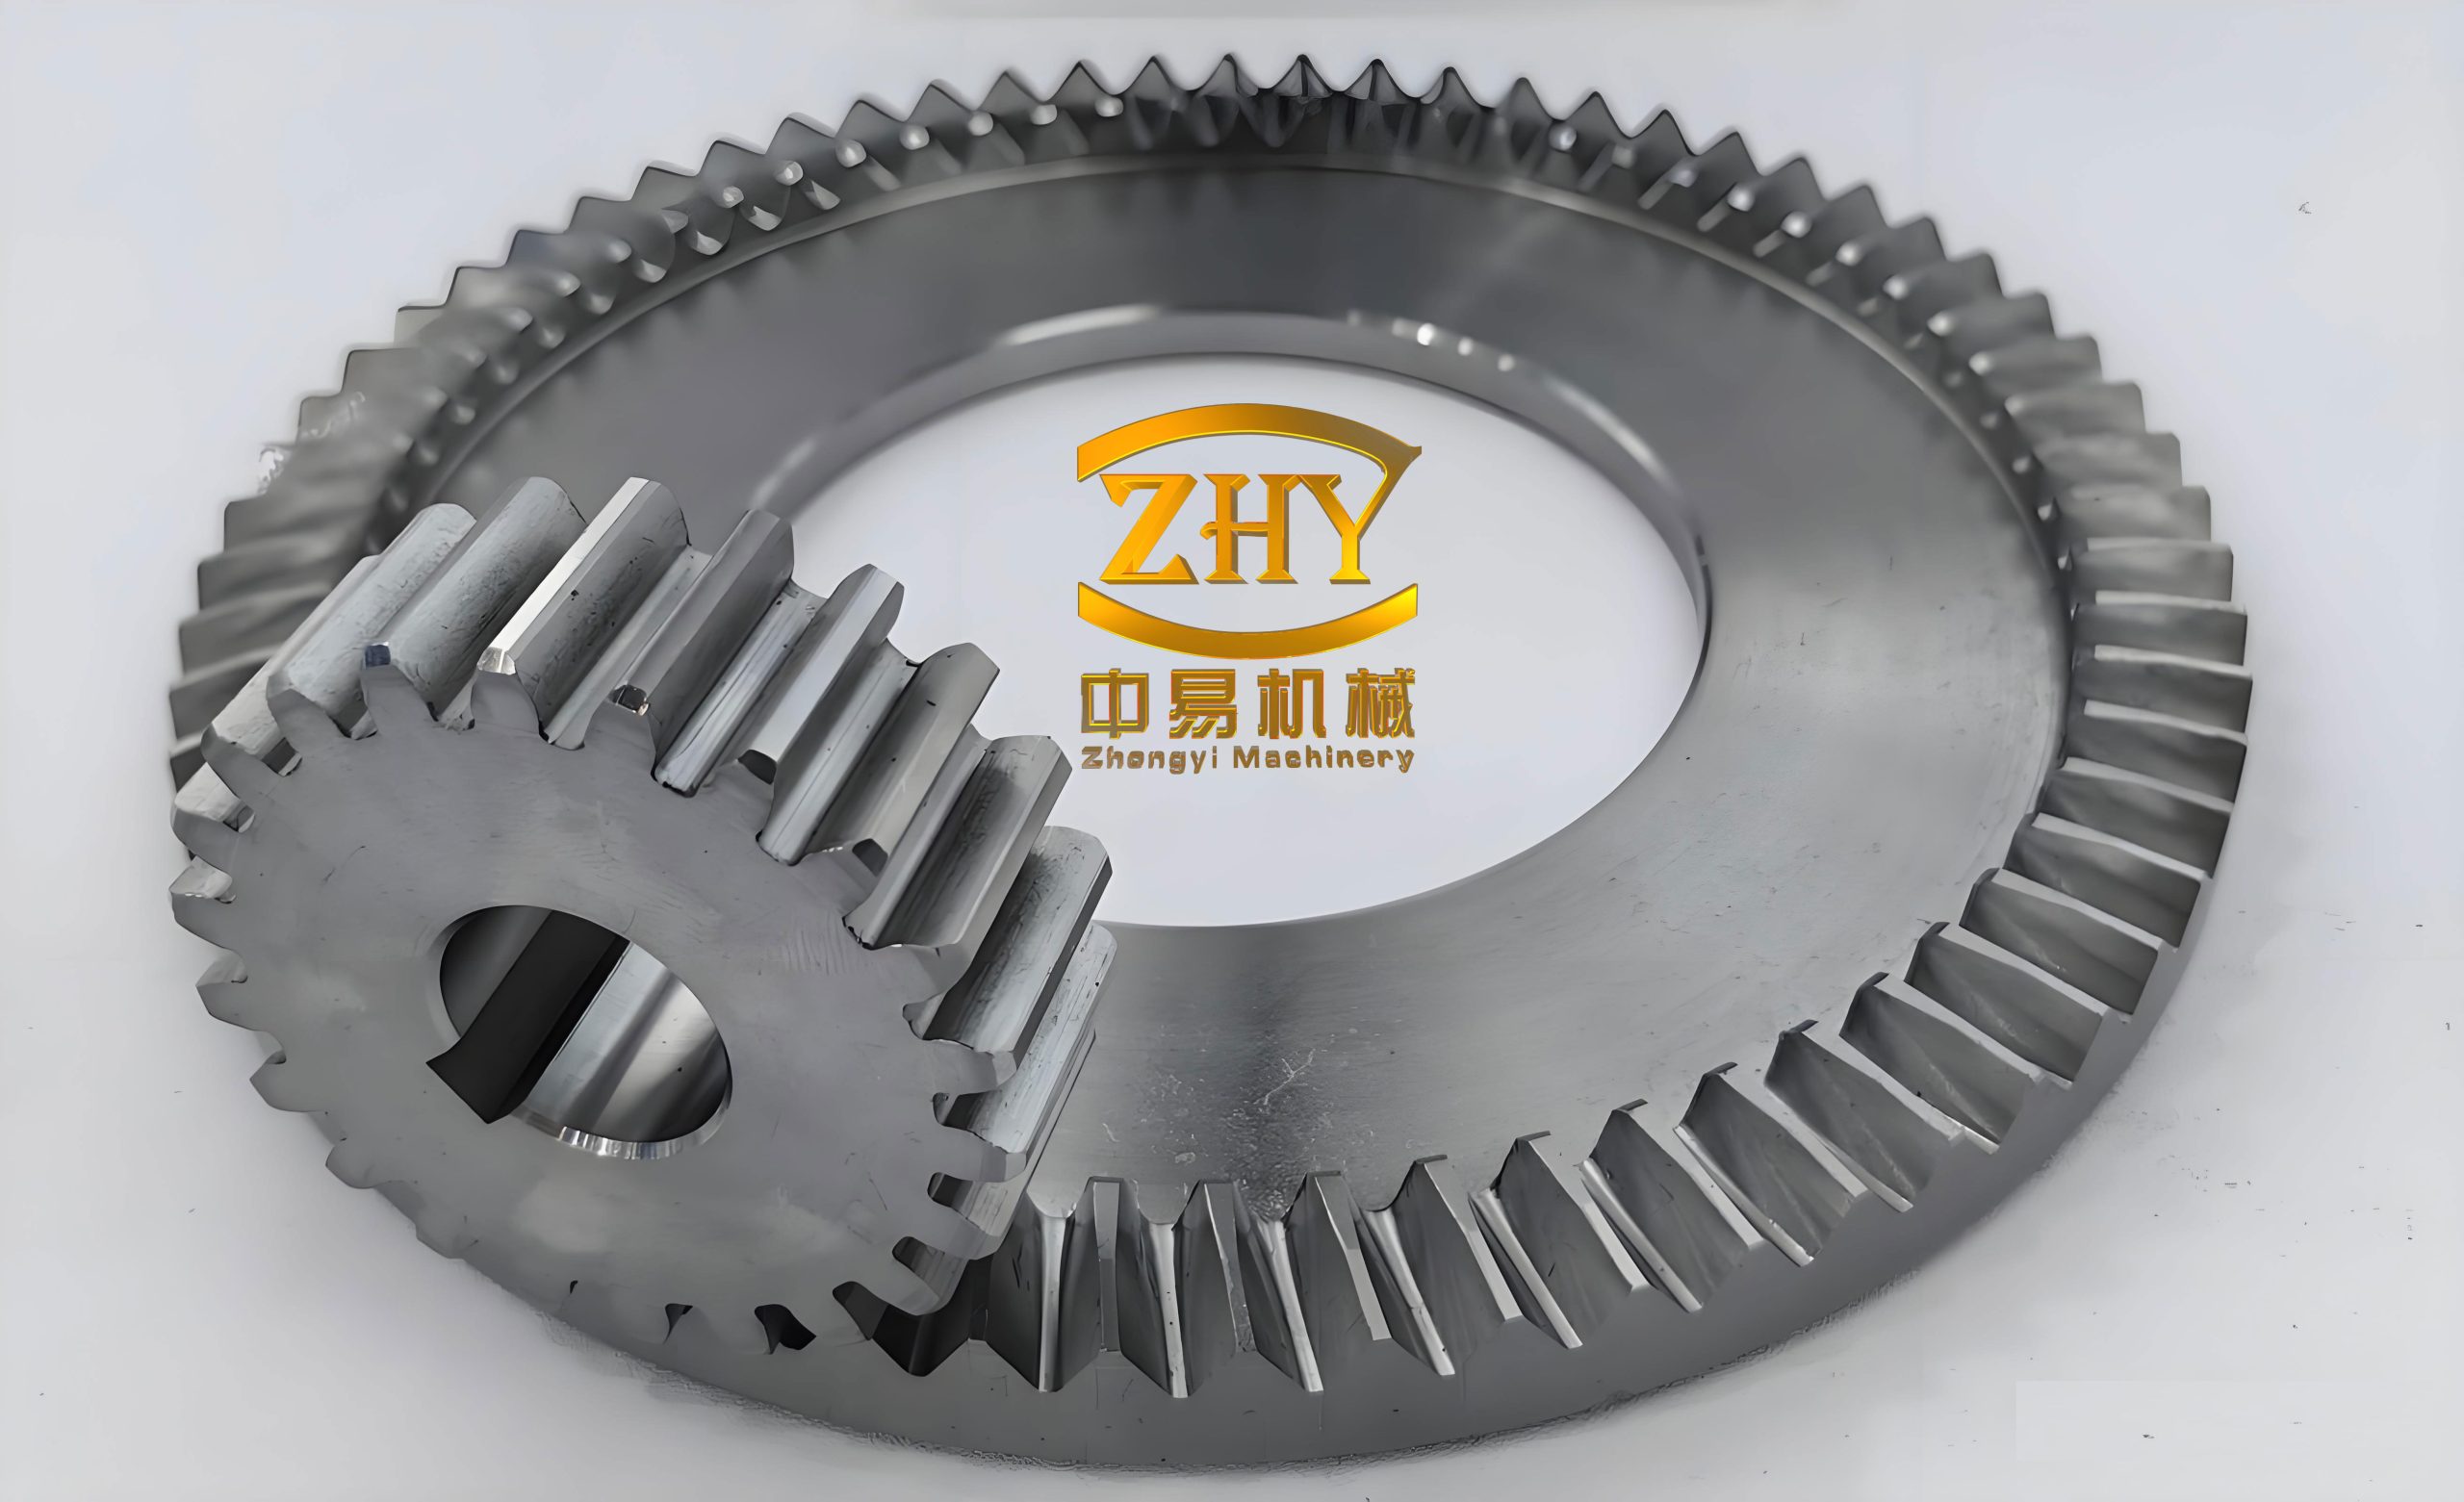
Face gears are a special class of intersecting-axis gearing in which a face gear meshes with a cylindrical pinion. In my work, I treat face gears as high-value transmission elements for aerospace, rotorcraft, turboshaft engines, and other compact high-power systems. The reason is simple: face gears can offer large contact ratios, low axial positioning sensitivity, high load capacity, low weight, and compact packaging. However, the tribological behavior of face gears remains a weak point. Under high-speed and heavy-load conditions, the tooth surfaces of face gears experience mixed or boundary lubrication, severe asperity contact, abrasive wear, adhesive wear, and contact fatigue. These problems reduce transmission efficiency and shorten service life. I therefore designed a bionic microtexture for face gear tooth surfaces and studied its lubrication and friction performance using computational fluid dynamics and experiments. The central idea is that a properly shaped microtexture on face gears can store lubricant, trap wear debris, generate hydrodynamic pressure, reduce direct contact, and improve the stability of the lubricating film.
1. Why Face Gears Need Surface Microtextures
Face gears are not simply a variant of bevel gears. They are formed when a conical gear is modified so that its teeth are distributed on a plane perpendicular to the pinion axis. This arrangement provides a distinctive meshing geometry. In practice, face gears can replace bevel gears in many intersecting-axis applications. The main advantages that I consider important for face gears are summarized in Table 1.
| Feature | Conventional bevel gears | Face gears |
|---|---|---|
| Axial positioning sensitivity | High | Low |
| Theoretical contact ratio | Around 1.0 to 1.2 | Often above 1.6, sometimes above 2 |
| Transmission error | More sensitive to misalignment | Smaller and more stable |
| Load capacity | Good but limited by layout | High, with compact support structure |
| Weight and volume | Moderate to high | Lightweight and compact |
| Application fit | General intersecting-axis drives | Aerospace, rotorcraft, differentials, compact transmissions |
Despite these advantages, face gears are still tribologically demanding. During meshing, the contact between the pinion and the face gear is initially a point contact. Under load, elastic deformation creates an elliptical contact region. The contact pressure is high, and the sliding velocity varies along the contact path. If lubrication is insufficient, the lubricant film collapses, and the tooth surfaces of face gears come into direct contact. This leads to three main failure modes: abrasive wear caused by debris, inadequate lubrication caused by film starvation, and fatigue damage caused by repeated contact stress. I designed the bionic microtexture specifically to address these failure modes in face gears.
2. Bionic Design Inspired by Natural Surfaces
Nature provides many examples of surfaces that manage friction, wear, and liquid retention. I selected two biological prototypes because their surface features match the needs of face gears. The first is the lip of a pitcher plant, which contains duckbill-shaped pits that can hold a thin liquid film and reduce direct contact. The second is the back of a desert scorpion, which contains V-shaped grooves with inclined walls. These grooves reduce stress concentration, resist crack propagation, and help particles escape. I combined these two features into a single bionic microtexture for face gears.
| Biological prototype | Key morphology | Functional benefit for face gears |
|---|---|---|
| Pitcher plant lip | Duckbill-shaped pits | Lubricant storage, thin-film formation, reduced direct contact |
| Desert scorpion back | V-shaped grooves with inclined walls | Lower stress concentration, debris discharge, crack resistance |
| Combined design | Asymmetric pit with inclined side walls | Hydrodynamic pressure, debris trapping, fatigue resistance |
The microtexture type also matters. I compared pits, grooves, bulges, and bristle-like structures. Pits are the most suitable for face gears because they are closed or semi-closed cavities. They can store lubricant and debris, reduce contact area, and avoid the severe stress concentration of bulges. Grooves are open and can guide lubricant flow, but they also cause pressure leakage and reduce hydrodynamic lift. Bulges and bristles are difficult to manufacture on complex tooth surfaces and can be damaged under high load. Therefore, I selected a pit-type microtexture for face gears.
| Texture type | Lubricant storage | Debris trapping | Hydrodynamic effect | Stress concentration | Suitability for face gears |
|---|---|---|---|---|---|
| Pit | Strong | Strong | Strong if asymmetric | Low to moderate | High |
| Groove | Moderate | Moderate | Weak due to leakage | Moderate | Moderate |
| Bulge | Weak | Weak | Weak | High | Low |
| Bristle | Weak | Moderate | Weak | High | Low |
3. Mathematical Description of the Bionic Microtexture
I parameterized the surface shape of the bionic microtexture using four variables: total length \(l_1\), top length \(l_2\), total width \(w_1\), and tail width \(w_2\). The cross-section is controlled by depth \(h\) and wall inclination angle \(\theta\). The spacing between neighboring texture units is \(L\). I define the shape as two parabolas and two straight boundaries. For the first half of the texture, the upper boundary is
$$ y_{top}(x)=\frac{w_1}{2}\left[1-\left(\frac{2x}{l_1}\right)^2\right], \quad 0 \le x \le \frac{l_1}{2} $$
For the second half, the upper boundary is
$$ y_{top}(x)=\frac{w_2}{2}+\frac{w_1-w_2}{2}\left[1-\left(\frac{2x-l_1}{l_1}\right)^2\right], \quad \frac{l_1}{2} \le x \le l_1 $$
The texture is symmetric about the \(x\)-axis, so the lower boundary is \(-y_{top}(x)\). The projected area of one texture unit is
$$ S_V = \int_{0}^{l_1} 2 y_{top}(x)\,dx = \frac{l_1(4w_1+w_2)}{6} $$
The area density is
$$ S_p = \frac{S_V}{L^2} $$
For the cross-section, I use a V-shaped or trapezoidal cavity. If the wall inclination is measured from the vertical direction, the bottom width is
$$ w_b = w_1 – 2h\tan\theta $$
For a rectangular section, \(\theta=0\), so \(w_b=w_1\). For a V-shaped section, the bottom width becomes zero, and the maximum wall angle is
$$ \theta_V = \arctan\left(\frac{w_1}{2h}\right) $$
I designed the bionic microtexture to be asymmetric along the sliding direction. The inlet is wider, and the outlet is narrower. This creates a converging wedge in the flow direction. When lubricant enters the texture, it is compressed toward the outlet. This compression increases local pressure and enhances hydrodynamic lift. The inclined walls inherited from the scorpion back reduce sharp corners and allow debris to escape more easily. This combination is expected to improve the tribological performance of face gears.
4. Governing Equations for Lubrication of Face Gear Surfaces
To model the lubricating film on face gear tooth surfaces, I started from the Navier-Stokes equations. The general form is
$$ \rho\left(\frac{\partial \mathbf{u}}{\partial t}+\mathbf{u}\cdot\nabla\mathbf{u}\right)=-\nabla p+\mu\nabla^2\mathbf{u}+\mathbf{f} $$
with the continuity equation
$$ \nabla\cdot\mathbf{u}=0 $$
I made the following assumptions: the lubricant is incompressible and Newtonian; the flow is steady; body forces are neglected; and the velocity at the walls satisfies the no-slip condition. Under these assumptions, the continuity equation becomes
$$ \frac{\partial u_x}{\partial x}+\frac{\partial u_y}{\partial y}+\frac{\partial u_z}{\partial z}=0 $$
For the two-dimensional case, the momentum equations reduce to
$$ u_x\frac{\partial u_x}{\partial x}+u_y\frac{\partial u_x}{\partial y}=-\frac{1}{\rho}\frac{\partial p}{\partial x}+\nu\left(\frac{\partial^2 u_x}{\partial x^2}+\frac{\partial^2 u_x}{\partial y^2}\right) $$
$$ u_x\frac{\partial u_y}{\partial x}+u_y\frac{\partial u_y}{\partial y}=-\frac{1}{\rho}\frac{\partial p}{\partial y}+\nu\left(\frac{\partial^2 u_y}{\partial x^2}+\frac{\partial^2 u_y}{\partial y^2}\right) $$
For the three-dimensional case, the corresponding equations are
$$ u_x\frac{\partial u_x}{\partial x}+u_y\frac{\partial u_x}{\partial y}+u_z\frac{\partial u_x}{\partial z}=-\frac{1}{\rho}\frac{\partial p}{\partial x}+\nu\nabla^2 u_x $$
$$ u_x\frac{\partial u_y}{\partial x}+u_y\frac{\partial u_y}{\partial y}+u_z\frac{\partial u_y}{\partial z}=-\frac{1}{\rho}\frac{\partial p}{\partial y}+\nu\nabla^2 u_y $$
$$ u_x\frac{\partial u_z}{\partial x}+u_y\frac{\partial u_z}{\partial y}+u_z\frac{\partial u_z}{\partial z}=-\frac{1}{\rho}\frac{\partial p}{\partial z}+\nu\nabla^2 u_z $$
I then introduced dimensionless variables to reduce the number of independent parameters and to make the results independent of unit systems:
$$ x^*=\frac{x}{L}, \quad y^*=\frac{y}{L}, \quad z^*=\frac{z}{L} $$
$$ u_x^*=\frac{u_x}{U}, \quad u_y^*=\frac{u_y}{U}, \quad u_z^*=\frac{u_z}{U}, \quad p^*=\frac{p}{P_0} $$
The Reynolds number is
$$ Re=\frac{UL}{\nu} $$
The reference pressure is
$$ P_0=\frac{\rho\nu U}{L} $$
After substitution, the dimensionless momentum equation in the \(x\)-direction becomes
$$ Re\left(u_x^*\frac{\partial u_x^*}{\partial x^*}+u_y^*\frac{\partial u_x^*}{\partial y^*}+u_z^*\frac{\partial u_x^*}{\partial z^*}\right)=-\frac{\partial p^*}{\partial x^*}+\nabla^{*2}u_x^* $$
Similar equations hold in the \(y\)- and \(z\)-directions. For my simulations, the lubricant was an aviation gear oil with density \(\rho=870\,\mathrm{kg/m^3}\) and dynamic viscosity \(\mu=0.0083\,\mathrm{Pa\cdot s}\). The kinematic viscosity is
$$ \nu=\frac{\mu}{\rho}=9.54\times10^{-6}\,\mathrm{m^2/s} $$
With a sliding speed \(U=10\,\mathrm{m/s}\) and a characteristic length \(L=1000\,\mu\mathrm{m}\), the Reynolds number is
$$ Re=\frac{UL}{\nu}=\frac{10\times10^{-3}}{9.54\times10^{-6}}\approx1048 $$
Because \(Re<2300\), I used a laminar flow model in the computational fluid dynamics simulations.
5. Two-Dimensional CFD Model and Evaluation Metrics
I simplified the contact between the pinion and the face gear as two parallel plates separated by an oil film of thickness \(H\). The lower plate is fixed and contains periodic microtextures. The upper plate moves horizontally with speed \(U\). The computational domain contains one texture unit, with periodic boundary conditions on the left and right sides. The top wall is a moving no-slip wall, and the bottom wall is a fixed no-slip wall. The boundary conditions are listed in Table 2.
| Boundary | Condition | Value |
|---|---|---|
| Top wall | Moving no-slip wall | \(U=10\,\mathrm{m/s}\) |
| Bottom wall | Fixed no-slip wall | \(U=0\) |
| Left and right sides | Periodic | Repeating texture unit |
| Lubricant density | Constant | \(870\,\mathrm{kg/m^3}\) |
| Lubricant viscosity | Constant | \(0.0083\,\mathrm{Pa\cdot s}\) |
| Film thickness | Constant | \(H=10\,\mu\mathrm{m}\) |
To evaluate the lubrication performance, I used three indicators: oil-film load capacity \(F_y\), wall friction force \(F_x\), and hydrodynamic performance parameter \(f\). The load capacity is
$$ F_y=\int p\,dx $$
The wall friction force is
$$ F_x=\int \tau\,dx $$
where \(\tau\) is the shear stress. The hydrodynamic performance parameter is
$$ f=\frac{F_y}{F_x} $$
A larger \(f\) means that the texture generates more load capacity for the same friction force. I also used dimensionless forms:
$$ F_y^*=\frac{F_y H^2}{S\mu U L} $$
$$ F_x^*=\frac{F_x H}{S\mu U} $$
where \(S\) is the reference area. These metrics allow direct comparison between different texture shapes and parameter combinations.
6. Two-Dimensional Simulation Results for Face Gear Tooth Textures
I first compared smooth surfaces with textured surfaces. On a smooth surface, the pressure distribution is nearly uniform, and the film cannot generate strong hydrodynamic lift. On a textured surface, the converging and diverging gaps alter the pressure field. The inlet region produces positive pressure, while the outlet region can produce negative pressure. The pressure amplitude depends strongly on the cross-sectional shape of the texture.
I considered four cross-sectional shapes: rectangular, trapezoid I, trapezoid II, and V-shaped. The wall inclination angles were \(0^\circ\), \(30^\circ\), \(60^\circ\), and the maximum V-angle, respectively. The pressure amplitude decreased in the order
$$ \text{rectangular} > \text{trapezoid I} > \text{trapezoid II} > \text{V-shaped} $$
This means that steeper walls produce higher pressure amplitudes. However, steeper walls can also trap more debris and create larger vortex regions. The V-shaped section produced the lowest pressure amplitude because its sharp bottom angle expanded the low-speed vortex zone and dissipated kinetic energy.
| Cross-section | Wall inclination | Relative pressure amplitude | Vortex behavior | Overall lubrication |
|---|---|---|---|---|
| Rectangular | \(0^\circ\) | Highest | Large stable vortices at inlet and outlet | Good pressure, moderate debris escape |
| Trapezoid I | \(30^\circ\) | High | Vortices move toward center | Best balance for face gears |
| Trapezoid II | \(60^\circ\) | Moderate | Smaller vortices | Moderate pressure, good flow guidance |
| V-shaped | Maximum | Lowest | Large low-speed vortex zone | Weak hydrodynamic lift |
I also studied the effect of texture depth \(h^*\). For rectangular and trapezoidal textures, the pressure amplitude first increased and then decreased as depth increased. The optimal depth was \(h^*=0.5\) for smaller widths and \(h^*=0.6\) for larger widths. For V-shaped textures, the pressure amplitude increased with depth and then became nearly constant. This behavior is controlled by two competing effects: the wedge effect and the vortex effect. At shallow depths, the wedge effect dominates, and increasing depth increases hydrodynamic pressure. At larger depths, the vortex effect dominates, and the pressure amplitude decreases because more energy is dissipated in the recirculation zones.
| Texture width \(w^*\) | Optimal depth \(h^*\) for rectangular and trapezoidal sections | Trend for V-shaped section |
|---|---|---|
| 0.20 | 0.50 | Increases then plateaus |
| 0.25 | 0.50 | Increases then plateaus |
| 0.30 | 0.60 | Increases then plateaus |
| 0.35 | 0.60 | Increases then plateaus |
| 0.40 | 0.60 | Increases then plateaus |
For texture width \(w^*\), the pressure amplitude increased monotonically for all cross-sectional shapes. The increase was similar for rectangular and trapezoidal textures, while the V-shaped texture showed a gentler increase. As depth became larger, the difference between cross-sectional shapes decreased, and width became the dominant factor. The wall friction force remained almost constant for all these parameter changes. Therefore, the main benefit of the texture cross-section is not the reduction of wall shear stress but the increase of load capacity and hydrodynamic performance.
To explain these results, I examined the streamline distributions. In a rectangular texture, large stable vortices form at the inlet and outlet. In trapezoidal textures, the inclined walls guide the flow and shift the vortices toward the center. This reduces the vortex area and improves the flow path. In a V-shaped texture, the sharp bottom creates a large low-speed recirculation zone that spans the bottom of the cavity. This zone reduces pressure amplitude and hydrodynamic performance. These mechanisms explain why the trapezoidal section with \(30^\circ\) wall inclination provided the best balance. It preserves strong pressure generation while allowing debris to move out of the cavity.
7. Three-Dimensional Model and Orthogonal Design
After the two-dimensional study, I built three-dimensional CFD models of the bionic microtexture on face gear tooth surfaces. The three-dimensional model includes periodic boundaries on the sides parallel to the flow and symmetry boundaries in the transverse direction. The grid was refined near the walls. A mesh independence test showed that when the number of elements exceeded approximately 3.19 million, the hydrodynamic performance parameter changed by less than 1%. The final mesh used tetrahedral elements, five boundary layers, a growth rate of 1.2, and a first layer height of 0.12 μm.
Because three-dimensional simulations are expensive, I used an orthogonal array to reduce the number of cases. The factors were total length \(A\), total width \(B\), and tail width \(C\). Each factor had five levels. I used an \(L_{25}\) orthogonal array with three real factors and three dummy factors. The factor levels are shown in Table 3.
| Level | Total length \(A\) | Total width \(B\) | Tail width \(C\) |
|---|---|---|---|
| 1 | 0.50 | 0.50 | 0.02 |
| 2 | 0.55 | 0.55 | 0.04 |
| 3 | 0.60 | 0.60 | 0.06 |
| 4 | 0.65 | 0.65 | 0.08 |
| 5 | 0.70 | 0.70 | 0.10 |
The full orthogonal array is given in Table 4. Each row corresponds to one three-dimensional simulation case.
| Case | \(A\) | \(B\) | \(C\) |
|---|---|---|---|
| 1 | 0.50 | 0.50 | 0.02 |
| 2 | 0.50 | 0.55 | 0.06 |
| 3 | 0.50 | 0.60 | 0.10 |
| 4 | 0.50 | 0.65 | 0.04 |
| 5 | 0.50 | 0.70 | 0.08 |
| 6 | 0.55 | 0.50 | 0.10 |
| 7 | 0.55 | 0.55 | 0.04 |
| 8 | 0.55 | 0.60 | 0.08 |
| 9 | 0.55 | 0.65 | 0.02 |
| 10 | 0.55 | 0.70 | 0.06 |
| 11 | 0.60 | 0.50 | 0.08 |
| 12 | 0.60 | 0.55 | 0.02 |
| 13 | 0.60 | 0.60 | 0.06 |
| 14 | 0.60 | 0.65 | 0.10 |
| 15 | 0.60 | 0.70 | 0.04 |
| 16 | 0.65 | 0.50 | 0.06 |
| 17 | 0.65 | 0.55 | 0.10 |
| 18 | 0.65 | 0.60 | 0.04 |
| 19 | 0.65 | 0.65 | 0.08 |
| 20 | 0.65 | 0.70 | 0.02 |
| 21 | 0.70 | 0.50 | 0.04 |
| 22 | 0.70 | 0.55 | 0.08 |
| 23 | 0.70 | 0.60 | 0.02 |
| 24 | 0.70 | 0.65 | 0.06 |
| 25 | 0.70 | 0.70 | 0.10 |
8. Three-Dimensional Results for Bionic Face Gear Textures
I compared the bionic microtexture with circular, square, and groove textures at the same area density. The pressure distributions were very different. Circular and square textures produced nearly symmetric positive and negative pressure regions. Because the shapes are symmetric along the flow direction, the positive and negative pressures partially cancel, reducing the net load capacity. Groove textures produced the lowest pressure amplitude because the open channels allow lubricant to spread laterally and relieve pressure. The bionic texture produced a much larger positive pressure peak than negative pressure. The pressure amplitude of the bionic texture was significantly higher than that of the other three textures. This is because the bionic shape converges along the flow direction, creating a jet-like accumulation of pressure near the outlet.
| Texture shape | Pressure distribution | Load capacity | Hydrodynamic performance | Relative ranking |
|---|---|---|---|---|
| Circular | Symmetric positive and negative | Moderate | Moderate | Third |
| Square | Symmetric positive and negative | Moderate | Moderate | Second or third |
| Groove | Weak pressure amplitude | Low | Low | Fourth |
| Bionic | Strong positive peak, weaker negative | Highest | Highest | First |
The bionic texture generated the largest hydrodynamic performance parameter. Compared with the groove texture, its load capacity and hydrodynamic performance were approximately 250% higher. The wall friction force was nearly the same for all four textures. This confirms that the main advantage of the bionic texture is its ability to generate hydrodynamic lift, not to reduce shear stress. For face gears, this means that the texture can help maintain a lubricant film under high load and reduce the probability of direct asperity contact.
I used range analysis to quantify the effect of the surface parameters. The results are shown in Table 5. The total length \(A\) had the largest range, followed by tail width \(C\), and then total width \(B\). The optimal level for each factor was \(A_1\), \(B_1\), and \(C_5\). Therefore, the best combination was \(A_1B_1C_5\), which corresponds to \(l_1^*=0.5\), \(w_1^*=0.5\), and \(w_2^*=0.10\).
| Factor | Level 1 | Level 2 | Level 3 | Level 4 | Level 5 | Range | Rank |
|---|---|---|---|---|---|---|---|
| Total length \(A\) | 7.60 | 6.64 | 5.75 | 5.00 | 4.04 | 3.55 | 1 |
| Total width \(B\) | 5.97 | 5.93 | 5.85 | 5.79 | 5.71 | 0.34 | 3 |
| Tail width \(C\) | 5.29 | 5.55 | 5.76 | 6.11 | 6.33 | 1.04 | 2 |
The trend is clear. A shorter total length produces stronger convergence and higher hydrodynamic pressure. A larger tail width increases the inlet flow area and allows more lubricant to enter the texture. A smaller total width concentrates the flow and reduces lateral leakage. Based on this analysis, the optimal bionic microtexture for face gears is \(l_1^*=0.5\), \(l_2^*=0.4\), \(w_1^*=0.5\), \(w_2^*=0.1\), \(h^*=0.6\), and \(\theta=30^\circ\). I used this design in the subsequent friction experiments on face gears.
9. Pin-on-Disk Friction Experiments
Before testing actual face gears, I performed pin-on-disk experiments to evaluate the friction performance of the bionic microtexture. The lower specimens were made of 45 steel, which is the same material used for the face gears. The upper pins were made of GCr15 bearing steel. The lower specimen was a stepped disk, and the upper specimen was a cylindrical pin with a diameter of 6.2 mm and a length of 15 mm. I used an ultraviolet picosecond laser to fabricate three textures: bionic, circular, and groove. The laser parameters were kept constant, and only the scanning speed was adjusted to control the shape. After processing, the specimens were cleaned in an ultrasonic bath with ethanol.
| Parameter | Value |
|---|---|
| Lower specimen material | 45 steel, quenched and tempered |
| Upper pin material | GCr15 bearing steel |
| Pin diameter | 6.2 mm |
| Pin length | 15 mm |
| Lubricant | Aviation gear oil |
| Lubricant temperature | 25 °C |
| Load | 100 N |
| Rotational speed | 500 rpm |
| Test duration | 1200 s |
I measured the textured specimens with a digital microscope. The measured depths and widths were within 1 μm of the design values, as shown in Table 6. This confirmed that the laser process was accurate enough for tribological testing.
| Texture type | Measured depth (μm) | Designed depth (μm) | Difference (μm) | Measured width (μm) | Designed width (μm) | Difference (μm) |
|---|---|---|---|---|---|---|
| Bionic | 6.762 | 6.000 | 0.762 | 400.12 | 400.00 | 0.12 |
| Circular | 6.746 | 6.000 | 0.746 | 432.97 | 432.14 | 0.83 |
| Groove | 6.414 | 6.000 | 0.414 | 146.81 | 146.70 | 0.11 |
The friction coefficient curves showed clear differences. The smooth specimen remained stable for the first part of the test, but after about 800 s the lubricant film became depleted, and the friction coefficient fluctuated and increased. This indicates starvation and severe asperity contact. The textured specimens showed better stability. In the first 100 s, the friction coefficient increased slightly as the contact settled. After that, it decreased gradually and became stable in the later stage. This is the secondary lubrication effect: lubricant stored in the cavities is released into the contact zone during sliding, maintaining a film and reducing direct metal-to-metal contact.
| Surface | Average friction coefficient trend | Reduction compared with smooth surface |
|---|---|---|
| Smooth | Unstable and high after film starvation | 0% |
| Groove | Stable but higher than other textures | 13.6% |
| Circular | Stable and lower | 20.9% |
| Bionic | Most stable and lowest | 31.0% |
After the tests, I examined the worn surfaces. The smooth specimen showed many deep scratches and plowing marks. Some oxidized debris remained attached to the surface. These features are typical of abrasive wear. The textured specimens showed much lighter wear. The bionic and circular textures still retained their shapes. Debris was found inside the cavities, confirming that the textures trap wear particles. The groove texture had less debris inside because its open channels allow particles to escape. However, the open channels also reduce hydrodynamic pressure, which explains why the groove texture had the highest friction coefficient among the three textured surfaces.
10. Effects of Load and Speed on Friction
I also studied how load and rotational speed affect the friction coefficient. The results followed consistent trends for all surfaces. As the load increased, the friction coefficient first decreased and then increased. At low loads, the real contact area is small, and the contact pressure is concentrated on a few asperities. As the load increases, asperities deform, the real contact area increases, and the contact pressure becomes more evenly distributed. The viscosity of the lubricant also increases under pressure, which helps the film support the load. These effects reduce friction. However, when the load becomes too high, the film is squeezed thinner and may rupture locally, causing the friction coefficient to rise again.
| Load condition | Friction coefficient trend | Explanation |
|---|---|---|
| Low load | Decreases with increasing load | Asperity deformation and increased real contact area |
| Moderate load | Minimum friction coefficient | Balance between film support and contact area |
| High load | Increases with increasing load | Film thinning and local rupture |
As the rotational speed increased, the friction coefficient decreased for all surfaces. Higher speed promotes hydrodynamic film formation and increases the film thickness. The textured surfaces maintained lower friction than the smooth surface over the entire speed range. The bionic texture had the lowest friction coefficient at all speeds. At low speed, the bionic texture still worked well because it stores lubricant and supplies it to the contact. At high speed, the bionic texture enhanced hydrodynamic lift and further reduced friction. Therefore, the bionic microtexture is suitable for high-speed and heavy-load conditions, which are exactly the conditions faced by face gears in aerospace applications.
11. Face Gear Friction Tests
After the pin-on-disk tests, I fabricated the optimized bionic microtexture on actual face gears and tested their transmission efficiency. The face gears were made of 45 steel, and the mating pinions were made of 20CrMnTi. The basic parameters are listed in Table 7. I used an ultraviolet picosecond laser to process the tooth surfaces. The laser parameters were adjusted to produce a texture depth of approximately 6.43 μm and a width of approximately 401.6 μm, which matched the design within about 1 to 2 μm. After processing, the face gears were cleaned in an ultrasonic bath.
| Parameter | Value |
|---|---|
| Normal module | 3.9 |
| Face gear tooth number | 48 |
| Pinion tooth number | 21 |
| Normal pressure angle | 25° |
| Shaft angle | 90° |
| Addendum coefficient | 1 |
| Dedendum coefficient | 1 |
| Clearance coefficient | 0.25 |
| Accuracy grade | 5 |
| Face gear material | 45 steel |
| Pinion material | 20CrMnTi |
I built a face gear service performance test platform. The platform included an input-side pinion, an output-side face gear, a displacement control system, a servo control cabinet, and a lubricant temperature and flow control system. Both ends were equipped with servo motors and torque sensors. The input side could reach 1500 rpm and 400 N·m, while the output side could reach 300 rpm and 2000 N·m. The platform supported oil-jet and oil-immersion lubrication. The lubricant temperature could be controlled from 25 °C to 200 °C, and the flow rate from 1 to 10 L/min. The main parameters are listed in Table 8.
| Parameter | Input side: pinion | Output side: face gear |
|---|---|---|
| Rated speed | 1500 rpm | 300 rpm |
| Maximum torque | 400 N·m | 2000 N·m |
| Applicable diameter | 80–270 mm | 200–400 mm |
| Motor power | 63 kW | |
| Displacement range | X: 0–150 mm, Y: 0–150 mm, Z: 0–100 mm, W: 0–2° | |
| Displacement accuracy | X/Y/Z: 0.01 mm, W: 10 arcmin | |
| Lubrication mode | Oil jet or oil immersion | |
| Lubricant temperature | 25–200 °C | |
| Lubricant flow rate | 1–10 L/min | |
I installed the face gear and pinion according to the meshing geometry. The distance between the pinion axis and the face gear axis is determined by the module and tooth numbers. The axial position of the face gear is determined by the pinion radius, clearance, and the distance from the face gear root to its back face. After assembly, I performed a no-load run-in for 30 minutes at an input speed of 171.3 rpm. This helped the surfaces and lubricant system reach a stable state before loading. During the tests, I used an aviation gear oil with a flow rate of 3.6 L/min and a temperature of about 30 °C.
I calculated the transmission efficiency from the input and output power:
$$ \eta=\frac{P_2}{P_1}=\frac{T_2 n_2}{T_1 n_1} $$
where \(P_1\) and \(P_2\) are the input and output powers, \(T_1\) and \(T_2\) are the input and output torques, and \(n_1\) and \(n_2\) are the input and output speeds. I compared smooth face gears with bionic microtextured face gears under different output torques and input speeds. The results are summarized in Table 9.
| Condition | Smooth face gears | Bionic microtextured face gears | Improvement |
|---|---|---|---|
| Low output torque (5 N·m) | Lower efficiency, higher standard deviation | Higher efficiency, lower standard deviation | At least 1.6% higher average efficiency |
| Medium output torque (10–30 N·m) | Efficiency increases with torque | Efficiency increases with torque and remains higher | Consistent improvement |
| High output torque (50 N·m) | Efficiency approaches 90% | Efficiency approaches or exceeds 90% | Higher and more stable |
| Low input speed (50 rpm) | Efficiency stable but lower | Efficiency stable and higher | Consistent improvement |
| High input speed (150 rpm) | Efficiency stable but lower | Efficiency stable and higher | Consistent improvement |
Several trends are clear. First, the average transmission efficiency increases with output torque for both smooth and textured face gears. At low torque, the oil film is thin and unstable, so friction losses are larger. As torque increases, the contact pressure helps form a more stable film, and efficiency rises. Second, the standard deviation decreases at higher torque, meaning that the contact and lubrication conditions become more stable. Third, the bionic microtextured face gears always show higher average efficiency and lower standard deviation than the smooth face gears. This means that the bionic texture improves not only the average friction performance but also the stability of the face gear transmission.
The input speed had a smaller effect on efficiency than the output torque. From 50 rpm to 150 rpm, the efficiency of both smooth and textured face gears changed only slightly. However, the bionic microtextured face gears remained more efficient and more stable at all speeds. This is consistent with the pin-on-disk results, where the bionic texture performed well across the speed range. The texture helps maintain a lubricant film even when the speed is not high enough to generate strong hydrodynamic lift on its own.
12. Discussion
The results from the simulations and experiments agree well. The two-dimensional and three-dimensional CFD models show that the bionic microtexture changes the pressure distribution in the lubricant film. The asymmetric converging shape increases positive pressure and reduces the cancellation between positive and negative pressure regions. The inclined walls reduce vortex intensity and help debris escape. The best cross-section was the trapezoidal shape with a wall angle of about \(30^\circ\) and a dimensionless depth of \(h^*=0.6\). The best surface shape was \(l_1^*=0.5\), \(w_1^*=0.5\), and \(w_2^*=0.1\). These parameters produced the highest hydrodynamic performance parameter among all tested cases.
The pin-on-disk experiments confirmed that the bionic texture reduces friction more than circular and groove textures. The bionic texture reduced the average friction coefficient by 31.0%, compared with 20.9% for circular textures and 13.6% for groove textures. The friction curves were also more stable, meaning that the lubricant film was better maintained. The worn surfaces showed less scratching and more debris inside the cavities, which supports the proposed mechanisms of lubricant storage and debris trapping. The load and speed tests showed that the bionic texture is especially effective under high-speed and heavy-load conditions. This is important for face gears, which often operate under such conditions.
The face gear tests provided the final validation. The bionic microtextured face gears achieved higher and more stable transmission efficiency than the smooth face gears under all tested output torques and input speeds. The improvement was at least 1.6% in average efficiency, and the standard deviation was lower. This indicates that the bionic microtexture reduces friction loss and improves the reliability of face gear transmissions. The texture did not cause excessive vibration or damage to the tooth surfaces. The measured texture dimensions after laser processing were close to the design values, which means that the fabrication method is suitable for real face gears.
13. Conclusions
I designed a bionic microtexture for face gear tooth surfaces by combining the duckbill-shaped pits of a pitcher plant lip with the V-shaped grooves of a desert scorpion back. I established two-dimensional and three-dimensional lubrication models based on the Navier-Stokes equations, solved the models with computational fluid dynamics, and validated the design with pin-on-disk and face gear experiments. The main conclusions are as follows.
First, the bionic microtexture changes the oil-film pressure distribution on face gear tooth surfaces. Smooth surfaces produce nearly uniform pressure and weak hydrodynamic lift. The bionic texture produces a strong positive pressure peak and a weaker negative pressure region, which increases load capacity. The pressure amplitude and hydrodynamic performance follow the same trends: they first increase and then decrease with texture depth, increase with texture width, and decrease with wall inclination angle.
Second, the cross-sectional shape has a strong effect on lubrication. Rectangular and trapezoidal textures produce higher pressure amplitudes than V-shaped textures. The trapezoidal shape with a \(30^\circ\) wall angle provides the best balance between hydrodynamic pressure and debris removal. The optimal dimensionless depth is \(h^*=0.6\) for the selected width, and the optimal cross-section is trapezoidal rather than fully rectangular or fully V-shaped.
Third, the surface shape of the bionic microtexture controls its hydrodynamic performance. The total length has the largest influence, followed by tail width and total width. Shorter total length, smaller total width, and larger tail width improve hydrodynamic performance. The optimal surface parameters are \(l_1^*=0.5\), \(l_2^*=0.4\), \(w_1^*=0.5\), and \(w_2^*=0.1\).
Fourth, the bionic microtexture outperforms circular and groove textures in both simulation and pin-on-disk experiments. It generates the highest load capacity and hydrodynamic performance parameter. In the pin-on-disk tests, the bionic texture reduced the average friction coefficient by 31.0%, compared with 20.9% for circular textures and 13.6% for groove textures. The friction coefficient decreases with increasing speed and first decreases and then increases with increasing load. The bionic texture is therefore suitable for high-speed and heavy-load face gear applications.
Fifth, the bionic microtextured face gears achieved higher and more stable transmission efficiency than smooth face gears under all tested conditions. The average efficiency improvement was at least 1.6%, and the standard deviation was lower. This confirms that the bionic microtexture improves the tribological performance of face gears in real meshing conditions.
In future work, I plan to test more texture parameters on actual face gears, including total length, total width, and tail width, to further optimize the design. I also plan to develop a reliable method for measuring the vibration and noise of face gears with and without microtextures. These studies will help move bionic microtextured face gears closer to practical aerospace and high-performance transmission applications.