1 Shot peening process test
1.1 Test Specimens
The shot peening sample is a certain type of spiral bevel gear, the material is AISI 9310 high-strength alloy steel, and the teeth are carburized and quenched. The tooth surface is an important area for shot peening, and its hardness is higher than 60HRC from the surface to a depth of 0.56 mm
1.2 Test parameters
The test was carried out using an MP1000Ti CNC shot blasting machine. The projectile type adopts ASH110 (55~62HRC), the shot peening strength is 0.178~0.228 mmA, the coverage rate is 200%, the nozzle angle is 17°, the air pressure is 0.25 MPa, the moving speed is 70 mm/min, and the shot peening time is 144 s. The tooth root, convex surface and concave surface are strengthened respectively, the nozzle is perpendicular to the target surface and the distance is 150 mm, the gear turntable speed is 30 r/min, and the projectile flow rate is 5 kg/min.
1.3 Residual stress measurement
The residual stress is measured on the tooth surface, and the location of the measurement point is shown in Figure 1, a, b, and c are all located on the taper line of the tooth surface node, which is the quarter point of the tooth width in turn, and a is close to the big end of the tooth. In order to obtain the residual stress field of the gear surface, the gear teeth were electropolished along the normal direction of the tooth surface, and the electrolytic polishing depth was measured by the white light interferometer. X-ray diffractometer from Proto in Canada was used to measure the residual stress on the tooth surface. Tube voltage 25 kV, tube current 5 mA, X-ray tube Cr_K–Alpha, aperture diameter 1 mm, wavelength 2.291 A, exposure time 3 s, number of exposures 7, maximum β angle 20°. The test photos are shown in Figure 2. The instrument used for electrolytic polishing is the 8818–V3 electrolytic polisher, with a set voltage of 40V, a flow rate of 8, a polishing time of 3 s, and a polishing current of 2.8~3 A.
2 Simulation model establishment
Due to the complex curved surface of the spiral bevel gear, the projectile is prone to collide with each other near the tooth surface, which affects the actual impact velocity and number of projectiles. In order to improve the accuracy of the calculation, a simulation model of the shot peening process is established based on the coupling method of discrete elements and finite elements, and the residual stress distribution of the surface layer of the tooth surface after the shot peening of spiral bevel gears is calculated, and the calculation process is shown in Figure 3. The discrete element model of spiral bevel gear shot peening was established to obtain the impact velocity vector and the impact times per unit area of the projectile on the tooth surface. The results of the discrete element calculation are taken as input, combined with the tooth surface before shot peening Three-dimensional roughness, residual stress field, gear and projectile material models are limited to build Meta-model, calculating the residual stress field of the surface layer of the gear tooth after shot peening, and analyzing the shot peening time,
The influence of projectile velocity and projectile diameter on the residual stress field of the tooth surface after shot peening.
2.1 Discrete Element Model
2.1.1 Model Building
EDEM simulation software is used to set up a discrete element model to simulate the projectile from the nozzle to the tooth flank.
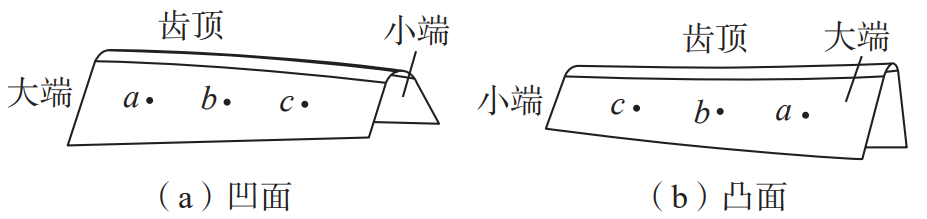
Fig.1 Location diagram of residual stress measuring points (a, b and c)

Fig.2 Measurement of residual stresses
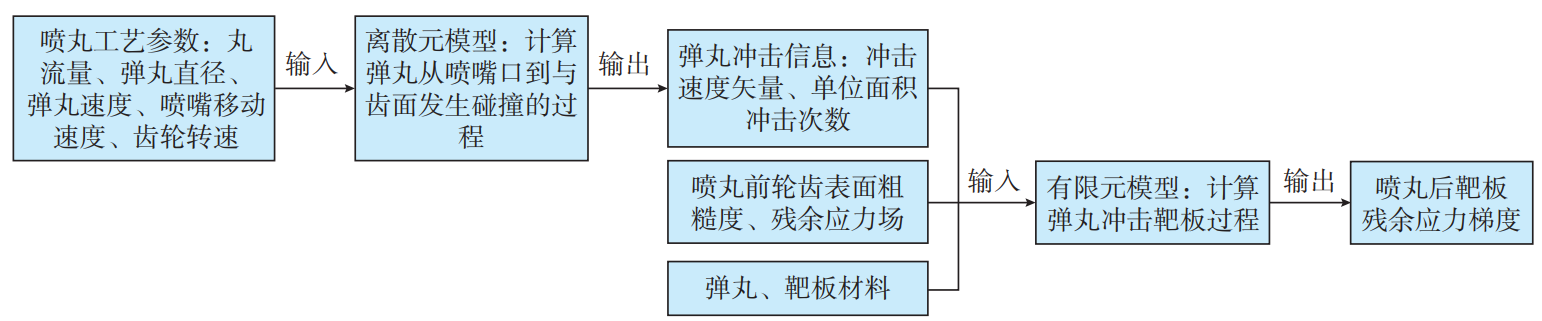
Fig.3 Modeling diagram of coupling of discrete element method and finite element method
Set the model parameters according to Section 1.2 Process Parameters, the geometry shown in Figure 4. In order to extract the impact information of the target position on the tooth surface, the Hypermesh software was used to mesh the tooth surface. In the model, the tooth surface unit is imported as the gear model, and the nozzles are set to be perpendicular to the tooth root, convex surface, and concave surface of the gear, and 150 mm away from the target surface, and move along the tooth width direction.
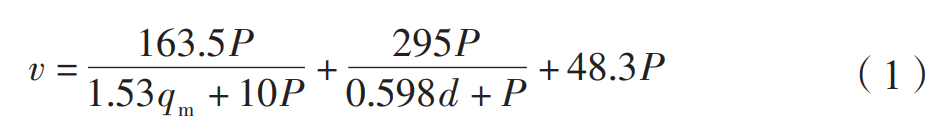
where d is the diameter of the projectile, mm; qm is the pellet flow, kg/min; P is the nozzle air pressure, MPa.
2.1.2 Data Extraction and Processing
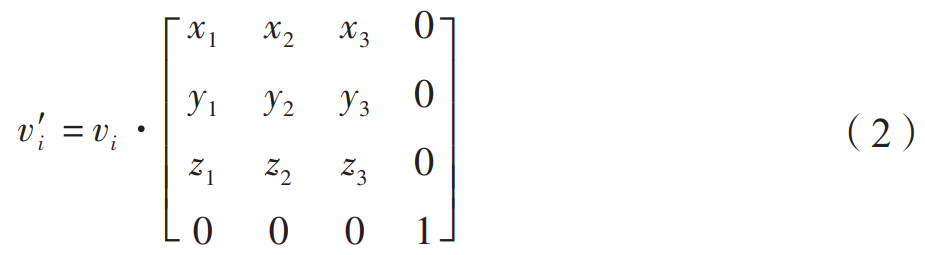
The EDEM software was used to export the calculation results, and the unit number was used to judge the position of the impact point, and the impact at the fourth-division point on the taper line of the tooth surface section was screened out for data processing. (1) Impact velocity vector. Since the gear is a curved surface, the angles between each position and the projectile beam are different, and the target plate in the finite element model is a local area on the tooth surface. Therefore, the absolute velocity of the projectile needs to be converted to the relative velocity of the flank element and the projectile. As shown in Figure 5, the surface OABC is an area on the tooth surface, which is divided into meshes and simplified into quadrilateral OABCs. With O as the coordinate origin, OA is the x′ axis, OC is the y′ axis, and z′ is determined according to the right-hand rule of the spatial coordinate system. axis to establish the Cartesian coordinate system. The unit vector of its coordinate axis is on the ground In the coordinate system, it is represented as ox→(x1,y1,z1), oy→(x2,y2,z2), oz→(x3,y3,z3)。 In the geodetic coordinate system, the velocity vector of projectile i is represented as vi(xi,yi,zi,0), represented as vi′(x′i,y′i,z′i,0) in the new coordinate system. According to the principle of shaft transformation.
(2) Number of impacts. When the actual shot peening time is t1, the number of impacts per unit area n at the target position is calculated by equation (3).
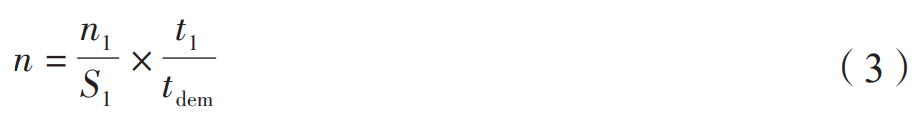
Fig.4 Schematic view of DEM geometry
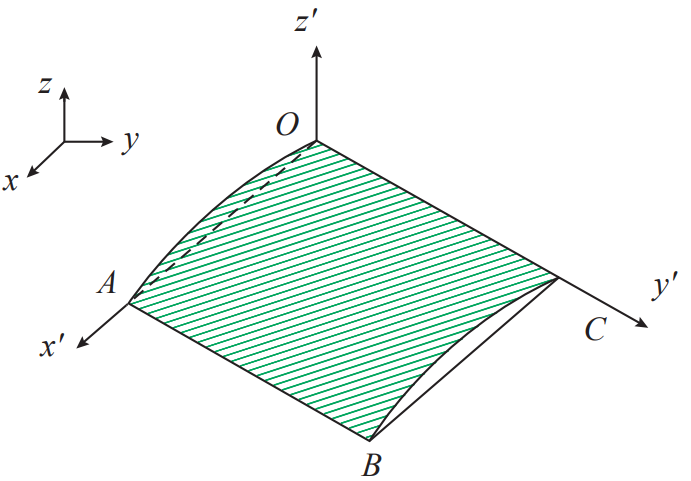
Fig.5 Diagram of coordinate system of shot velocity changes
2.2 Finite element model
Based on ABAQUS/CAE commercial finite element software, a finite element model was established to calculate the residual stress field of the tooth surface of the wheel tooth after shot peening. 2.2.1 Meshing and boundary conditions
The projectile has a diameter of 0.3 mm, the unit type is C3D8R. The target size is shown in Figure 6, with the exception of the infinite cell mesh, the target size is 1 mm×1 mm×0.5 mm, element type C3D8R, a predefined field is set in this area, and the measured residual stress of the tooth surface before shot peening is used as the initial residual stress of the model. The region I is used to limit the position of the center point of the projectile impact and extract the results of the calculation of residual stress. Regions I and II are mesh refinements, with element sizes of 10 μm× 10 μm× 10 μm. Region III is the transition area of the finite element mesh from fine to coarse. Area IVThe lattice type is infinite element CIN3D8, which is used to eliminate the reflection of stress waves at the target boundary. The underside of the target plate is completely fixed in the model. The contact relationship between the projectile and the target plate is Surface to Surface, the normal behavior is defined as “hard” contact, the tangential behavior is defined as penalty friction, and the coefficient of friction is set to 0.2.
2.2.2 Material Models
The projectile is set as an elastoplastic, the isotropic constitutive model is adopted, and the projectile parameters are set to Young’s modulus E=210 GPa, Poisson’s ratio μ=0.3, density ρ=7800 kg/m3, and yield strength σs=1400 MPa. The target material is 9310 Carburizing and hardening steel, the material parameters are set to Young’s modulus E=210 GPa, pois The pine ratio is μ=0.3, the density ρ=7800 kg/m3, the plastic stress-strain curve is Johnson–Cook model, the basic model is shown in equations (4) and (5), and the parameters are obtained by the Hopkinson pressure bar test, which are A=1234.38, respectively. B=881,C=0.018,n=0.238,m=0.686。 In order to prevent the oscillation of the stress wave, the target material damping α=6×10⁶s–1 is set.
where A, B, N, C, M are the physical property parameters of the material, which are tested by the pressure bar The results were fitted; A is the yield strength at the reference strain rate; B is the strain hardening coefficient; n is the strain hardening index; C is the strain rate hardening coefficient;
m is the temperature softening index;
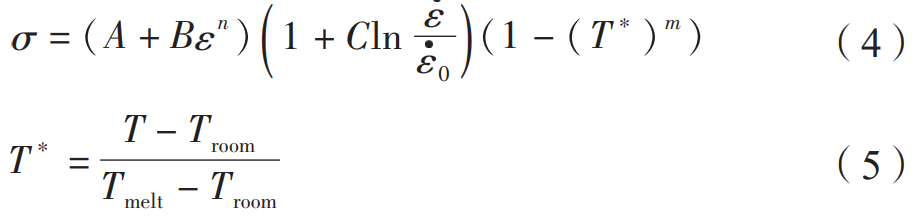
Book σ = (A + Bεn) 1 + Cln εε ( ) 0
(1 – (T) m ) is the test strain rate; book σ = (A + Bεn ) 1 + Cln ε ε ( ) 0(1 – (T) m ) is the reference strain rate; T is the test temperature; Tmelt is the melting point of the material (9310 alloy steel has a melting point of 1510 °C); Troom is the reference temperature with a value of 25 °C.
2.2.3 Projectile impact information
The angle, velocity, and number of projectile impacts are determined by the calculations in Section 2.1.2. According to the ASH110 model projectile size standard, the projectile is set to be spherical with a diameter of 0.3 mm. Considering the random distribution of projectile impact positions in the actual situation, the Python language programming is used in the simulation, and the random function is used to generate random positions, and the center points of projectile impact are all in the region I. shown in Figure 6.
3 Results and Discussion
3.1 Comparison of simulation and test results
In order to verify the accuracy of the simulation model, the same process parameters were set as the test in the established shot peening process simulation model. Figure 7 shows the measured and simulated 3D topography of point b of the convex surface after shot peening. According to equation (6), the 3D roughness Sa value is calculated, the measured value is 0.35 μm, the simulation result is 0.386 μm, and the error is 10.3%. In the x and y directions, the resolution of the simulation results is lower than that of the measured results, because the sampling spacing of the measured data is 0.5 μm The target grid size of the limited element model is 10 μm × 10 μm.
where n is the number of data points; Zi is the height value of the i-th node.
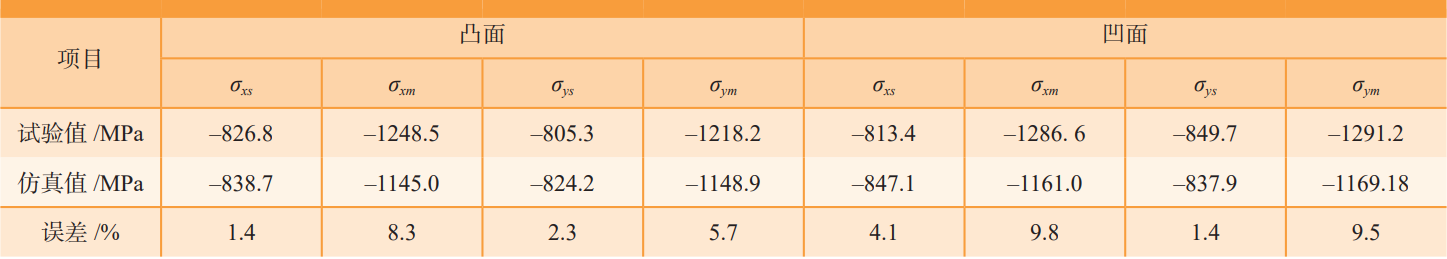
Table 1 shows the residual stress values in the direction of the tooth height on the tooth surface measured and simulated after shot peening. The positions of points a, b, and c are consistent with those in Figure 1. The results show that the surface residual stress at each point of the tooth is between –800~–880 MPa, and the calculation error is within 6%. Fig. 8 shows the distribution of the measured and simulated residual stresses at points b of the convex and concave surfaces along the depth direction, where σx is the residual stress in the direction of the tooth width. σy is the tooth height Directional residual stresses. After shot peening, the residual stress of the convex and concave surfaces of the teeth changed consistently, and the residual compressive stress value of the concave surface was slightly greater than that of the convex surface. The residual stress in the direction of tooth width and the direction of tooth height are similar, the surface residual stress is about –800~–850 MPa, the maximum residual compressive stress value is between 1200~1300 MPa, and the depth is about 20~30 μm. As shown in Table 2, the error between the measured value and the simulation result is less than 10%, which proves that the simulation model can accurately predict the spiral Residual stress field of the surface layer of the gear tooth after bevel gear shot peening.
3.2 Shot peening time effect
The shot peening coverage is affected by the shot flow rate and shot peening time, and the increase of the shot flow rate and shot peening time will increase the number of projectile impacts and increase the shot peening coverage. In this paper, the influence of shot peening time on the residual stress field is mainly studied, and the results are shown in Figure 9. Based on the method of Miao et al., the shot peening coverage was calculated. Under the condition that the initial velocity of the projectile is 40 m/s, when the shot peening time reaches 72 s, the number of projectile impacts is 360 pieces/mm2, and the shot peening coverage reaches 98%, that is, the full coverage rate [11]. When the shot peening time is 144 s, the coverage is 200%. With the increase of shot peening time: (1) the residual pressure on the surface of the target plate should be corresponded The force increases, and when the shot peening time reaches 72 s, it gradually stabilizes at 800 MPa Around; (2) The residual compressive stress at 10 μm showed a gradual increase trend, and stabilized after the shot peening time reached 96 s, which was about 1000 MPa. (3)20 μm After 72 s, the residual compressive stress at 20 μm was higher than that at 10 μm, indicating that the maximum residual compressive stress depth increased from 10 μm to 20 μm. This results show that increasing the shot peening time can effectively increase the residual compressive stress value of the subsurface layer of the material and increase the depth of the maximum residual compressive stress layer.
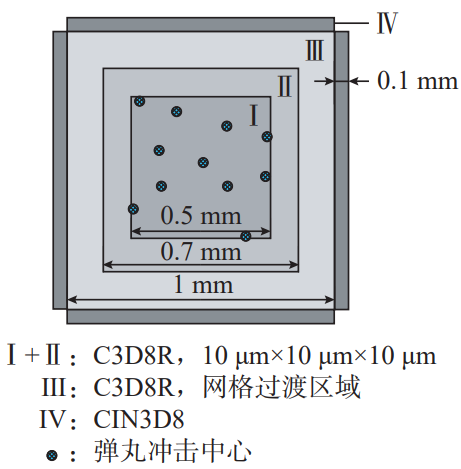
Figure 6 Schematic diagram of the impact target plate geometry

Fig.7 Three-dimensional surface topography of tooth flank after shot peening
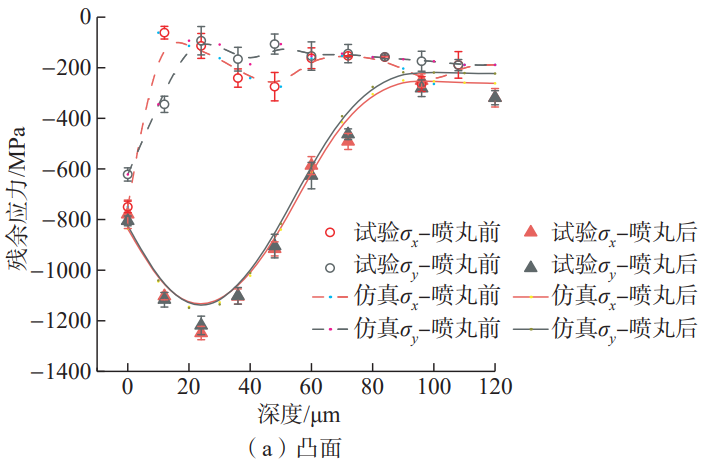
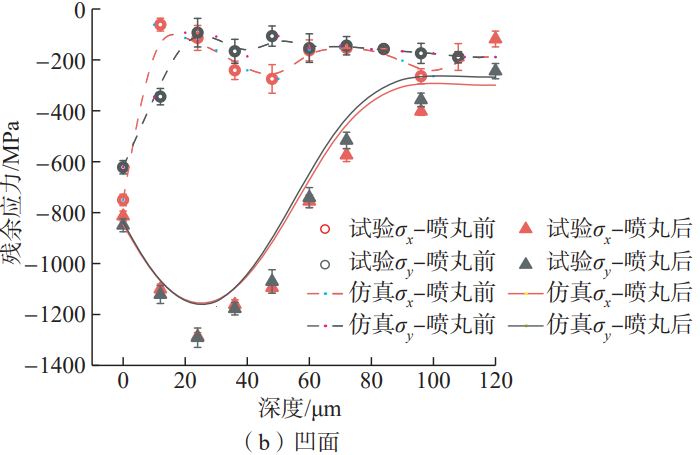
Fig.8 Measured and simulated residual stress distribution of point b in convex and concave
3.3 Projectile velocity effect
From equation (3), it can be seen that the initial velocity of the projectile is determined by the nozzle air pressure, the pellet flow rate, and the projectile diameter, in which the nozzle air pressure is the main factor. The increase of nozzle air pressure will significantly increase the projectile velocity and improve the shot peening strength. The projectile is set with reference to the test projectile velocity range of Nordin et al. The initial velocity, residual stress calculations are shown in Figure 10, and the contour plot is shown in Figure 11. The results show that when the projectile velocity increases from 30 m/s to 40 m/s and 50 m/s, the residual compressive stress induced by shot peening increases, the surface residual compressive stress value changes slightly, the maximum residual compressive stress values are –1104.7 MPa, –1144.9MPa, and –1167.3 MPa, and the maximum residual compressive stress depths are 20 μm, 25 μm, and 30 μm, respectively. The results show that with the increase of projectile velocity, the residual compressive stress value on the surface of the target plate does not change much, but the maximum residual stress The value of the compressive stress and the depth of the maximum residual compressive stress will continue to increase.
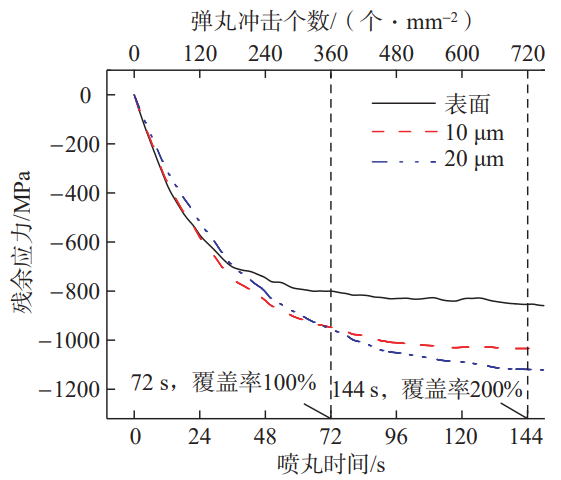
Fig.9 Influence of shot peening time on residual stress results
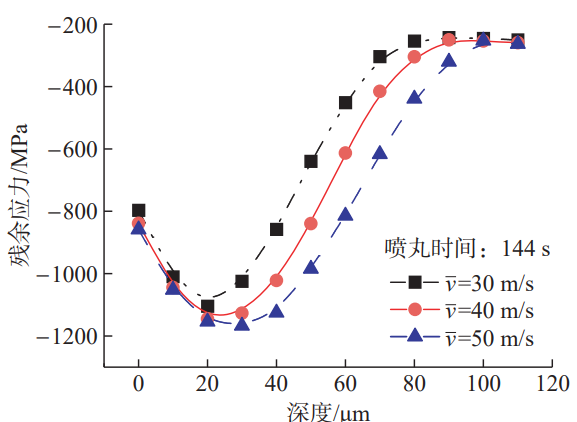
Fig.10 Influence of shot velocity on residual stress results
Table 2 Measured and simulated residual stress values of point b in convex and concave
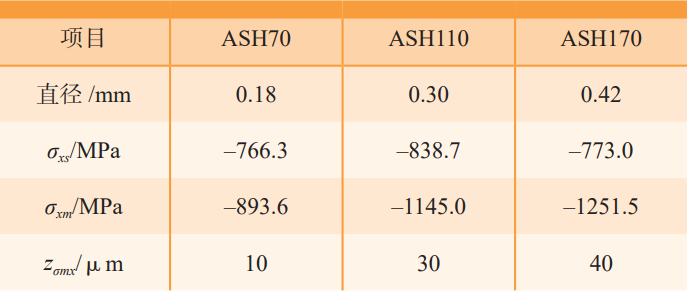
3.4 Projectile diameter effect
The calculation of the residual stress field under impact of different projectile diameters is shown in Figures 12 and 13. The projectile diameter is set according to the SAE standard, and ASH70, ASH110, and ASH170 types are used, and Table 3 shows the correspondence between each type of projectile and its diameter. The results show that when the projectile diameter increases, the surface residual stress value changes slightly, but the maximum residual compressive stress value and the maximum residual compressive stress depth are significantly increased. When the diameter of the projectile is 0.18 mm
When the pressure is increased to 0.30 mm and 0.42 mm, the surface residual compressive stress is between –760~–840 MPa, and the maximum residual compressive stress value is –893.6 MPa
to –1145.0 MPa and –1251.5 MPa, maximum residual compressive stress The depth was increased from 10 μm to 30 μm and 40 μm. However, an increase in the diameter of the projectile will increase the surface roughness of the gear. The reason is that when the diameter of the projectile is high, the kinetic energy of the projectile increases, and when it is impacted with the tooth surface, the plastic strain of the material increases, thereby increasing the crater radius, which will significantly improve the surface roughness of the gear.
4 Conclusion
Based on the coupling method of discrete elements and finite elements, a simulation and calculation model of the residual stress field of AISI 9310 steel spiral bevel gears is established, and the correlation between the process parameters and the residual compressive stress of the tooth surface after shot peening is explored.
(1) The prediction error of the residual stress field of the tooth surface of the simulation model established in this paper is within 10%, and the calculation results are accurate.
(2) When the shot peening time is 72 s, the number of projectile impacts reaches 360 pcs/mm2, and the target coverage reaches full coverage. As the shot peening time continued to increase, the compressive stress on the target surface gradually stabilized at around –800 MPa.
(3) The shot peening process mainly affects the residual stress field from the surface of the gear tooth to a depth of 50 μm, and when the depth is greater than 50 μm, the residual stress field is determined by the pre-shot peening process.
(4) When the shot peening coverage is 200%, the change of projectile diameter and velocity has little effect on the surface residual compressive stress of the parts used in this paper.
(5) When the initial velocity and diameter of the projectile increase, the residual compressive stress value on the surface of the target plate changes slightly, and the maximum residual compressive stress value and the maximum residual compressive stress depth of the target plate surface are significantly improved, in which the maximum residual compressive stress value can be increased to 1251.5 MPa, and the maximum residual compressive stress depth can be increased to 40 μm.
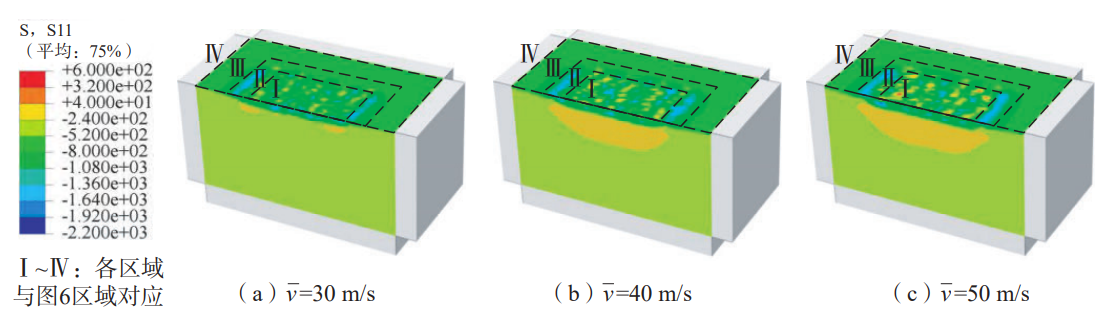
Fig.11 Simulated residual stress of target impacted by different shot velocities
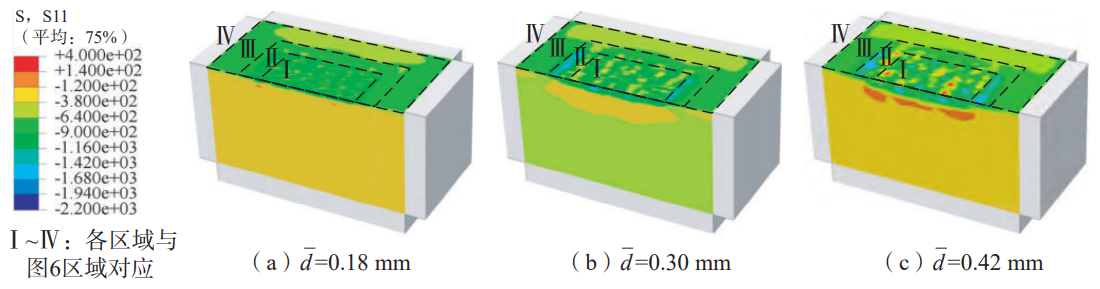
Fig.12 Simulated residual stress of target impacted by different shot diameters
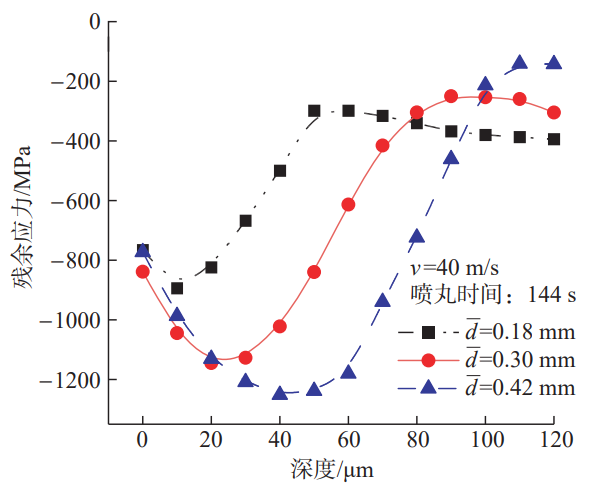
Fig.13 Influence of shot diameter on residual stress results
Table 3 Diameter of different types of shots and residual stress calculation results