
The design and reliability of power transmission systems critically depend on the performance of their constituent gears, with the spur gear being one of the most fundamental and widely used types. The primary failure modes threatening spur gear longevity are tooth root bending fatigue fracture and surface contact fatigue (pitting). Accurate prediction of the stresses leading to these failures is therefore paramount in mechanical design. While established theoretical methods provide a foundation, modern Computer-Aided Engineering (CAE) tools, particularly Finite Element Analysis (FEA), offer a powerful means to simulate complex stress states under realistic loading conditions. This article presents a detailed, first-person perspective exploration of spur gear meshing fatigue strength, systematically comparing theoretical calculations with advanced FEA simulations. The focus remains on the spur gear throughout, examining methodologies, results, and the nuanced factors that influence the accuracy of both approaches.
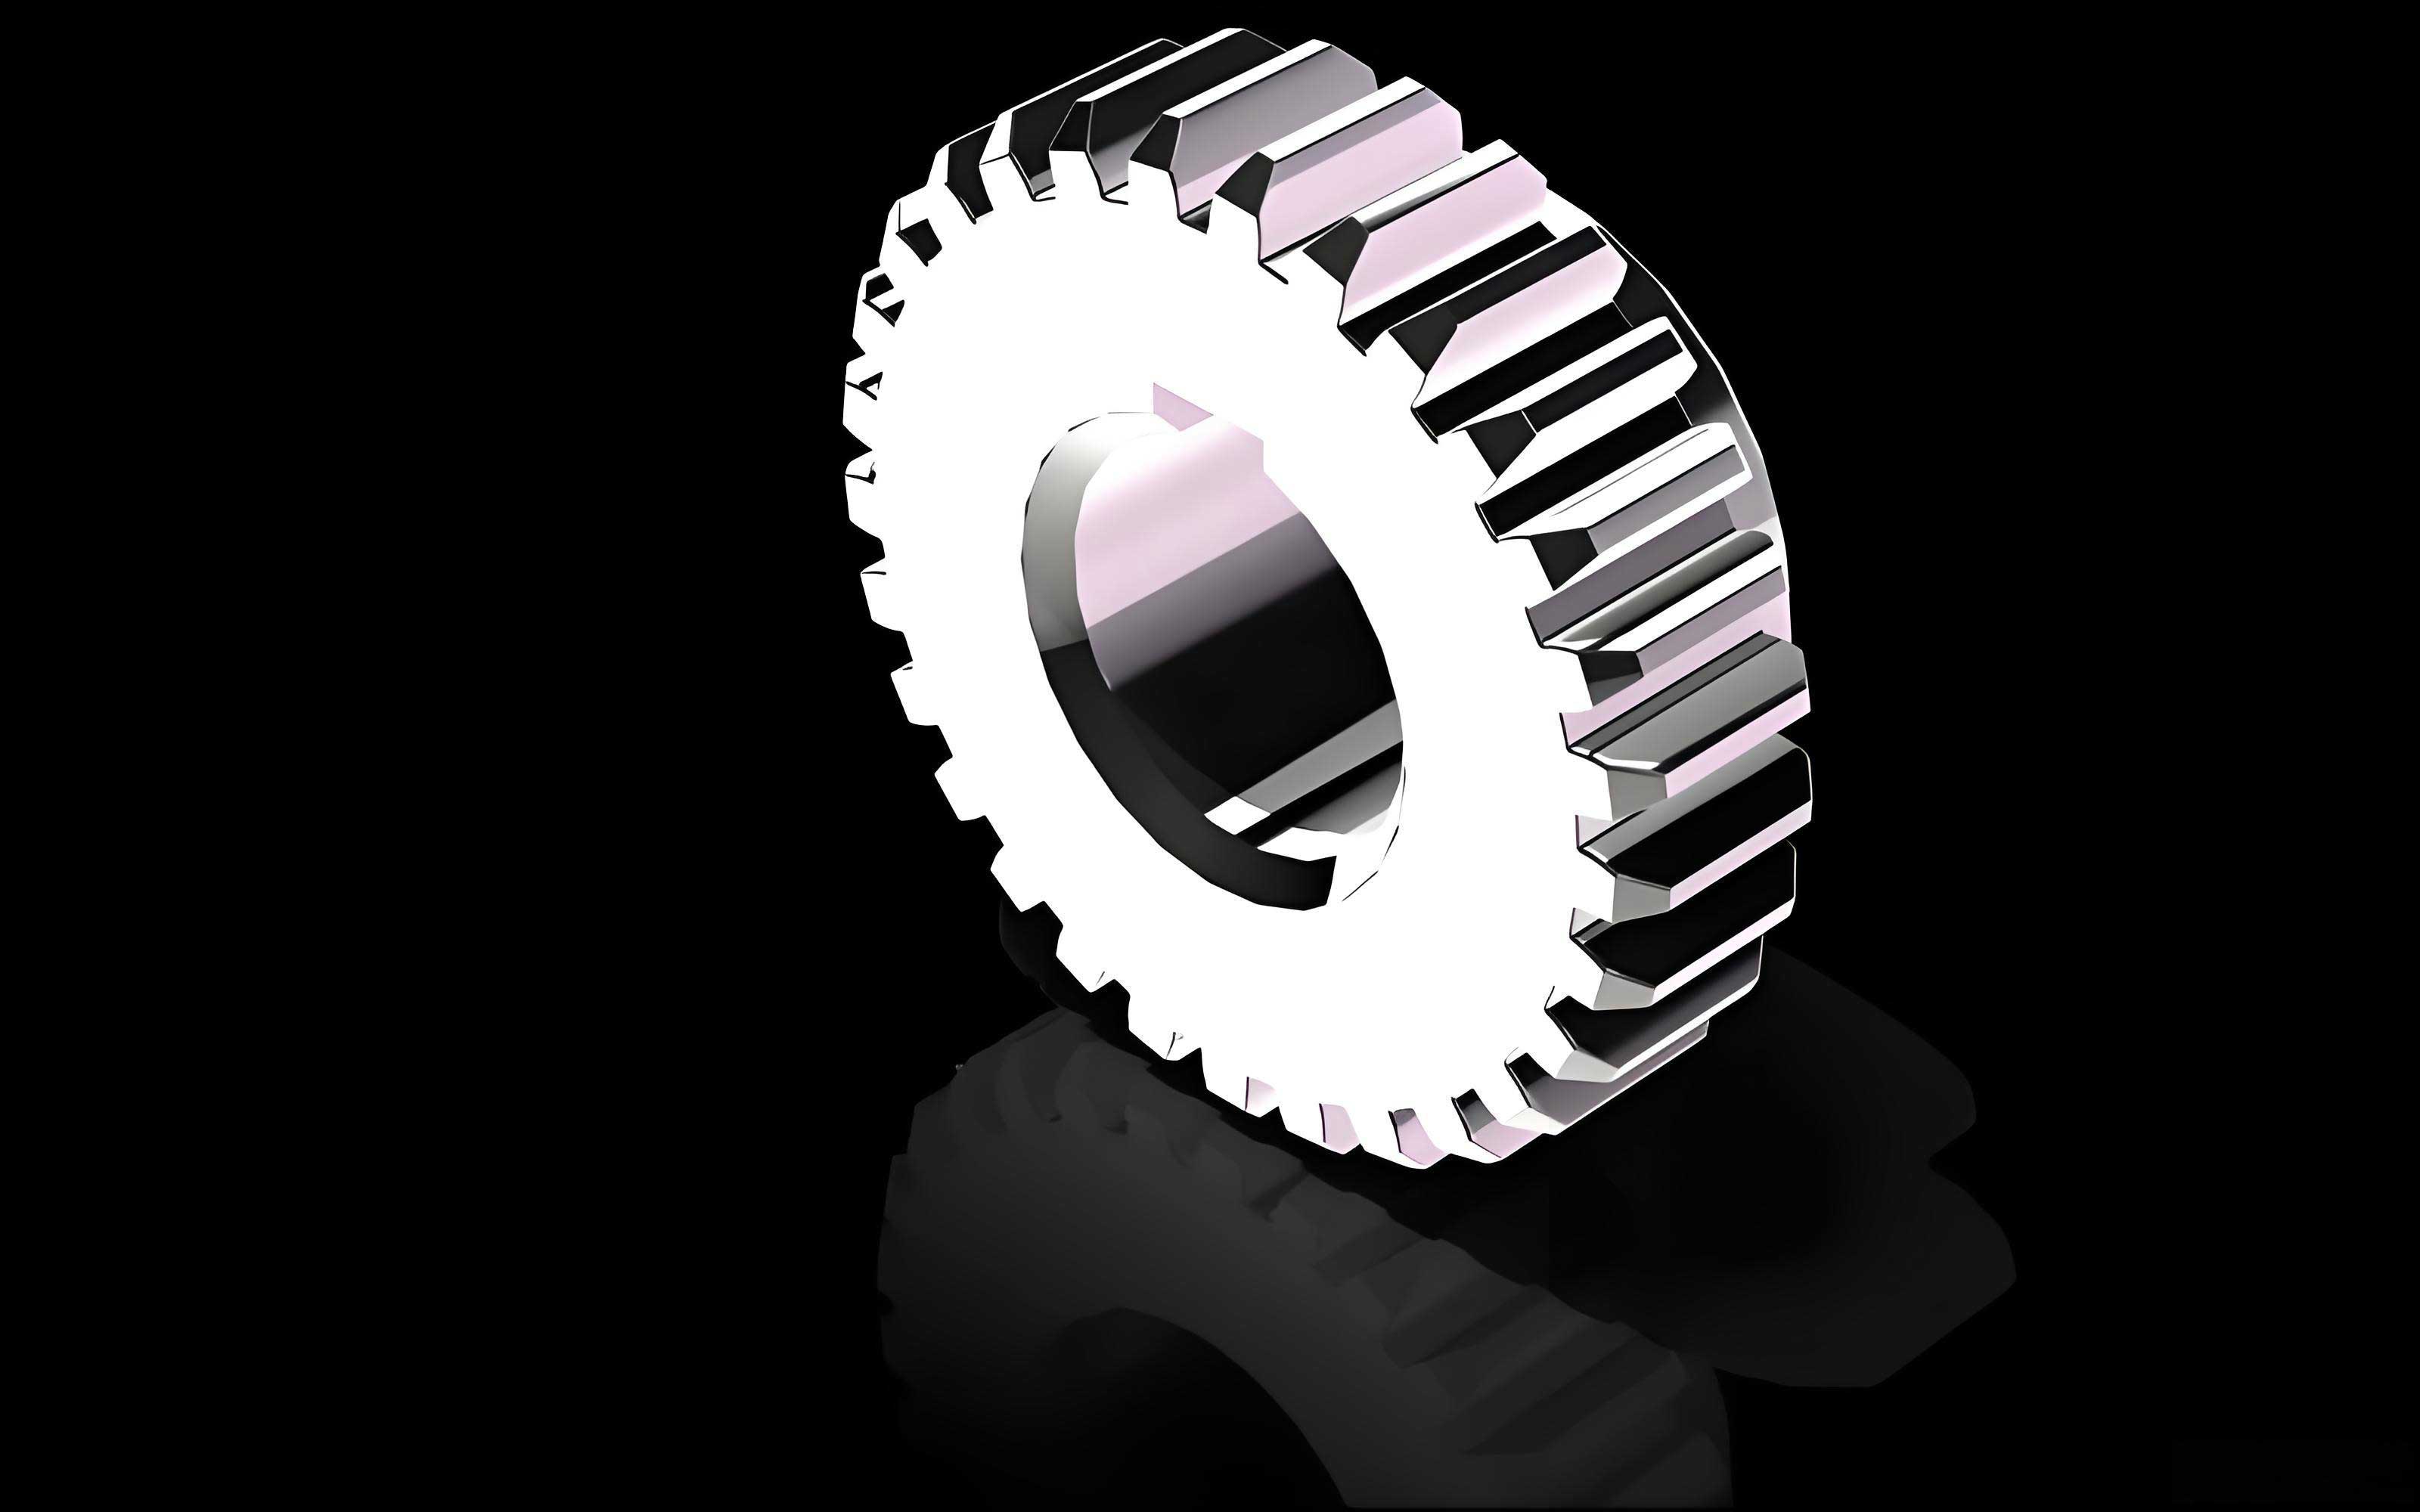
The foundational step in any analysis is the creation of an accurate geometrical model. For a spur gear, the tooth profile is defined by an involute curve. The Cartesian coordinates for a standard involute are given by:
$$ x = r_b (\cos(s) + s \cdot \sin(s)) $$
$$ y = r_b (\sin(s) – s \cdot \cos(s)) $$
where \( r_b \) is the base circle radius and \( s \) is the roll angle in radians. For a spur gear with module \( m \), number of teeth \( z \), and pressure angle \( \alpha \), the base radius is \( r_b = \frac{m z \cos(\alpha)}{2} \). A precise 3D model was developed using these equations, paying particular attention to the fillet geometry at the tooth root, as this region is critical for bending stress concentration. The parameters for the analyzed spur gear are summarized in the table below.
| Parameter | Symbol | Value | Unit |
|---|---|---|---|
| Module | m | 3 | mm |
| Number of Teeth (Driver) | z₁ | 50 | – |
| Face Width | b | 90 | mm |
| Pressure Angle | α | 20 | ° |
| Transmission Ratio | i | 3.6 | – |
| Input Torque | T₁ | 320 | N·m |
Theoretical Strength Calculation for Spur Gears
Theoretical methods for spur gear strength are well-established in standards and textbooks. They are based on simplifying assumptions to make manual calculation feasible. The analysis focuses on the most critically loaded tooth.
Tooth Root Bending Fatigue Strength
The worst-case bending scenario is typically considered to be when the total load is applied at the tip of a single tooth. The tooth is modeled as a cantilever beam with a parabolic stress distribution. The nominal bending stress at the root can be calculated using the Lewis formula, often extended with correction factors. A common form of the bending stress check formula is:
$$ \sigma_F = \frac{2 K T_1 Y_F}{b m^2 z_1} \leq [\sigma_F] $$
where:
- \( K \) is the application factor (accounting for dynamic loads from external sources),
- \( T_1 \) is the input torque,
- \( Y_F \) is the tooth form factor (dependent on tooth geometry and load application point),
- \( [\sigma_F] \) is the permissible bending stress of the material.
This formula inherently neglects the compressive stress component from the radial load and treats the stress state as pure bending.
Tooth Surface Contact Fatigue Strength
The primary cause of surface failure (pitting) is the repetitive Hertzian contact stress between mating spur gear teeth. The calculation is based on the contact of two cylinders with radii equivalent to the curvatures of the tooth profiles at the pitch point. For a steel spur gear pair, a standard contact stress formula is:
$$ \sigma_H = 670 \sqrt{ \frac{(i+1)^3 K T_1}{i b m^2 z_1^2} } \leq [\sigma_H] $$
where \( [\sigma_H] \) is the permissible contact stress. This equation provides the maximum compressive stress at the center of the contact ellipse/patch. For the example spur gear with an application factor \( K = 1.5 \), form factor \( Y_F = 2.57 \), \( [\sigma_F] = 185 \) MPa, and \( [\sigma_H] = 491 \) MPa, the theoretical results are:
$$ \sigma_{F, theory} = 60.2 \text{ MPa}, \quad \sigma_{H, theory} = 367.3 \text{ MPa} $$
Both values are below their respective permissible limits, indicating a theoretically safe design.
Finite Element Analysis Methodology for Spur Gears
FEA provides a more holistic view of the stress state by solving the equilibrium equations over the complex spur gear tooth geometry without some of the major simplifications of theoretical methods. The process involves several key stages:
Model Preparation and Material Definition
Due to the cyclic symmetry of a spur gear, analyzing a single tooth segment with appropriate boundary conditions is sufficient and computationally efficient. The model is constrained at the inner bore surface, simulating a rigid connection to the shaft. The material properties for 40Cr alloy steel (quenched and tempered) were assigned, as detailed in the following table comparing common spur gear materials.
| Material | Elastic Modulus (E) | Poisson’s Ratio (ν) | Yield Strength (Typical) |
|---|---|---|---|
| 40Cr (Quenched & Tempered) | 206 GPa | 0.28 | > 550 MPa |
| 20MnCr5 (Case Hardened) | 206 GPa | 0.28 | > 1000 MPa (Surface) |
| Cast Iron Grade 250 | 110-130 GPa | 0.26 | 250 MPa |
Meshing Strategy and Load Application
An automatic tetrahedral mesh was generated, with local refinement applied to the tooth root fillet and the contact surface regions where high stress gradients are expected. Mesh convergence was verified by comparing results from successively finer meshes. The load was applied as a distributed force on the working flank of the spur gear tooth. For bending analysis, the force was decomposed into tangential and radial components \( F_t \) and \( F_r \) corresponding to the theoretical load at the tooth tip.
$$ F_t = \frac{2 T_1}{m z_1}, \quad F_r = F_t \cdot \tan(\alpha) $$
For contact stress analysis, the total normal force \( F_n = F_t / \cos(\alpha) \) was applied to a segment of the flank near the pitch line, simulating the mating action. Crucially, in this FEA setup, the full vector force is applied, meaning both bending and direct compressive stresses are inherently accounted for, unlike in the pure-bending theoretical assumption.
Simulation Results and Comparative Analysis
The FEA simulation produced detailed von Mises stress contour plots. The maximum bending stress was located at the root fillet, slightly offset from the theoretical point defined by the 30° tangent method. The contact analysis showed a semi-elliptical stress distribution on the flank, with the maximum subsurface shear stress (a driver for pitting) located beneath the surface.
The key results from the spur gear FEA simulation and their comparison with theoretical values are summarized below:
| Stress Type | Theoretical Calculation (MPa) | FEA Simulation (MPa) | Percentage Difference | Permissible Stress (MPa) |
|---|---|---|---|---|
| Root Bending Stress, \( \sigma_F \) | 60.2 | 66.5 | +10.5% | 185 |
| Surface Contact Stress, \( \sigma_H \) | 367.3 | 313.6 | -14.6% | 491 |
Interpretation of Differences for Spur Gears
The observed differences are systematic and reveal the limitations and strengths of each method when applied to spur gears.
1. Bending Stress Discrepancy: The FEA-predicted bending stress is higher. This is primarily because the theoretical formula (Eq. 1) ignores the compressive stress \( \sigma_c \) from the radial component of the load. In the FEA, the combined stress state at the root is evaluated using the von Mises criterion \( \sigma_{vM} \), which for a bi-axial state is:
$$ \sigma_{vM} = \sqrt{\sigma_b^2 + \sigma_c^2 – \sigma_b \sigma_c} $$
where \( \sigma_b \) is the bending stress. Even though \( \sigma_c \) is relatively small, its inclusion increases the equivalent stress \( \sigma_{vM} \) compared to \( \sigma_b \) alone. The FEA result is thus considered more accurate for the static load case applied.
2. Contact Stress Discrepancy: The FEA-predicted contact stress is lower. The theoretical formula (Eq. 2) is derived for contact along the line of action, often assuming load application at a specific point. The FEA simulation, with a more distributed load area and a comprehensive 3D model of the spur gear tooth, may result in a slightly different effective curvature and load distribution, leading to a lower peak Hertzian pressure. Furthermore, the theoretical constant (670) encapsulates material properties for steel; any deviation in the assumed effective modulus can cause variation.
3. Critical Omission in Both Methods: It is vital to note that the presented FEA simulation, like the basic theoretical calculation, is a static analysis. It does not account for dynamic effects arising from factors like manufacturing errors, shaft misalignment, or variable loading during operation. In practice, these effects are covered by the application factor \( K \). Therefore, a truly comparable FEA-based design check for a spur gear should apply a dynamically increased load: \( F_{n,dynamic} = K \cdot F_n \). If the FEA stress \( \sigma_{FEA,static} = 66.5 \) MPa is scaled by \( K=1.5 \), the design stress becomes ~100 MPa, which is still safe but provides a more realistic margin.
Advanced Considerations in Spur Gear Simulation
To enhance the fidelity of spur gear fatigue life prediction, several advanced factors must be considered beyond basic static analysis.
Mesh Sensitivity and Convergence
The accuracy of FEA results for stress concentration zones like the tooth root of a spur gear is highly dependent on mesh density. A convergence study is essential. The maximum bending stress is monitored as the global element size is refined. The results can be extrapolated to estimate the “true” stress value. A sample convergence study is illustrated below:
| Element Size (mm) | Number of Elements | Max Bending Stress \( \sigma_{F,max} \) (MPa) | Relative Change |
|---|---|---|---|
| 2.5 | ~4,200 | 61.8 | – |
| 1.4 | ~8,500 | 66.5 | +7.6% |
| 0.8 | ~25,000 | 68.9 | +3.6% |
| Extrapolated (0) | ∞ | ~70.5 (Estimated) | +2.3% |
The relative error \( e \) between successive meshes can be estimated by:
$$ e = \frac{|\sigma_{i} – \sigma_{i-1}|}{\sigma_{i}} $$
where \( \sigma_i \) is the stress from the finer mesh. Mesh refinement should continue until this error falls below an acceptable threshold (e.g., 2-5%).
Incorporating Load Sharing and Multi-Tooth Contact
A more sophisticated model for a spur gear involves analyzing a sector with multiple teeth to study load sharing between mating pairs. The contact ratio \( \varepsilon_\alpha \) for spur gears, typically between 1.4 and 1.8, indicates that for a portion of the mesh cycle, two pairs of teeth share the load. A multi-tooth FEA model can automatically calculate this load distribution, which reduces the maximum stress on a single tooth compared to the worst-case single-pair contact assumption used in basic theory and single-tooth FEA. The effective load on the most stressed tooth can be expressed as:
$$ F_{n, effective} = \frac{F_n}{LSF} $$
where \( LSF \) is the Load Sharing Factor (\( 1 \leq LSF \leq 2 \)).
Fatigue Life Estimation from Stress Results
The final goal is to predict the spur gear’s fatigue life. Using the FEA-calculated stress amplitudes and mean stresses, combined with the material’s S-N (Wöhler) curve or the strain-life (ε-N) curve for low-cycle fatigue, the number of cycles to failure can be estimated. For bending fatigue at the root, the stress-life approach is common. The permissible bending stress \( [\sigma_F] \) is derived from the material’s fatigue limit \( \sigma_{FL} \), modified by factors for size \( Y_X \), sensitivity \( Y_\delta \), and required safety factor \( S_F \):
$$ [\sigma_F] = \frac{\sigma_{FL} Y_X Y_\delta}{S_F} $$
The FEA-calculated stress \( \sigma_{F, FEA} \) must satisfy \( \sigma_{F, FEA} \leq [\sigma_F] \). A similar process, using the permissible contact stress \( [\sigma_H] \) derived from the surface endurance limit, is applied for pitting resistance. Modern FEA suites can directly perform fatigue post-processing based on the stress fields, providing a life contour plot across the spur gear tooth.
Synthesis and Practical Design Implications for Spur Gears
The integrated CAD-CAE workflow provides a robust framework for spur gear design and validation. The comparative analysis yields the following critical insights for the practicing engineer:
1. Complementary Roles: Theoretical formulas offer a rapid, first-pass sizing tool for spur gears and are invaluable for standardization. FEA provides a detailed, localized stress picture, essential for validating high-performance or non-standard spur gear designs, optimizing fillet geometry, and identifying potential failure initiation sites.
2. Correcting the Comparisons: For a fair assessment, the theoretical bending stress calculation should be viewed as a component of the total stress. A more comprehensive theoretical estimate for the von Mises stress at the root could be approximated by superposing bending and direct compressive stresses. Conversely, the static FEA result must be proportionally increased by the application factor \( K \) to represent real-world dynamic conditions before being compared against the permissible stress. The corrected comparisons would be:
$$ \sigma_{F, corrected\_theory} \approx \sqrt{(\sigma_{F, theory})^2 + (\sigma_c)^2 – (\sigma_{F, theory})(\sigma_c)} $$
$$ \sigma_{F, corrected\_FEA} = K \cdot \sigma_{F, FEA(static)} $$
3. Design Optimization Pathway: The parametric nature of the CAD model linked with FEA allows for efficient design of experiments (DOE) and optimization. Key spur gear parameters such as fillet radius \( \rho_f \), addendum modification coefficient \( x \), and even micro-geometry modifications like tip and root relief can be varied automatically. The FEA solver then evaluates the objective function (e.g., minimize maximum bending stress) for each design iteration, converging on an optimal spur gear geometry that traditional handbook methods could never reveal.
4. Towards a Hybrid Methodology: The most reliable design approach for critical spur gear applications is a hybrid one. Use theoretical standards (ISO, AGMA, DIN) for initial gear train layout and sizing. Then, employ high-fidelity, dynamic FEA—potentially including multi-body simulation software to generate realistic time-varying loads—to perform a final verification and refinement of the spur gear teeth. This methodology leverages the speed of theory and the precision of simulation, ultimately leading to spur gears that are both efficient and highly reliable.
In conclusion, the analysis of spur gear meshing fatigue strength exemplifies the evolution from simplified analytical models to high-fidelity digital simulation. While theoretical calculations provide a essential and conservative baseline, finite element analysis reveals the complex, multi-axial stress state inherent in spur gear tooth loading, particularly clarifying the combined effect of bending and compression at the root. The consistent and repeated focus on the spur gear throughout this process—from involute generation and meshing to stress interpretation—highlights the tailored application of these engineering principles. The future of spur gear design lies in the seamless integration of these methods, where simulation not only validates theory but actively drives the creation of stronger, lighter, and more durable power transmission components.