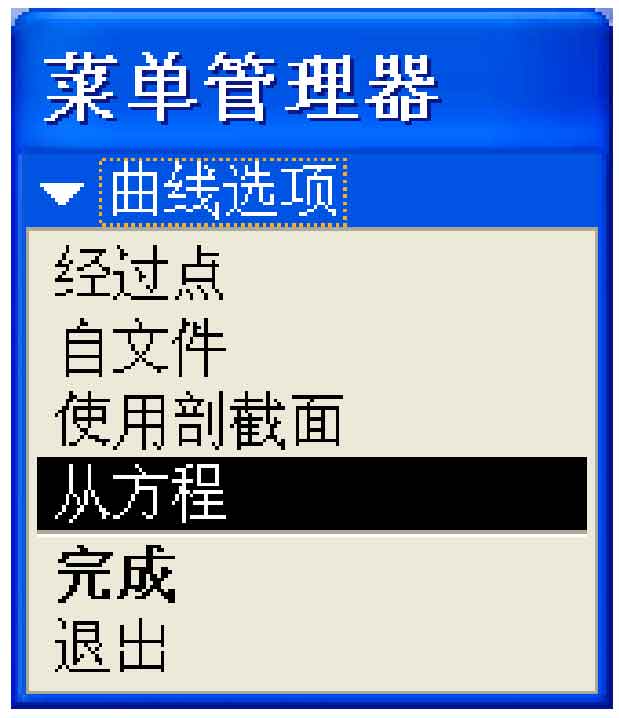
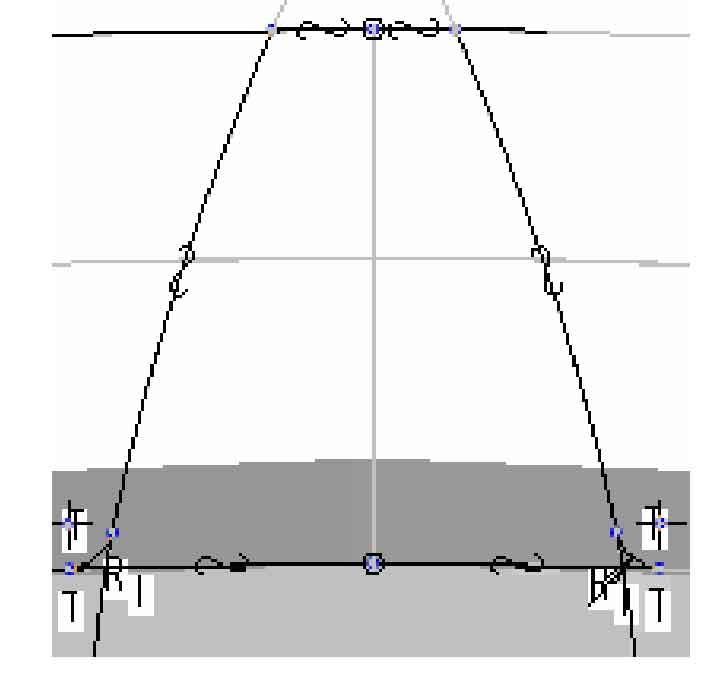
The research shows that the tooth profile of a single tooth of hypoid gear is a closed profile surrounded by four parts: partial spherical involute, tooth top arc segment, tooth root arc segment and tooth root transition curve. After the establishment of hypoid gear blank, using the function of generating curve through equation and taking the selected coordinates as a reference, the establishment of spherical involute is completed first. The generation principle of spherical involute is introduced and the mathematical equation is deduced. Therefore, the spherical involute equation can be used in Pro / E2 The spherical curve is generated directly through the involute equation 0. Open Pro / E2 0 software system’s “curve options” menu manager, as shown in Figure 1,
According to the spherical involute equation derived from, the following equation can be entered in the open Notepad:
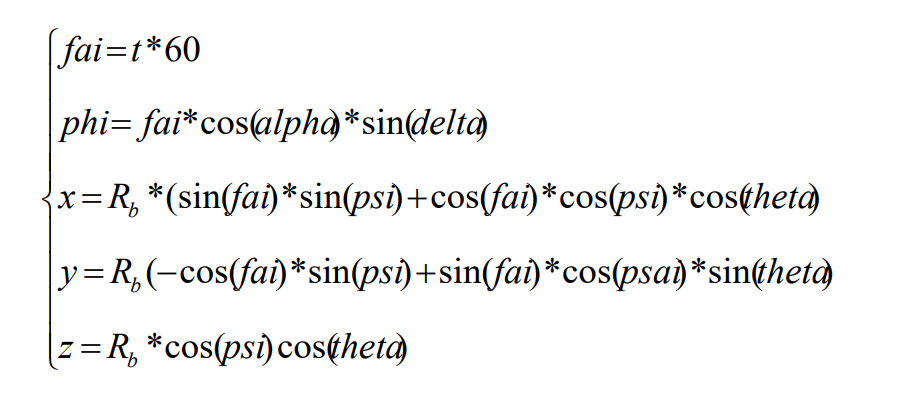
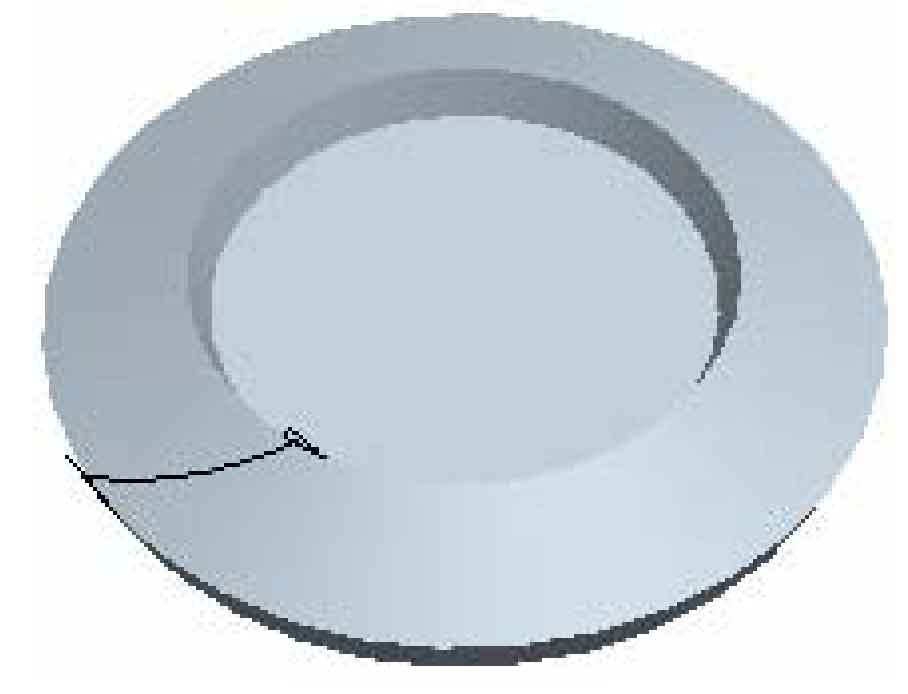
The generated spherical involute is shown in Figure 2:
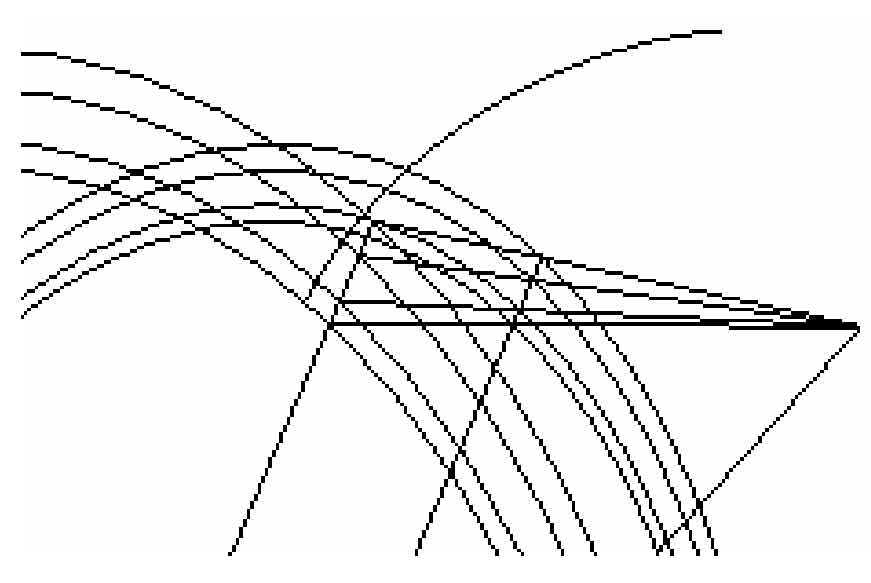
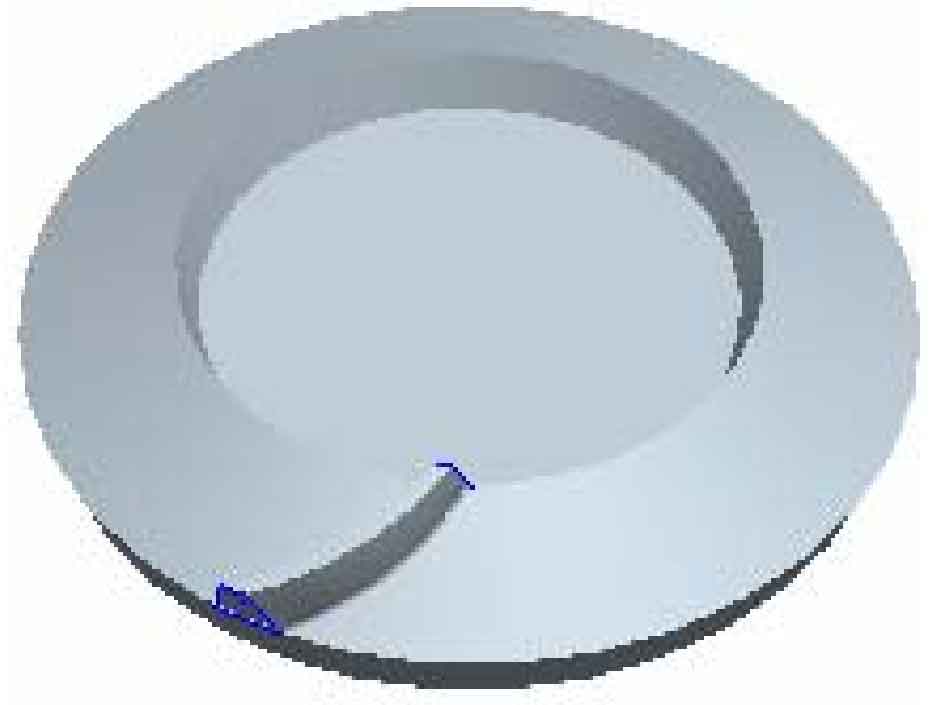
Similarly, input the addendum circle equation and root circle equation in the Notepad to generate the addendum circle and root circle of a single large gear tooth at the big end. Select two spherical involute partial arcs and complete the root transition curve to generate a single tooth profile, as shown in Figure 3:
Similarly, draw the tooth profile and tooth line of small end face, as shown in Figure 4:
After completing the tooth profile and tooth profile of the large end face and small end face of a single tooth, the variable section scanning method in Pro / E is used to scan along the tooth profile according to the generated large and small end tooth profile to obtain a single tooth of the large gear of the hypoid gear pair, as shown in Fig. 5:
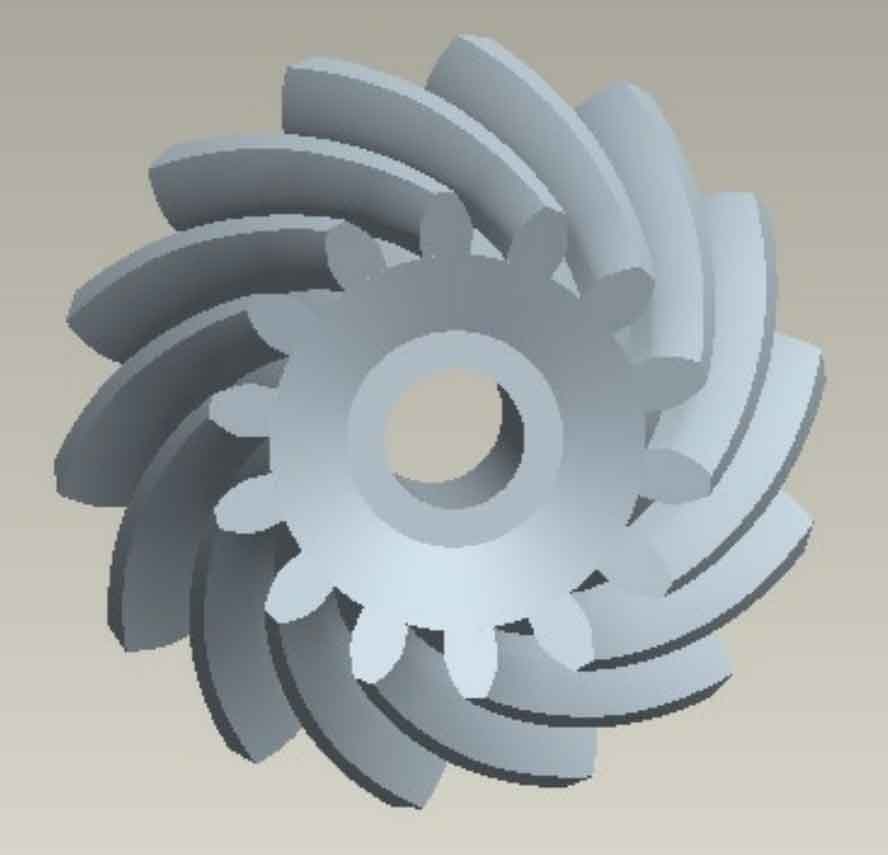
After the establishment of a single tooth, the three-dimensional modeling of the whole hyperbolic gear is completed by using the copy and array functions. The completed large gear of hypoid gear pair is shown in Figure 6,
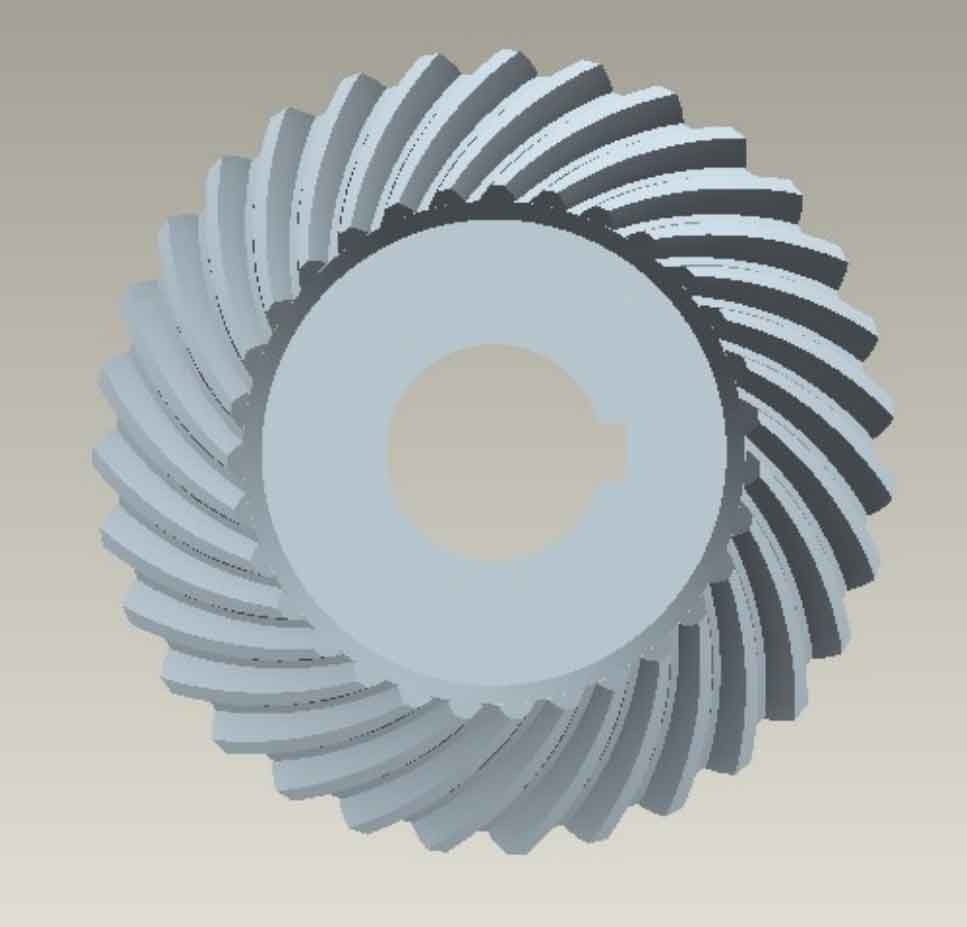
Similarly, the three-dimensional model of hypoid gear and pinion can be established by the steps of creating large gear, as shown in Figure 7,