
Why residual stress decides the quality of a cut bevel gear
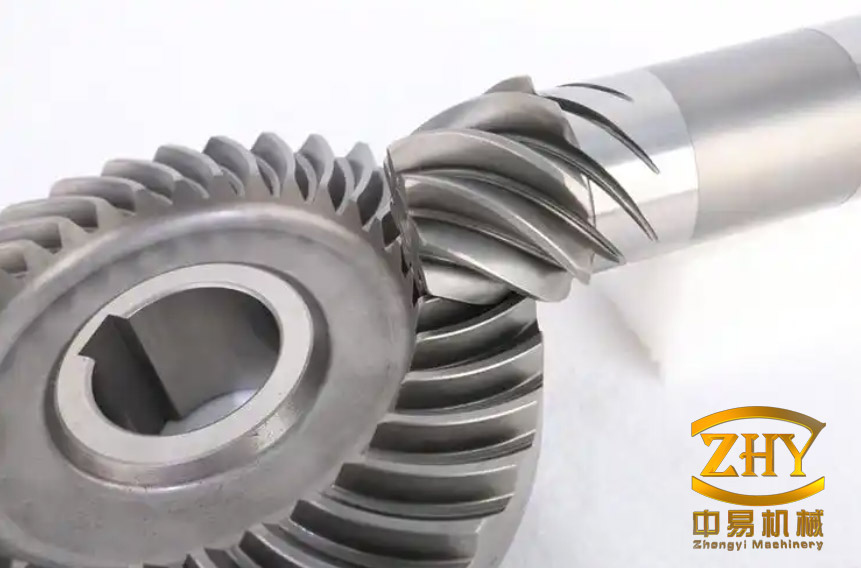
Spiral bevel gears transmit motion between intersecting shafts with a high contact ratio, and they do so with high efficiency, low vibration and low noise while carrying heavy loads. That combination keeps them in vehicle drivelines, construction and mining machinery, and aerospace transmissions. The same curved, tapered tooth geometry that produces these benefits also makes the tooth slot difficult to machine: the cutter blade sweeps through the slot along a path that is neither a simple orthogonal cut nor a constant-depth pass, so the mechanical and thermal loading of the flank changes continuously along the tooth.
Every cutting pass leaves a self-equilibrated stress field in the tooth. Near the machined surface the field is usually tensile, because the top layer has been plastically stretched while the bulk beneath it has only deformed elastically; below that layer the constraint of the unyielded bulk produces compression, and the magnitude decays with depth. A tensile skin is the unfavourable case for fatigue: it assists crack initiation at the flank and root, it can relax or distort after the gear is put into service, and it changes the contact pattern that the designers assumed. Compressive stress below the surface, by contrast, is generally beneficial. The practical question for a process planner is therefore not whether residual stress exists but which combination of speed, feed and depth of cut leaves the smallest tensile peak and the deepest compressive cushion — without giving up an unreasonable amount of productivity.
Reducing a gear-cutting cycle to an equivalent oblique cut
Two families of processes produce spiral bevel teeth. In the generating method a virtual crown wheel rolls in mesh with the workpiece, and the cutter blades reproduce the motion of that virtual wheel. In the formate (forming) method used here, the blade profile directly matches the slot shape: the workpiece is clamped, the cutter head rotates, the table feeds the work into the cutter, the tool withdraws, the workpiece indexes to the next slot, and the cycle repeats until all teeth are cut. A finite-element model of the full cycle is prohibitively expensive, so the process is reduced by a micro-element argument: over the short arc a single blade engages a small element of the slot, the geometry is that of an oblique cut with a fixed tool signature.
The reduction fixes the tool variables that matter for the stress field. The rake angle is 12°, the clearance angle 6°, the tool-nose radius 0.05 mm and the inclination angle — the angle between the blade edge and the cutting-velocity vector — 3°. The uncut thickness is set by the feed per revolution, the width of cut by the equivalent depth of cut, and the sliding speed by the cutting velocity. Treating the blade as rigid and the workpiece as an elastic–plastic continuum, the residual stress left after the tool has passed can be computed for any point in the v–f–a space.
Material behaviour: Johnson–Cook plasticity, failure and friction
The workpiece is AISI 4340, the Chinese designation of which is 40CrNiMoA: a quenched and tempered low-alloy steel of high strength, good toughness and good fatigue resistance, routinely used for gears and shafts under cyclic load. Its physical properties are listed in Table 1; the carbide tool is modelled as a rigid body with no wear.
| Property | Value |
|---|---|
| Density | 7.83 × 10⁻⁹ t·mm⁻³ |
| Elastic modulus | 2 × 10⁵ MPa |
| Poisson’s ratio | 0.29 |
| Yield strength | 792 MPa |
| Ultimate tensile strength | 980 MPa |
Flow behaviour is described by the Johnson–Cook model, which superposes strain hardening, strain-rate sensitivity and thermal softening:
$$\sigma=\left[A+B\left(\varepsilon^{pl}\right)^{n}\right]\left[1+C\ln\frac{\dot{\varepsilon}^{pl}}{\dot{\varepsilon}_{0}}\right]\left[1-\left(\frac{T-T_{0}}{T_{m}-T_{0}}\right)^{m}\right]$$
where σ is the equivalent stress, εpl the equivalent plastic strain, ε̇pl the plastic strain rate, ε̇0 the reference strain rate, T the current temperature, T0 ambient temperature, Tm the melting point, A the yield stress, B the hardening coefficient, and n, C, m the hardening, rate and thermal exponents. The calibrated constants are given in Table 2.
| A (MPa) | B (MPa) | C | n | m |
|---|---|---|---|---|
| 792 | 510 | 0.014 | 0.26 | 1.03 |
Chip formation uses the Johnson–Cook failure criterion. A damage parameter accumulates with plastic straining and the element fails when it exceeds unity:
$$\omega=\sum\frac{\Delta\varepsilon^{pl}}{\varepsilon_{f}^{pl}}$$
with the failure strain itself a function of stress triaxiality, strain rate and temperature:
$$\varepsilon_{f}^{pl}=\left[D_{1}+D_{2}\exp\left(D_{3}\frac{p}{q}\right)\right]\left[1+D_{4}\ln\frac{\dot{\varepsilon}^{pl}}{\dot{\varepsilon}_{0}}\right]\left[1+D_{5}\frac{T-T_{0}}{T_{m}-T_{0}}\right]$$
where p is the hydrostatic pressure, q the von Mises stress, and D1–D5 the failure constants listed in Table 3.
| D₁ | D₂ | D₃ | D₄ | D₅ |
|---|---|---|---|---|
| 0.05 | 3.44 | −2.12 | 0.002 | 0.61 |
Friction on the rake face follows the modified Coulomb law, which splits the contact into a sticking region near the edge and a sliding region further up the chip:
$$\tau_{c}=\begin{cases}\mu\sigma_{n}, & \mu\sigma_{n}<\tau_{s}\ \text{(sliding)}\\[4pt] \tau_{s}, & \mu\sigma_{n}\ge\tau_{s}\ \text{(sticking)}\end{cases}$$
where τc is the shear stress on the contact, σn the normal stress and τs the critical shear strength of the workpiece; the friction coefficient μ is taken as 0.3.
From cutting to a residual stress field: the four-stage simulation
Extracting a physically meaningful residual stress from a cutting simulation requires more than reading the stress tensor at the end of the cut, because the model still carries the boundary conditions of machining. The analysis is therefore run in four stages. First, the cut itself: the workpiece is constrained, the tool is given the cutting velocity, and the chip is allowed to form. Second, unloading: contact and the artificial constraints are removed so that the elastically stored energy can redistribute. Third, constraint conversion: only enough restraint is reintroduced to prevent rigid-body motion, leaving the part free to relax as it would on the machine table. Fourth, cooling to ambient, which removes the thermal part of the field and isolates the mechanical residual stress that survives in the finished tooth.
The reported quantity is the normal stress σ11 along the cutting direction, sampled on a layer-by-layer grid beneath the machined flank. Elements close to the model boundary are discarded to avoid edge artefacts, and 60 points are averaged within each layer so that the profile is representative rather than a single nodal value. The profile is then read as peak tensile stress at the surface (S1) and peak compressive stress below it (S2).
The stress profile: tension at the surface, compression beneath
Single-factor simulations with the cutting velocity stepped from 75 to 235 m/min at a fixed depth of cut of 1.5 mm produce a consistent shape. The machined surface carries tensile stress; the sign reverses within the subsurface layer, the compressive magnitude passes through a maximum, and beyond that maximum the field decays towards zero. The mechanism is the standard one for a machined surface: material directly under the edge is compressed and sheared, the surface layer yields, and after the tool has passed the underlying elastic bulk recovers while the plastically stretched skin cannot, so the skin is held in tension and the layer beneath it in compression. As depth increases the mechanical influence of the pass weakens and the field vanishes.
Cutting velocity changes both peaks, in opposite directions. Raising the velocity from 75 to 235 m/min increases the surface tensile stress and reduces the compressive peak. The interpretation offered for this behaviour is thermal: a higher velocity delivers more heat per unit time into a thin surface layer, the resulting thermal expansion is constrained by the colder bulk, and the tensile component grows; the same heating softens the surface layer, which transmits mechanical load less effectively to the subsurface and therefore weakens the compressive peak. The consequence is a trade-off, since high speed is normally the productivity lever.
A 25-run orthogonal array over speed, feed and depth
To separate the three cutting variables, an orthogonal array was built with five levels for each factor (Table 4), giving 25 simulation runs. The peak tensile and compressive stresses from each run are collected in Table 5, together with the grey relational grade derived in the next section.
| Level | Cutting velocity v (m·min⁻¹) | Feed f (mm·r⁻¹) | Depth of cut a (mm) |
|---|---|---|---|
| 1 | 75 | 0.1 | 1.0 |
| 2 | 115 | 0.2 | 1.5 |
| 3 | 155 | 0.3 | 2.0 |
| 4 | 195 | 0.4 | 2.5 |
| 5 | 235 | 0.5 | 3.0 |
| Run | v (m·min⁻¹) | f (mm·r⁻¹) | a (mm) | S₁ (MPa) | S₂ (MPa) | G |
|---|---|---|---|---|---|---|
| 1 | 75 | 0.1 | 1.0 | 217.682 | −307.883 | 0.7480 |
| 2 | 75 | 0.2 | 1.5 | 245.324 | −329.843 | 0.6748 |
| 3 | 75 | 0.3 | 2.0 | 275.375 | −362.703 | 0.6528 |
| 4 | 75 | 0.4 | 2.5 | 310.235 | −392.524 | 0.6588 |
| 5 | 75 | 0.5 | 3.0 | 347.117 | −428.412 | 0.7331 |
| 6 | 115 | 0.1 | 1.5 | 246.512 | −282.364 | 0.6225 |
| 7 | 115 | 0.2 | 2.0 | 273.432 | −301.251 | 0.5762 |
| 8 | 115 | 0.3 | 2.5 | 304.782 | −341.712 | 0.5713 |
| 9 | 115 | 0.4 | 3.0 | 334.112 | −369.284 | 0.5800 |
| 10 | 115 | 0.5 | 1.0 | 358.236 | −408.132 | 0.6499 |
| 11 | 155 | 0.1 | 2.0 | 263.562 | −235.281 | 0.5459 |
| 12 | 155 | 0.2 | 2.5 | 295.832 | −275.147 | 0.5138 |
| 13 | 155 | 0.3 | 3.0 | 331.212 | −309.164 | 0.4988 |
| 14 | 155 | 0.4 | 1.0 | 354.951 | −338.244 | 0.5099 |
| 15 | 155 | 0.5 | 1.5 | 389.451 | −375.771 | 0.5448 |
| 16 | 195 | 0.1 | 2.5 | 292.942 | −216.249 | 0.4795 |
| 17 | 195 | 0.2 | 3.0 | 319.391 | −238.143 | 0.4552 |
| 18 | 195 | 0.3 | 1.0 | 336.794 | −273.441 | 0.4603 |
| 19 | 195 | 0.4 | 1.5 | 373.422 | −305.742 | 0.4561 |
| 20 | 195 | 0.5 | 2.0 | 412.267 | −334.461 | 0.4627 |
| 21 | 235 | 0.1 | 3.0 | 322.502 | −191.149 | 0.4261 |
| 22 | 235 | 0.2 | 1.0 | 338.192 | −210.848 | 0.4184 |
| 23 | 235 | 0.3 | 1.5 | 371.439 | −242.751 | 0.4068 |
| 24 | 235 | 0.4 | 2.0 | 408.241 | −274.647 | 0.4039 |
| 25 | 235 | 0.5 | 2.5 | 443.751 | −322.149 | 0.4304 |
The span of the table is wide. The tensile peak runs from 217.7 MPa in the mildest condition to 443.8 MPa in the most aggressive one, and the compressive peak from −191.1 MPa to −428.4 MPa, so parameter choice alone moves the surface stress by a factor of two.
Grey relational analysis: scoring two responses at once
Two responses act in opposite senses — a small tensile peak is desirable, a large compressive peak is desirable — and the classical way to handle that in a small orthogonal array is grey relational analysis, which converts both into a single grade. Because the two responses carry different units and different preferred directions, they are first normalised to [0, 1]. The tensile peak is treated as cost-type (smaller is better), the compressive peak as benefit-type (larger magnitude is better):
$$y_{i}(k)=\frac{\max x_{i}^{0}(k)-x_{i}^{0}(k)}{\max x_{i}^{0}(k)-\min x_{i}^{0}(k)}$$
$$y_{i}'(k)=\frac{x_{i}^{0}(k)-\min x_{i}^{0}(k)}{\max x_{i}^{0}(k)-\min x_{i}^{0}(k)}$$
where xi0(k) is the reference sequence, yi(k) and yi′(k) the normalised comparison sequences, i the run index and k the response index (k = 2 here). The grey relational coefficient measures how close each normalised value sits to the reference:
$$\gamma=\frac{\Delta_{\min}+\xi\,\Delta_{\max}}{\Delta_{0i}(k)+\xi\,\Delta_{\max}}$$
with Δ0i(k) the deviation sequence between reference and comparison, Δmin and Δmax the smallest and largest deviations over the whole array, and ξ a resolution coefficient set to 0.5. Averaging the coefficients over the responses gives the grey relational grade:
$$G=\frac{1}{m}\sum_{k=1}^{n}\gamma$$
where m is the number of responses. The grade for each of the 25 runs appears in the last column of Table 5. Its maximum, G = 0.7480, belongs to run 1 — 75 m/min, 0.1 mm/r and 1.0 mm — which therefore becomes the recommended combination within the tested window.
Which parameter dominates?
Averaging the grade at each level of each factor gives the sensitivity picture in Table 6. The range column is the difference between the best and worst level mean and is the standard measure of influence.
| Parameter | Level 1 | Level 2 | Level 3 | Level 4 | Level 5 | Range |
|---|---|---|---|---|---|---|
| Cutting velocity v | 0.6935 | 0.6001 | 0.5226 | 0.4628 | 0.4171 | 0.2764 |
| Feed f | 0.5644 | 0.5277 | 0.5180 | 0.5217 | 0.5642 | 0.0464 |
| Depth of cut a | 0.5573 | 0.5410 | 0.5283 | 0.5308 | 0.5387 | 0.0290 |
Cutting velocity dominates, with a range roughly six times that of feed and almost ten times that of depth of cut, and its effect is monotonic: the grade falls steadily from 0.6935 at 75 m/min to 0.4171 at 235 m/min. Feed behaves non-monotonically, dipping to a minimum at 0.3 mm/r and recovering at both ends; depth of cut shows the same shallow U-shape with a much smaller amplitude.
The non-monotonic feed response deserves comment, because it means the recommended 0.1 mm/r is not a runaway winner on the grade alone. Level 1 and level 5 of feed are effectively tied (0.5644 against 0.5642). What separates them is the composition of the two responses: the level-mean tensile peak rises from about 269 MPa at f = 0.1 mm/r to about 390 MPa at f = 0.5 mm/r, while the compressive magnitude rises from about 247 MPa to about 374 MPa. The heavy feed buys a stronger compressive cushion at the price of a much more tensile surface, and the choice of the low-feed end reflects the priority given to fatigue-critical surface tension.
It is also worth being explicit that the ranking of factors depends on the metric used. Judged on the individual stress components, the steepest main effect belongs to feed rather than to velocity: across the five levels, the level means of the tensile peak span about 122 MPa for feed against about 98 MPa for velocity and only about 10 MPa for depth, and the compressive magnitude spans about 127 MPa for feed against about 116 MPa for velocity. The joint grey grade nevertheless ranks velocity first, because the two components respond to velocity in opposite directions and the grade weighs them together. Both readings agree on the least important factor: depth of cut is a weak lever on residual stress in this window, a consequence of the cut being shallow relative to the depth over which the field decays.
A second-order model of the grey grade
Fitting a second-order response surface to the 25 runs gives a compact model of the grade in the three process variables. Only five terms survive:
$$Y=\beta_{0}+\beta_{1}a+\beta_{2}f+\beta_{3}v+\beta_{22}f^{2}+\beta_{12}fa$$
that is, the three linear effects plus a quadratic feed term and a feed–depth interaction; velocity enters only linearly, and no second-order velocity or depth term was retained. With a in mm, f in mm·r⁻¹ and v in m·min⁻¹, the fitted surface reproduces the measured grade closely across the array, and its residuals scatter randomly about zero without visible structure against the fitted value.
| Source | Degrees of freedom | Sum of squares | Mean square | F | P |
|---|---|---|---|---|---|
| Regression | 5 | 0.251400 | 0.050280 | 146.45 | < 0.0001 |
| Error | 19 | 0.006523 | 0.000343 | ||
| Total | 24 | 0.257923 |
The fit statistics are R² = 97.47% and adjusted R² = 96.81%, the near-equality of the two indicating that the model has not been inflated with terms that buy little. The residual mean square corresponds to a standard error of about 0.019 in grade units. An F ratio of 146.45 with P < 0.0001 means the surface is significant well beyond chance, so the grade can be predicted, and therefore screened, without running the finite-element model for every candidate combination.
Verification by cutting tests
Two levels of verification were used. First, three control simulations were run around the optimum — one at higher velocity (115 m/min), one at higher feed (0.2 mm/r), and one at greater depth (2.5 mm) — keeping the other two factors at their optimum values. All three raised the tensile peak above the optimum value of 217.7 MPa; the first and third also reduced the compressive magnitude below −307.9 MPa, while the second increased it to −333.5 MPa but only at a tensile peak of 242.8 MPa. The optimum therefore sits on the favourable corner of both responses (Table 7).
| Case | v (m·min⁻¹) | f (mm·r⁻¹) | a (mm) | S₁ (MPa) | S₂ (MPa) |
|---|---|---|---|---|---|
| Optimum | 75 | 0.1 | 1.0 | 217.682 | −307.883 |
| Control 1 | 115 | 0.1 | 1.0 | 243.542 | −284.614 |
| Control 2 | 75 | 0.2 | 1.0 | 242.827 | −333.543 |
| Control 3 | 75 | 0.1 | 2.5 | 226.682 | −306.383 |
Second, the optimum was applied on a machine tool and the flanks were measured. Residual stress was read with an Xstress 300G2 X-ray diffractometer; to obtain the distribution with depth, material was removed in steps with an FH2016DM electrolytic polisher, which avoids introducing fresh stress into the measured surface. Each finished gear was sectioned into single teeth on a DK7745 wire-cut machine, and four teeth were measured at the same position on the pitch line of the concave flank. The comparison with the simulated values is given in Table 8.
| Tooth | S₁ predicted (MPa) | S₁ measured (MPa) | Error (%) | S₂ predicted (MPa) | S₂ measured (MPa) | Error (%) |
|---|---|---|---|---|---|---|
| 1 | 217.682 | 207.528 | 4.89 | −307.883 | −294.642 | 4.48 |
| 2 | 217.682 | 205.614 | 5.87 | −307.883 | −291.432 | 5.64 |
| 3 | 217.682 | 208.847 | 4.23 | −307.883 | −287.824 | 6.97 |
| 4 | 217.682 | 202.761 | 7.36 | −307.883 | −293.973 | 4.73 |
The largest discrepancy is 7.36% and every case is below 10%. The sign of the error is systematic: the simulation overestimates the magnitude of both peaks, by roughly 4–7% on the tensile side and 4–7% on the compressive side. Part of that offset is expected from the idealisations — a rigid tool with no flank wear, a single friction coefficient, and a perfectly sharp cutting edge — all of which tend to make the simulated deformation more severe than the real pass. For process-selection purposes the ranking and the location of the optimum, rather than the absolute stress, are what matter, and those are reproduced.
Process implications and limits of the result
Within the tested window — 75–235 m/min, 0.1–0.5 mm/r, 1.0–3.0 mm on AISI 4340 with a carbide formate cutter — the recommended combination is 75 m/min, 0.1 mm/r and 1.0 mm depth of cut. It gives the lowest surface tensile stress, 217.7 MPa simulated, and a compressive peak of −307.9 MPa, and it is reproduced experimentally to within 7.4%.
That recommendation is a quality optimum, not a productivity optimum, and the trade-off should be stated plainly. Cutting at 75 m/min with 0.1 mm/r removes material far more slowly than the upper end of the array, and the grey grade falls monotonically as velocity rises, so there is no intermediate speed at which the joint objective recovers. If the tooth is subsequently ground, shot-peened or otherwise treated, the case for the slowest, lightest cut weakens considerably and a higher-speed condition may be preferable on cost grounds. Depth of cut, by contrast, is nearly free: its range of influence on the grade is the smallest of the three, so a planner has room to raise depth for productivity while holding speed and feed at their favourable levels.
The scope of the conclusions should also be respected. The model assumes a rigid, sharp tool, so tool wear — which normally raises both the tensile peak and the cutting temperature — is outside it. A single friction coefficient of 0.3 is used for the whole rake face, and no cooling condition is varied. The experimental verification covers four teeth and one location on the concave flank, so it confirms the level of the stresses and the validity of the optimum rather than the full three-dimensional field around a tooth. The ranking of factors is metric-dependent, as noted above: velocity dominates the joint grade while feed dominates the individual tensile peak. Finally, the response surface is valid only inside the tested intervals; extrapolating to speeds or feeds outside them, or to a different gear steel or cutter geometry, would require a new simulation set.
The broader methodological point is that a small orthogonal array, a physically resolved cutting model and a grey relational grade together form a workable screening loop for a process whose full-cycle simulation is impractical. The grey grade compresses two competing stress criteria into one number, the response surface turns that number into an algebraic expression, and a handful of cutting tests is then enough to confirm that the loop has landed in the right region of parameter space.