
In my development work on gear forging for transmission components, I have repeatedly seen that the most difficult problems are not created by the basic forming operation itself, but by the interaction between part geometry, billet volume distribution, thermal history, die loading, and the ability of the chosen equipment to transfer energy into the workpiece within a very short time. The gear forging project discussed here concerned a rotary-symmetric transmission gear with a thin rim, a long and relatively slender shaft section, and a small central bore. The part had an outer diameter of approximately 234.5 mm, an overall thickness of 117.25 mm, a rim height of only 27 mm, a shaft diameter of 65 mm, and a minimum bore diameter of 33.5 mm. Those proportions immediately indicated that a conventional full-section upsetting and forging sequence would be difficult to control. The combination of a large outer diameter, a thin rim, and a long shaft creates a strong tendency toward buckling, folding, incomplete filling, and excessive die stress during gear forging. My objective was therefore to design a robust forging process that could be transferred to production with acceptable die life, stable filling, and predictable post-forging quality.
The material selected for the gear forging trials was 8620RH steel, a carburizing-grade alloy steel commonly used in highly loaded transmission gears. The steel combines good hardenability, favorable core toughness after heat treatment, and adequate hot ductility for closed-die forging. However, the hot flow behavior of 8620RH steel still requires careful control because the material exhibits significant strain-rate sensitivity, temperature-dependent flow stress, and rapid heat loss to the dies during repeated hammer blows. When a thin rim is forged together with a long shaft, the temperature gradient between the rim and the shaft can become large enough to produce non-uniform flow, local underfilling, and asymmetric flash formation. Those effects are especially important in gear forging because the rim region must later carry high contact stresses and bending loads, while the shaft region must maintain concentricity and dimensional stability.
I approached the problem by combining practical forging experience with Deform-3D finite element simulation. The simulation was not used merely to produce colorful contour plots. It was used to answer specific process questions: where the metal flows first, how the load is distributed between the upper and lower dies, where strain concentrates, how the die wear pattern develops, and whether the proposed billet and tooling design can produce a sound gear forging without internal or external defects. The resulting process was then validated through trial production. The trial results confirmed that the combination of overall heating and local forming was effective, but they also revealed two practical problems: non-uniform flash and difficult ejection. Both problems were analyzed and corrected through tooling and lubrication changes. The final gear forging process produced acceptable flow lines, a uniform normalized microstructure, and dimensions that met the required tolerances.
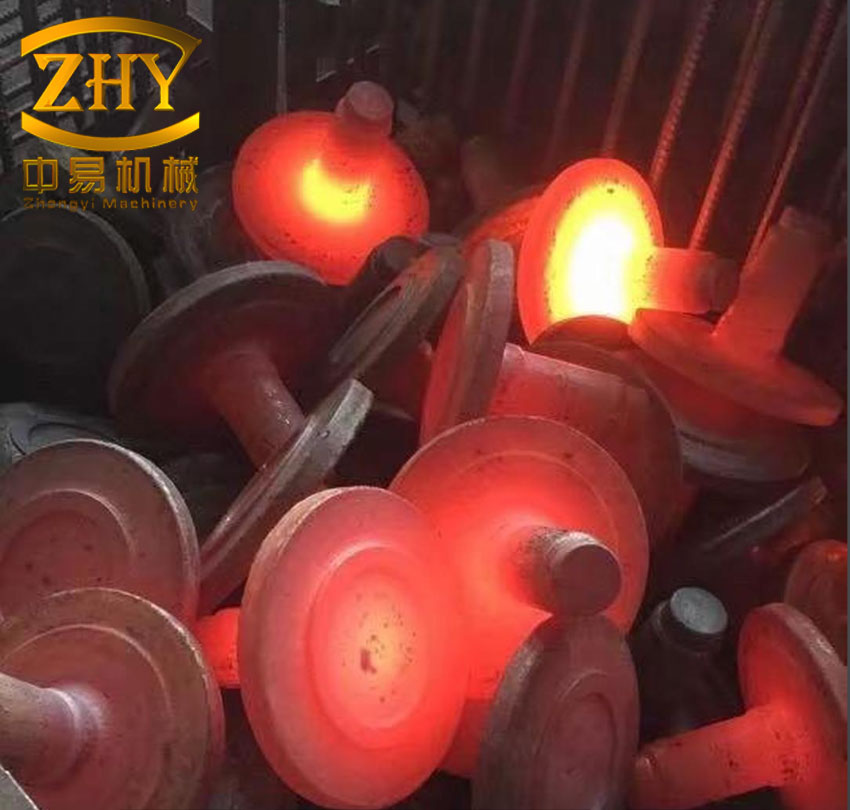
Part Geometry and Its Influence on Gear Forging
The gear forging under consideration was a回转体-type part, but its proportions were far from those of a simple disk. The outer rim was large in diameter but short in axial height, while the shaft was long and slender. The central bore was small, and a full through-hole would have increased the risk of eccentricity, mandrel deflection, and die cracking. For that reason, I decided not to punch the final bore during forging. Instead, the forging operation would produce a blind recess that could serve as a locating feature for subsequent machining. This decision simplified the forging die, reduced the risk of hole offset, and avoided the high lateral loads that a small-diameter punch would impose on the tooling.
The geometric parameters are summarized in Table 1. These values were used as the basis for volume calculation, die layout, and simulation model construction.
| Feature | Value | Process Implication for Gear Forging |
|---|---|---|
| Outer diameter | 234.5 mm | Requires large die cavity and sufficient radial flow control |
| Overall thickness | 117.25 mm | Creates axial temperature gradient during forging |
| Rim height | 27 mm | Thin rim is prone to rapid cooling and incomplete filling |
| Shaft diameter | 65 mm | Long slender section tends to buckle under axial compression |
| Minimum bore diameter | 33.5 mm | Small punch would create high stress and offset risk |
| Machining allowance | 2 mm per side | Balances material savings and machining cleanup |
| Forging type | Closed-die forging | Improves dimensional accuracy and material utilization |
The high diameter-to-height ratio of the shaft section is one of the main reasons why full-length forming is undesirable in gear forging. A simple upsetting operation on a long billet can be evaluated using the height-to-diameter ratio:
$$ \frac{H}{D} = \frac{288}{85} \approx 3.39 $$
When the height-to-diameter ratio exceeds approximately 3, the billet becomes highly susceptible to longitudinal bending and buckling. In the present gear forging, the shaft portion is long, and if it were allowed to participate in the forging deformation, the compressive load would tend to bend the shaft rather than fill the rim. That bending would produce folding, misalignment, and potential cracking. Therefore, the process strategy was changed from full-section forming to local forming of the head region while the shaft remained essentially undeformed.
Process Route and Forming Concept
The proposed gear forging route was: bar cutting, induction heating, local forging, heat treatment, and shot blasting. The billet was heated overall to ensure sufficient plasticity and reduce flow stress, but the deformation itself was localized to the head. The shaft remained outside the active deformation zone and served as a natural guide and positioning section. This hybrid approach is what I refer to as overall heating with local forming. It allowed the large outer rim to be filled by radial and axial flow while avoiding the buckling risk that would arise if the entire shaft were compressed.
I compared three possible concepts for the gear forging: full-section forming, local head forming with a through-bore, and local head forming with a blind recess. The comparison is given in Table 2.
| Concept | Advantages | Disadvantages | Decision |
|---|---|---|---|
| Full-section forming | Single forming sequence; simple billet handling | High buckling risk; difficult shaft extrusion; large press load; poor rim filling | Rejected |
| Local head forming with through-bore | Better material utilization; bore near final shape | Small punch causes high stress, offset, and die cracking | Rejected |
| Local head forming with blind recess | Lower punch load; reduced offset risk; simple die structure; good machining location | Requires later machining of bore | Selected |
The selected route used a billet of 85 mm diameter and 288 mm length. The volume was calculated from the forging drawing with an allowance of 2 mm per side. The basic volume balance for gear forging can be written as:
$$ V_b = V_f + V_{flash} + V_{scale} + V_{loss} $$
where $$V_b$$ is the billet volume, $$V_f$$ is the forged part volume, $$V_{flash}$$ is the flash volume, $$V_{scale}$$ is the scaling loss, and $$V_{loss}$$ is miscellaneous loss. For the preliminary design, I used the ideal volume constancy relation:
$$ A_0 L_0 = A_f L_f $$
where $$A_0$$ and $$L_0$$ are the initial cross-sectional area and length, and $$A_f$$ and $$L_f$$ are the final values. In practice, the flash volume must be controlled carefully because excessive flash increases the required forging load and accelerates die wear, while insufficient flash prevents complete cavity filling. For this gear forging, the flash was designed as a thin, controlled rim that would indicate complete filling without creating an excessively large load.
The forging operation was performed on a 3 t die forging hammer. The nominal energy was 80 kJ, and the effective hammer energy was set to 80% of the total energy. The effective energy can be expressed as:
$$ E_{eff} = \eta E_{total} $$
where $$\eta$$ is the energy transfer efficiency. For this gear forging, the hammer delivered repeated blows. Multiple blows were necessary because a single blow could not fill the thin rim and the large outer diameter without excessive local strain and die pressure. The repeated-blow sequence also allowed partial recovery of temperature between blows, but it introduced the risk of progressive cooling of the thin rim. The simulation therefore had to account for heat transfer between the workpiece and the dies.
Thermal and Material Conditions
The initial billet temperature was set to 1230 °C in the Deform-3D model, while the die temperature was set to 200 °C. The friction coefficient between the workpiece and the dies was set to 0.3. Those values are representative of hot closed-die gear forging with graphite-based lubrication. The flow stress of 8620RH steel during gear forging depends on temperature, strain, and strain rate. A general constitutive relation can be written as:
$$ \sigma = f(\varepsilon, \dot{\varepsilon}, T) $$
The logarithmic strain is defined as:
$$ \varepsilon = \ln\left(\frac{L_f}{L_0}\right) $$
and the strain rate is:
$$ \dot{\varepsilon} = \frac{d\varepsilon}{dt} $$
The heat transfer during gear forging follows the transient conduction equation:
$$ \rho c_p \frac{\partial T}{\partial t} = \nabla \cdot (k \nabla T) + \dot{q} $$
where $$\rho$$ is density, $$c_p$$ is specific heat, $$k$$ is thermal conductivity, $$T$$ is temperature, and $$\dot{q}$$ is the internal heat generation due to plastic deformation. In the simulation, the heat generation from deformation and the heat loss to the dies were both considered. This is important because the thin rim of the gear forging loses heat rapidly at the die interface, which increases local flow stress and can cause incomplete filling.
The material properties used in the simulation are summarized in Table 3. The exact values were taken from the material database available in the simulation environment, but the table shows the general range used for the hot forging analysis.
| Parameter | Typical Value for 8620RH Gear Forging | Role in Simulation |
|---|---|---|
| Carbon content | 0.18–0.23% | Controls hardenability and flow stress |
| Manganese | 0.70–0.90% | Improves hardenability |
| Chromium | 0.40–0.60% | Carburizing response and wear resistance |
| Nickel | 0.40–0.70% | Toughness and core properties |
| Molybdenum | 0.15–0.25% | Hardenability and temper resistance |
| Forging temperature | 1200–1230 °C | Controls flow stress and die filling |
| Die temperature | 200 °C | Controls heat loss from workpiece |
| Friction coefficient | 0.3 | Controls material flow and load |
Finite Element Model Setup
Because the gear forging is a rotary-symmetric part, I used a portion of the full model as the simulation object. This reduced computation time while preserving the essential deformation behavior. The model was built in a drawing environment, imported into Deform-3D, and then meshed. The workpiece was defined as a plastic body with 30,000 elements. The dies were defined as rigid bodies because the elastic deformation of the tooling was small compared with the plastic deformation of the gear forging. The upper die was assigned the hammer motion, and the lower die was fixed. The boundary conditions were set to represent the actual die forging hammer.
The key simulation parameters are listed in Table 4.
| Simulation Parameter | Value | Reason for Selection |
|---|---|---|
| Software | Deform-3D | Capable of coupled thermal and plastic analysis |
| Workpiece material | 8620RH steel | Actual gear forging material |
| Workpiece type | Plastic | Large plastic deformation during forging |
| Die type | Rigid | Die deformation is small relative to workpiece flow |
| Mesh count | 30,000 elements | Balance between accuracy and computation time |
| Initial billet temperature | 1230 °C | Typical hot forging temperature |
| Initial die temperature | 200 °C | Preheated tooling condition |
| Friction coefficient | 0.3 | Representative of hot forging lubrication |
| Equipment | 3 t die forging hammer | Production equipment |
| Nominal energy | 80 kJ | Available hammer energy |
| Effective energy | 80% of total | Accounts for losses in the hammer system |
| Blow sequence | Multiple blows | Needed to fill thin rim without die overload |
The simulation was performed as a coupled thermo-mechanical analysis. The plastic deformation generated heat, and the workpiece lost heat to the dies. The friction condition was modeled using the Coulomb friction law:
$$ \tau = \mu p $$
where $$\tau$$ is the friction shear stress, $$\mu$$ is the friction coefficient, and $$p$$ is the contact pressure. In hot forging, a constant shear friction model is sometimes also used:
$$ \tau = m k $$
where $$m$$ is the friction factor and $$k$$ is the shear yield strength. For this gear forging study, the Coulomb model with a coefficient of 0.3 was sufficient for comparing flow patterns and die wear trends.
Metal Flow Behavior in Gear Forging
The first objective of the simulation was to understand how the metal flows during the repeated hammer blows. In a gear forging with a thin rim and a large outer diameter, the flow sequence determines whether the rim fills completely, whether the shaft remains straight, and whether the flash forms uniformly. The simulation showed that the upper die first contacted the central head region. The head metal then flowed mainly in the axial direction. As the die continued to descend, the metal near the lower die flowed both axially and radially. The radial flow was responsible for filling the outer rim.
The flow velocity did not remain constant. At the beginning of each blow, the velocity increased rapidly as the hammer energy was transferred to the workpiece. Toward the end of the blow, the velocity decreased and eventually approached zero as the cavity filled and the flash formed. This behavior is consistent with actual gear forging. The flow velocity can be expressed as:
$$ v = \frac{dL}{dt} $$
and the local strain rate is:
$$ \dot{\varepsilon} = \frac{v}{L} $$
In the simulation, the highest flow velocities occurred near the central head and the lower die platform. The lowest velocities occurred in the outer rim close to the die wall, where the metal was constrained by friction and cooling. The flow pattern was acceptable because the rim filled progressively from the inner region toward the outer edge. There was no evidence of a large dead zone that would remain unfilled. At the end of the final blow, the workpiece contacted the die surfaces completely, and the flash formed around the perimeter.
The contact condition between the billet and the die is important in gear forging because incomplete contact means incomplete filling. The simulation indicated that the die cavity was fully filled after the final blows. The contact area increased progressively with each blow. The flash appeared as a thin continuous band. This result was later confirmed in trial production, where the forging filled the die cavity and produced a visible flash line around the part.
Equivalent Stress Evolution
The equivalent stress distribution during gear forging provides insight into the load path and the regions that are most likely to experience tool wear or defect formation. The simulation showed that the equivalent stress increased at the beginning of the deformation, reached a maximum during the main filling stage, and then decreased toward the end of the blow. The upper punch boss was the first region to contact the workpiece, and it generated a high local stress concentration. As deformation continued, the stress spread through the head and into the rim. At the end of the forging sequence, the overall equivalent stress dropped toward zero as the plastic flow stopped.
A simplified expression for equivalent stress in the simulation can be written as:
$$ \sigma_{eq} = \sqrt{\frac{1}{2}\left[(\sigma_1-\sigma_2)^2 + (\sigma_2-\sigma_3)^2 + (\sigma_3-\sigma_1)^2\right]} $$
where $$\sigma_1$$, $$\sigma_2$$, and $$\sigma_3$$ are the principal stresses. The maximum equivalent stress was concentrated near the upper die boss and the lower die platform. Those regions also showed the highest strain and the highest die wear. This correlation is important because it means that the die life in gear forging is not controlled only by the overall forging load but also by local stress concentrations at geometric transitions.
Equivalent Strain Evolution
The equivalent strain distribution showed that the high-strain regions were located at the central boss and the lower die platform. From the center toward the outer edge, the strain gradually decreased. As the deformation progressed, the strain became more uniformly distributed through the deformed head, and the maximum value reached 5.17. This is a relatively high strain level, which indicates that the material in the central region experienced severe plastic deformation. Such high strain can be beneficial for grain refinement, but it can also lead to flow localization, internal cracking, or excessive die pressure if not controlled.
The equivalent strain can be expressed as:
$$ \varepsilon_{eq} = \frac{\sqrt{2}}{3}\sqrt{(\varepsilon_1-\varepsilon_2)^2 + (\varepsilon_2-\varepsilon_3)^2 + (\varepsilon_3-\varepsilon_1)^2} $$
The maximum strain of 5.17 was observed in the region near the boss and lower platform. This value was used as an indicator of the severity of the gear forging operation. It helped explain why the lower die showed the greatest wear. The material flow in that region was intense, and the contact pressure was high. The combination of high strain, high pressure, and high temperature created a severe tribological condition on the lower die.
The stress and strain results are summarized in Table 5.
| Result | Observation | Interpretation for Gear Forging |
|---|---|---|
| Initial contact | Upper die boss contacts head first | Creates local stress concentration |
| Metal flow direction | Axial flow in head; axial and radial flow near lower die | Radial flow fills the outer rim |
| Flow velocity | Rapid increase then decrease to near zero | Consistent with hammer forging behavior |
| Cavity filling | Complete filling with flash formation | No unfilled region observed |
| Maximum equivalent strain | 5.17 | Severe plastic deformation near boss and lower platform |
| Stress at final stage | Drops toward zero | Indicates completion of plastic flow |
Die Wear Prediction and Die Life
Die wear is one of the most important economic factors in gear forging. A process that produces a good forging but destroys the die after a few hundred parts is not viable. Therefore, I used the simulation to predict the wear distribution on the upper and lower dies. The wear model used in the analysis was the Archard wear model:
$$ W = \int k \frac{p^a v^b}{H^c} dt $$
where $$W$$ is the wear depth, $$p$$ is the contact pressure, $$v$$ is the material flow velocity, $$H$$ is the die hardness after heat treatment, $$k$$ is the wear coefficient, and $$a$$, $$b$$, and $$c$$ are model parameters. A simplified form often used for comparative studies is:
$$ \frac{dW}{dt} = k \frac{p v}{H} $$
This simplified form shows that wear increases with contact pressure and sliding velocity and decreases with die hardness. In gear forging, the contact pressure is highest at the die corners and at the regions where the metal flow changes direction. The sliding velocity is highest where the material flows along the die surface. Therefore, the die regions that combine high pressure and high sliding velocity are the most vulnerable.
The simulation showed that the upper die experienced severe wear at the boss fillet. The maximum wear depth on the upper die was approximately $$1.15 \times 10^{-5}$$ mm. The lower die experienced even greater wear at the platform region, with a maximum wear depth of approximately $$1.26 \times 10^{-2}$$ mm. This result indicated that the lower die had a higher damage risk. The reason is that the hammer impact load is transferred through the workpiece to the lower die. The lower die platform supports the workpiece during the entire deformation sequence and experiences high contact pressure over a relatively small area. In addition, the material flow near the lower platform is intense, which increases the sliding velocity and accelerates wear.
The die wear results are summarized in Table 6.
| Die Region | Wear Severity | Maximum Wear Depth | Primary Cause |
|---|---|---|---|
| Upper die boss fillet | High | $$1.15 \times 10^{-5}$$ mm | Stress concentration and initial contact |
| Lower die platform | Very high | $$1.26 \times 10^{-2}$$ mm | High pressure, intense flow, and impact load |
The die wear prediction was used to guide tooling improvements. The lower die was identified as the critical component. To reduce wear, the die surface needed better lubrication, a more favorable fillet radius, and sufficient preheating. The simulation also suggested that the lower die should be inspected more frequently than the upper die during production. This is a practical outcome of the finite element analysis: it directs maintenance attention to the region where failure is most likely.
Trial Production and Initial Validation
The first trial production run used a heating temperature of 1200 °C. The billet was heated and then forged with multiple blows at 80% of the available hammer energy. Under those conditions, the gear forging was produced successfully. The die cavity filled, the part dimensions were close to the target, and the forging was acceptable for further evaluation. The trial confirmed that the overall heating and local forming concept was feasible.
One of the most important quality checks after gear forging is the metal flow line pattern. A properly designed forging should have flow lines that follow the shape of the part and remain continuous without turbulence, cross-flow, or vortex formation. The flow lines affect mechanical properties because they create directional anisotropy. In a gear forging, the flow lines should ideally follow the tooth root and rim contours so that the material fiber orientation supports the service loads. In the trial forging, the metal flow lines were continuous and followed the normal stress direction. No乱流, cross-flow, or vortex-like patterns were observed. This was a strong indication that the billet volume distribution and die design were appropriate.
After forging, the parts were normalized. The normalized microstructure consisted of uniformly distributed black pearlite and white ferrite. The grains were fine, and no large coarse grains were found. Normalizing also removed most of the banded structure inherited from forging and relieved internal stresses. The grain size met the required standard. These results showed that the gear forging process produced a sound starting microstructure for subsequent machining and carburizing heat treatment.
The trial results are summarized in Table 7.
| Item | Trial Condition or Result | Assessment |
|---|---|---|
| Heating temperature | 1200 °C | Within hot forging range |
| Hammer energy | 80% of nominal | Sufficient for filling |
| Forming sequence | Multiple upsetting blows | Produced acceptable forging |
| Metal flow lines | Continuous and aligned | No乱流, cross-flow, or vortex |
| Normalized microstructure | Fine pearlite and ferrite | Uniform and within grain size requirement |
| Internal stress | Reduced by normalizing | Favorable for machining |
Problems Identified During Trial Production
Although the first trial produced a sound forging, two production problems appeared. The first was non-uniform flash. The flash on one side of the forging was thin and elongated, while the flash on the opposite side was almost absent. The measured thickness was 124.1 mm, which was 0.4 mm above the nominal tolerance. The second problem was difficult ejection. After forging, the part could not be removed smoothly from the lower die. The operator had to use tongs and repeatedly lever the part out of the die. This reduced productivity and increased the risk of damaging the forging or the die.
The non-uniform flash was analyzed as a combined effect of die alignment, die wear, die clearance, heating uniformity, lubrication, and billet placement. The possible causes are listed in Table 8.
| Defect | Possible Cause Category | Specific Cause | Corrective Action |
|---|---|---|---|
| Non-uniform flash | Die | Die misalignment, die wear, improper clearance | Check and reset die alignment; control die wear |
| Non-uniform flash | Equipment | Uneven blow energy or hammer guide clearance | Inspect hammer and adjust energy delivery |
| Non-uniform flash | Process | Non-uniform heating, insufficient lubrication | Improve induction heating uniformity and lubricant coverage |
| Non-uniform flash | Billet | Tilted billet end, improper placement | Face the billet ends and improve positioning |
| Difficult ejection | Tooling | Insufficient draft angle, excessive friction | Increase draft angle to 2°–3° and improve lubrication |
| Difficult ejection | Equipment | Ejection stroke shorter than shaft length | Optimize die layout and ejection system |
For the non-uniform flash, the billet ends were faced flat in the trial. After facing, the problem did not disappear completely, which showed that billet end flatness was not the only cause. The die alignment and lubrication condition were therefore examined more carefully. The flash thickness measurement of 124.1 mm indicated that the axial dimension was slightly over tolerance. This was corrected by adjusting the die closure and controlling the effective energy per blow. The flash itself is not simply waste; it is a process indicator. A uniform flash shows that the cavity is filled uniformly and that the die gap is consistent around the perimeter. In gear forging, flash control is therefore a direct measure of process stability.
The flash thickness can be related to the die gap and the amount of excess material:
$$ t_f = t_0 – \Delta t $$
where $$t_f$$ is the final flash thickness, $$t_0$$ is the initial die gap, and $$\Delta t$$ is the die closure during the final blow. If the die closure is uneven, the flash thickness will vary around the part. This is one reason why die alignment is critical in gear forging.
The ejection problem was analyzed in terms of the available ejection stroke. The 3 t die forging hammer had an effective downward ejection stroke of only 40 mm. However, the undeformed shaft portion of the gear forging extended well below the lower die. The shaft length exceeded the ejection stroke, so the ejector could not push the part out effectively. The part remained stuck in the lower die, and the operator had to lever it out manually. This was a clear case where the process design had to be reconciled with the equipment capability. The ejection stroke is a hard constraint, and it cannot be ignored in gear forging with a long shaft.
The relationship between the required ejection stroke and the shaft length can be written as:
$$ L_{eject} \geq L_{shaft,lower} + \delta $$
where $$L_{eject}$$ is the available ejection stroke, $$L_{shaft,lower}$$ is the length of the shaft inside the lower die, and $$\delta$$ is a safety clearance. In the first trial, this condition was not satisfied. To correct the problem, the lower die draft angle was increased to 2°–3°, and the lubrication spray was increased. The larger draft angle reduced the friction force between the shaft and the die wall. The increased lubrication reduced the adhesion and sliding resistance. These changes made ejection more reliable.
The draft angle can be expressed as:
$$ \alpha = \tan^{-1}\left(\frac{\Delta r}{\Delta z}\right) $$
where $$\Delta r$$ is the radial clearance over the axial length $$\Delta z$$. A draft angle of 2°–3° is often a practical compromise in hot gear forging: it is large enough to reduce ejection force, but small enough to avoid excessive material waste and dimensional deviation. The increased lubrication also helps control die temperature and reduces wear, which aligns with the die wear prediction from the simulation.
Process Optimization and Corrective Measures
Based on the simulation and trial results, I made several improvements to the gear forging process. The billet ends were faced to improve positioning. The induction heating cycle was adjusted to reduce axial and circumferential temperature gradients. The die alignment was checked and corrected. The lower die draft angle was increased to 2°–3°. Lubrication was improved by increasing the spray coverage and ensuring that the lubricant reached the lower die platform and shaft region. The effective hammer energy was controlled to avoid excessive flash while still filling the rim.
The optimized process parameters are shown in Table 9.
| Parameter | Initial Trial | Optimized Condition | Expected Effect |
|---|---|---|---|
| Heating temperature | 1200 °C | 1200–1230 °C with improved uniformity | More uniform flow and filling |
| Billet end condition | As-cut | Faced flat | Better seating and alignment |
| Die alignment | Checked but variable | Reset and controlled | More uniform flash |
| Lower die draft angle | Original value | 2°–3° | Improved ejection |
| Lubrication | Standard spray | Increased coverage and frequency | Lower friction and wear |
| Hammer energy | 80% | 80% with controlled blow sequence | Complete filling with controlled flash |
| Flash control | Non-uniform | Uniform thin flash | Improved dimensional consistency |
The optimized process was evaluated using the same criteria as the first trial: cavity filling, flash uniformity, ejection behavior, flow line continuity, and post-forging microstructure. The improvements addressed both the die-related and process-related causes of the defects. The flash became more uniform around the perimeter, and the axial dimension was brought within tolerance. Ejection became smoother, and the manual levering operation was eliminated. The flow lines remained continuous, and the normalized microstructure remained fine and uniform.
Heat Treatment and Microstructural Control
After gear forging, the parts were normalized. Normalizing is important because the forging operation introduces a banded structure and residual stresses. The banded structure can be harmful for later machining and heat treatment because it creates anisotropic properties. Normalizing dissolves or redistributes some of the segregation and produces a more uniform ferrite-pearlite structure. In the trial, the normalized microstructure showed black pearlite and white ferrite distributed uniformly, with fine grains and no large coarse grains. The grain size met the specified requirement. The normalizing treatment also reduced internal stresses, which improves dimensional stability during machining.
The normalizing process can be described by the cooling curve:
$$ T(t) = T_\infty + (T_0 – T_\infty) e^{-ht} $$
where $$T(t)$$ is the temperature at time $$t$$, $$T_\infty$$ is the ambient or furnace temperature, $$T_0$$ is the initial temperature, and $$h$$ is a cooling coefficient. In practice, the cooling rate must be controlled to avoid excessive hardness or undesirable microstructures. For 8620RH gear forging, normalizing produces a microstructure that is suitable for machining and subsequent carburizing.
The quality checks after normalizing are summarized in Table 10.
| Check Item | Observation | Requirement | Result |
|---|---|---|---|
| Microstructure | Fine pearlite and ferrite | Uniform, no coarse grains | Acceptable |
| Banded structure | Mostly eliminated | Minimal banding | Acceptable |
| Grain size | Fine and uniform | Within specified standard | Acceptable |
| Internal stress | Relieved by normalizing | Low enough for machining | Acceptable |
| Flow lines | Continuous along part contour | No cross-flow or vortex | Acceptable |
Why Local Forming Is Effective for This Gear Forging
The central reason for the success of the overall heating and local forming approach is that it separates the functions of the billet. The shaft does not need to be compressed to fill the rim. It acts as a stable, undeformed guide that maintains alignment and prevents buckling. The head, which contains the rim and the large outer diameter, is the only region that undergoes significant plastic deformation. This reduces the required forging load, improves die filling, and avoids the formation of folds in the shaft.
The load reduction can be understood from the projected contact area. The forging force is approximately:
$$ F = \sigma_f A_p $$
where $$\sigma_f$$ is the flow stress and $$A_p$$ is the projected contact area. If the entire shaft were deformed, the projected area would be larger, and the load would increase. By limiting deformation to the head, the projected area is reduced, and the hammer energy is concentrated where it is needed. This is particularly important for a 3 t hammer with 80 kJ nominal energy. The available energy must be used efficiently to fill the thin rim.
The energy required for plastic deformation can be approximated as:
$$ E_p = \int_V \sigma \, d\varepsilon \, dV $$
In local forming, the integration volume is smaller, so less energy is wasted on deforming the shaft. The remaining energy is available for filling the rim and creating the flash. This is why the local forming concept produced good filling without requiring a larger hammer.
Die Design Considerations for Gear Forging
The die design for this gear forging had to satisfy several requirements. First, the die had to fill the outer rim without creating excessive flash. Second, the die had to support the shaft without causing it to bend. Third, the die had to allow reliable ejection. Fourth, the die had to resist wear at the boss fillet and lower platform. These requirements were addressed through the following design features: a generous fillet at the upper boss, a controlled draft angle on the lower die, a replaceable lower insert if necessary, and a lubrication system that reaches the critical surfaces.
The die wear rate can be reduced by increasing hardness and reducing contact pressure. The contact pressure can be reduced by increasing the contact area, but this must be balanced against the need to concentrate pressure for filling. In gear forging, the die designer must often choose between filling and die life. The simulation helped quantify that trade-off. The upper die boss showed a wear depth of $$1.15 \times 10^{-5}$$ mm, while the lower die platform showed a wear depth of $$1.26 \times 10^{-2}$$ mm. The lower die was therefore the limiting component. The corrective measures focused on the lower die: better lubrication, a larger draft angle, and closer inspection.
The die design parameters are summarized in Table 11.
| Design Feature | Purpose | Result |
|---|---|---|
| Upper boss fillet | Reduce stress concentration and wear | Lower wear risk at boss |
| Lower die draft angle | Improve ejection | 2°–3° selected |
| Blind recess instead of through-bore | Avoid small punch and offset | Simpler die and lower load |
| Closed-die flash land | Control filling and flash | Uniform flash after optimization |
| Lubrication channels | Reduce friction and wear | Improved die life and ejection |
Simulation-Assisted Decision Making
The value of the Deform-3D simulation in this gear forging project was not limited to predicting stress and strain. It provided a framework for decision making. The simulation showed that the metal flow was stable and that the die cavity filled completely. It showed that the maximum strain was 5.17 and that the high-strain region was near the boss and lower platform. It showed that the lower die had a higher wear risk than the upper die. These results were used to prioritize tooling improvements and to set inspection intervals. The simulation also helped explain why the trial forging produced non-uniform flash and difficult ejection. The flash problem was related to die alignment and process variation, while the ejection problem was related to the ejection stroke and draft angle.
The simulation results and their practical actions are summarized in Table 12.
| Simulation Finding | Practical Action | Outcome |
|---|---|---|
| Complete cavity filling | Proceed with trial production | Forging filled successfully |
| Maximum strain 5.17 | Monitor central boss and lower platform | Focused quality inspection |
| High lower die wear | Improve lower die lubrication and draft | Better ejection and die life |
| Upper boss stress concentration | Optimize fillet and die surface | Reduced wear risk |
| Uniform metal flow | Maintain billet volume and heating uniformity | Continuous flow lines |
Production Control and Quality Assurance
For stable gear forging, production control must address billet preparation, heating, die condition, lubrication, hammer energy, and post-forging heat treatment. The billet must be cut to the correct length and the ends must be flat. The induction heating must produce a uniform temperature distribution. The dies must be aligned and preheated. The lubricant must be applied uniformly. The hammer energy must be controlled from blow to blow. After forging, the parts must be inspected for flash uniformity, dimensions, and surface defects. After normalizing, the microstructure and grain size must be checked.
A practical control plan for this gear forging is given in Table 13.
| Control Point | Parameter | Target | Frequency |
|---|---|---|---|
| Billet cutting | Length and end flatness | 85 mm × 288 mm, faced ends | Each lot |
| Heating | Temperature uniformity | 1200–1230 °C | Continuous monitoring |
| Die setup | Alignment and clearance | Centered, uniform gap | Start of run |
| Lubrication | Coverage and amount | Full coverage of lower die and boss | Each cycle |
| Hammer | Energy and blow sequence | 80% energy, controlled blows | Continuous |
| Forging | Flash uniformity and thickness | Within tolerance | Sampling |
| Ejection | Release behavior | Smooth, no manual levering | Each part |
| Normalizing | Microstructure and grain size | Fine pearlite and ferrite | Each lot |
Comparison of Initial and Optimized Gear Forging
The initial trial demonstrated the feasibility of the local forming concept, but it also revealed the practical problems. The optimized process resolved those problems through die alignment, billet facing, draft angle increase, lubrication improvement, and energy control. A comparison of the initial and optimized conditions is shown in Table 14.
| Aspect | Initial Trial | Optimized Process | Improvement |
|---|---|---|---|
| Flash uniformity | Non-uniform; one side thin, one side absent | Uniform thin flash | Better cavity filling control |
| Axial dimension | 124.1 mm, 0.4 mm over tolerance | Within tolerance | Improved die closure |
| Ejection | Stuck; manual levering | Smooth ejection | Increased draft angle and lubrication |
| Die wear risk | Lower die platform vulnerable | Better lubrication and inspection | Reduced wear rate |
| Flow lines | Continuous | Continuous | Maintained |
| Microstructure | Fine pearlite and ferrite | Fine pearlite and ferrite | Maintained |
Key Equations Used in the Gear Forging Analysis
For clarity, the main equations used in the design and analysis are collected below. These equations were used to estimate volume, strain, stress, energy, wear, and thermal behavior during gear forging.
$$ V_b = V_f + V_{flash} + V_{scale} + V_{loss} $$
$$ A_0 L_0 = A_f L_f $$
$$ \frac{H}{D} = \frac{288}{85} \approx 3.39 $$
$$ E = \frac{1}{2} m v^2 $$
$$ E_{eff} = \eta E_{total} $$
$$ \sigma = \frac{F}{A} $$
$$ \varepsilon = \ln\left(\frac{L_f}{L_0}\right) $$
$$ \dot{\varepsilon} = \frac{d\varepsilon}{dt} $$
$$ \sigma_{eq} = \sqrt{\frac{1}{2}\left[(\sigma_1-\sigma_2)^2 + (\sigma_2-\sigma_3)^2 + (\sigma_3-\sigma_1)^2\right]} $$
$$ \varepsilon_{eq} = \frac{\sqrt{2}}{3}\sqrt{(\varepsilon_1-\varepsilon_2)^2 + (\varepsilon_2-\varepsilon_3)^2 + (\varepsilon_3-\varepsilon_1)^2} $$
$$ \tau = \mu p $$
$$ \tau = m k $$
$$ W = \int k \frac{p^a v^b}{H^c} dt $$
$$ \frac{dW}{dt} = k \frac{p v}{H} $$
$$ \rho c_p \frac{\partial T}{\partial t} = \nabla \cdot (k \nabla T) + \dot{q} $$
$$ T(t) = T_\infty + (T_0 – T_\infty) e^{-ht} $$
$$ t_f = t_0 – \Delta t $$
$$ L_{eject} \geq L_{shaft,lower} + \delta $$
$$ \alpha = \tan^{-1}\left(\frac{\Delta r}{\Delta z}\right) $$
$$ F = \sigma_f A_p $$
$$ E_p = \int_V \sigma \, d\varepsilon \, dV $$
Practical Lessons from the Gear Forging Project
The first lesson is that gear forging geometry must be evaluated before the process is selected. A part with a thin rim and a long shaft cannot be treated as a simple disk. The tendency toward buckling is real, and it must be addressed by process design rather than by increasing the forging load. The second lesson is that the billet volume distribution is as important as the total volume. The head must have enough material to fill the rim, while the shaft must remain stable. The third lesson is that finite element simulation is most useful when it is tied to specific process decisions. In this project, the simulation predicted complete filling, high strain near the boss, and severe wear on the lower die. Those predictions were used to guide trial production and tooling improvement.
The fourth lesson is that die life in gear forging is often limited by local conditions rather than by the average load. The lower die platform had the highest wear because it experienced high pressure and intense material flow. Increasing lubrication and draft angle helped reduce the risk. The fifth lesson is that ejection must be considered during die design. A long shaft can exceed the available ejection stroke, and no amount of process optimization will overcome that constraint unless the die layout or equipment is changed. The sixth lesson is that normalizing is an essential part of the gear forging chain. It removes banded structure, reduces internal stress, and produces a uniform microstructure for subsequent machining and carburizing.
Economic and Production Benefits
The optimized gear forging process produced several benefits. Material utilization improved because the forging was designed with a controlled allowance and a blind recess instead of a through-bore. Die life improved because the lower die wear risk was recognized and addressed. Productivity improved because ejection became reliable and manual levering was eliminated. Quality improved because the flash became uniform and the axial dimension was brought within tolerance. The process also reduced the risk of folding and cracking in the shaft because the shaft did not participate in the plastic deformation.
The economic benefits are summarized in Table 15.
| Benefit Area | Mechanism | Result |
|---|---|---|
| Material utilization | Blind recess and controlled allowance | Less waste and lower machining stock |
| Die life | Better lubrication and draft angle | Lower wear and fewer die repairs |
| Productivity | Reliable ejection | Shorter cycle time and less manual handling |
| Quality | Uniform flash and controlled dimensions | Higher dimensional consistency |
| Process stability | Local forming and controlled energy | Reduced buckling and folding risk |
| Heat treatment | Normalizing after forging | Uniform microstructure and lower stress |
Conclusion
I designed and optimized a gear forging process for a thin-rim, long-shaft transmission gear using 8620RH steel. The process used overall heating and local forming, with a billet of 85 mm diameter and 288 mm length. The shaft remained essentially undeformed, while the head was forged to fill the outer rim and form a blind recess. Deform-3D simulation showed that the metal flow was stable, the cavity filled completely, the maximum equivalent strain reached 5.17, and the lower die had a higher wear risk than the upper die. The Archard wear model predicted a maximum wear depth of $$1.15 \times 10^{-5}$$ mm on the upper die boss and $$1.26 \times 10^{-2}$$ mm on the lower die platform.
Trial production confirmed that the gear forging process was feasible. The flow lines were continuous and aligned with the normal stress direction, and the normalized microstructure consisted of fine pearlite and ferrite with no coarse grains. The first trial also revealed non-uniform flash and difficult ejection. The flash problem was addressed by improving die alignment, billet end flatness, heating uniformity, and energy control. The ejection problem was addressed by increasing the lower die draft angle to 2°–3° and improving lubrication. After these corrections, the gear forging process produced uniform flash, acceptable dimensions, reliable ejection, and consistent microstructure.
The combination of finite element simulation and practical trial production was essential. The simulation provided insight into metal flow, stress, strain, and die wear, while the trial production exposed equipment and tooling constraints that could not be ignored. The optimized gear forging process is therefore suitable for production and provides a reliable reference for similar complex rotary-symmetric gear forgings with thin rims and long shafts.