
The development of high-performance robotic systems is critically dependent on the availability of precise, reliable, and efficient core components. Among these, the rotary vector reducer stands out as a pivotal element in robotic joints, prized for its exceptional combination of high torque capacity, compact size, superior torsional stiffness, and excellent positioning accuracy. Despite its importance, a significant performance gap often exists between domestically produced rotary vector reducers and their imported counterparts. Closing this gap requires not only advanced design and manufacturing but also robust, comprehensive testing methodologies to validate performance, diagnose weaknesses, and guide optimization efforts. This article details the design philosophy, implementation, and operational results of a versatile, high-precision test platform I developed specifically for the exhaustive dynamic performance evaluation of rotary vector reducers. The platform is engineered to measure a wide array of critical parameters under various simulated working conditions.
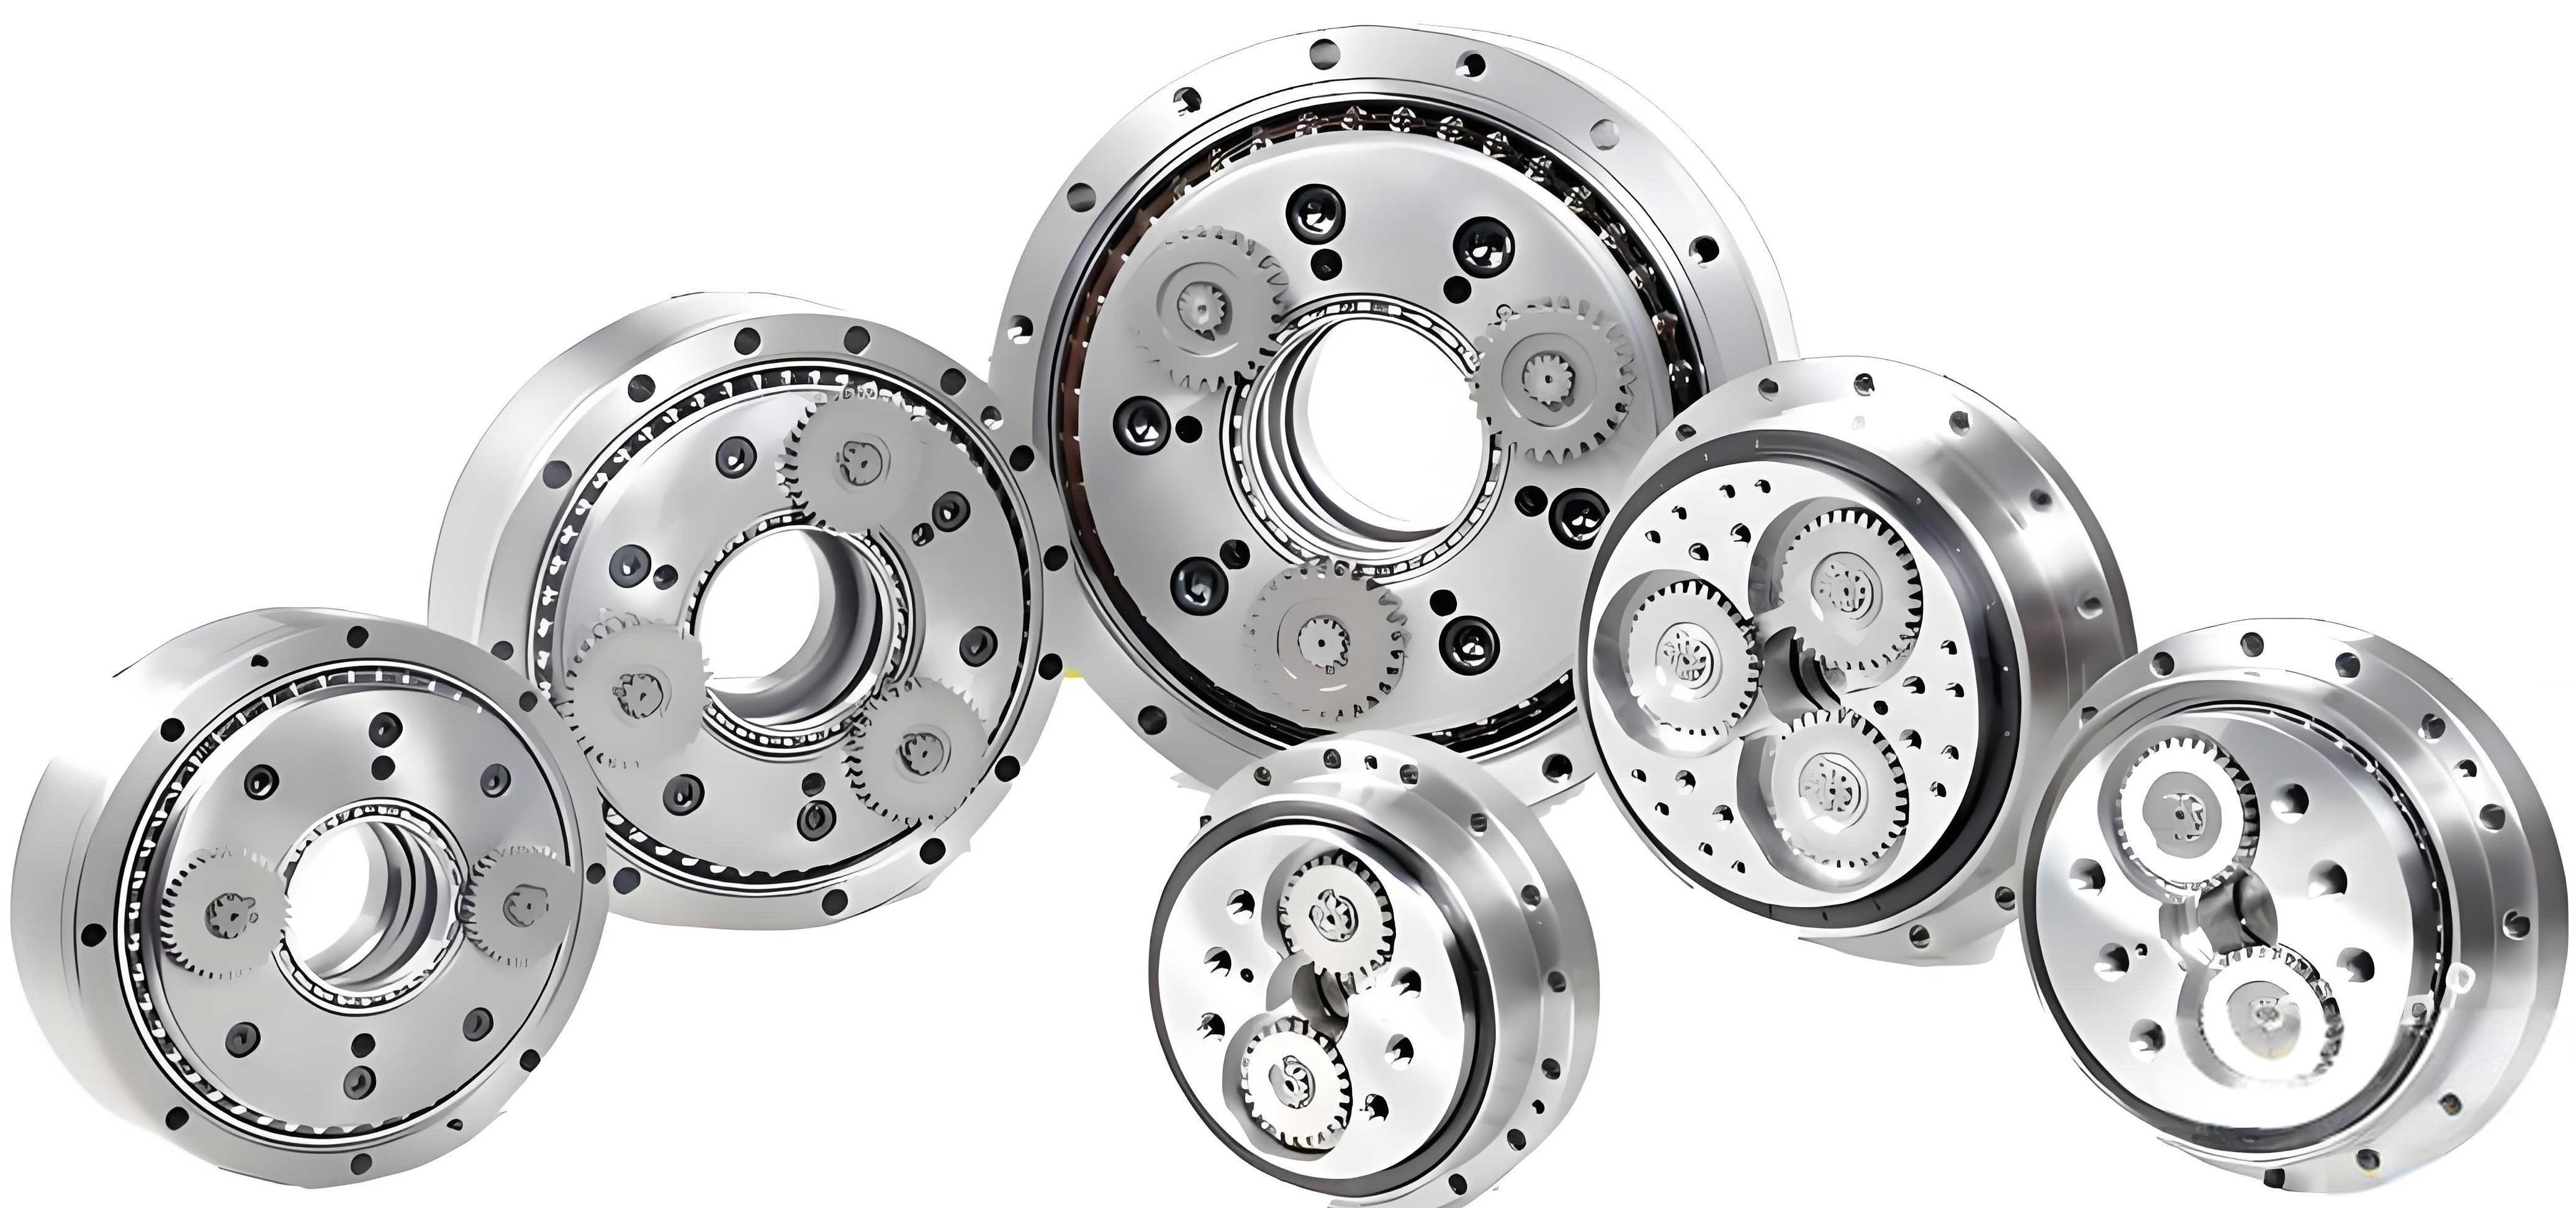
The core objective of this test bed is to provide a modular, flexible, and accurate system capable of dynamically monitoring and recording the operational state of rotary vector reducers. By analyzing data trends, we can uncover operational patterns, assess the impact of design parameters on dynamic performance, monitor failure conditions, and ultimately identify the key factors contributing to performance differentials. The platform is designed to accommodate multiple series of rotary vector reducers, specifically targeting models analogous to RV-20E, RV-40E, and RV-80E.
Fundamental Measurement Principles for Rotary Vector Reducers
Accurate performance characterization of a rotary vector reducer hinges on the precise measurement of several key metrics. The test platform is built upon well-established physical principles for these measurements.
Transmission Error
Transmission error (TE) quantifies the deviation between the actual output shaft position and its theoretical position for a given input angle. It is a direct measure of kinematic precision and is calculated as:
$$ \Delta\theta = \theta_2 – \frac{\theta_1}{i} $$
where \( \theta_1 \) is the actual input angle, \( \theta_2 \) is the actual output angle, and \( i \) is the theoretical reduction ratio of the rotary vector reducer.
Backlash and Torsional Compliance (Lost Motion)
Backlash is the non-cumulative clearance between mating components, observable when the direction of rotation is reversed under near-zero load. A related but distinct metric is torsional compliance or lost motion, which includes the effects of elastic deformation under load. A common method involves measuring the output angle hysteresis while applying a slowly oscillating input torque. The angular displacement when the applied torque crosses zero provides a measure of the system’s mechanical play.
Torsional Stiffness
Torsional stiffness is a critical indicator of a reducer’s resistance to elastic deformation under load, directly impacting positional accuracy under varying torque. It is defined as the ratio of the applied output torque to the resulting angular deflection at the output shaft while the input shaft is held fixed:
$$ K = \frac{T}{\phi} $$
where \( K \) is the torsional stiffness (N·m/arcmin or N·m/rad), \( T \) is the applied output torque, and \( \phi \) is the measured angular deflection at the output. The relationship is often non-linear, particularly at low torque levels, resulting in a characteristic hysteresis loop when torque is cycled.
Test Platform Design Philosophy and Architecture
The design was guided by several key requirements: high measurement accuracy, operational flexibility for different reducer sizes, ease of installation and alignment, real-time data monitoring, and the ability to conduct a comprehensive suite of tests including efficiency, error, stiffness, backlash, starting torque, life, temperature rise, vibration, and noise.
Moving away from traditional designs using a drive motor and a passive load (e.g., a magnetic powder brake), this platform adopts a dual-servo drive configuration. One servo motor acts as the prime mover, while a second identical servo motor, paired with a matching speed increaser gearbox, acts as a programmable, active load. This configuration offers superior control, smoother operation across a wider speed/torque range, and significantly lower inherent vibration and noise compared to passive brake systems, leading to cleaner measurement data. The overall schematic is a single-line, modular layout.
The major system modules are:
- Drive System: Comprising the input servo motor, a high-resolution input shaft encoder, and a precision torque sensor.
- Unit Under Test (UUT): The rotary vector reducer mounted on a customizable fixture.
- Load System: Comprising an output precision torque sensor, the active load servo motor, and its associated speed increaser.
- Data Acquisition & Control System: A industrial PC (IPC), servo drivers, and a centralized control cabinet housing all electronic systems.
- Mechanical Base: A massive cast iron surface plate with integrated linear guide rails for precise and repeatable module alignment.
Detailed Component Selection and Integration
Careful selection of each component was critical to meeting the performance specifications.
Mechanical Couplings
To ensure accurate torque transmission and minimize the introduction of external errors, different coupling types were used at various stages:
- Drive Side: Zero-backlash flexible couplings with keyways were used between the input motor, input torque sensor, and the rotary vector reducer input shaft. These couplings accommodate minor misalignments while maintaining torsional rigidity.
- Load Side: A custom-designed shrink disc coupling was used to connect the output flange of the rotary vector reducer to the output torque sensor, capable of handling the high torque levels (up to 1000 N·m). A rigid coupling was used between the output torque sensor and the load system.
Servo Motor Sizing
The servo motors needed to cover the operational envelope of all targeted rotary vector reducer models. Calculations were based on the maximum speed and torque requirements.
| Reducer Model | Max Output Torque (N·m) | Reduction Ratio (i) | Required Motor Torque (N·m) @ 1.2x Safety | Required Motor Speed (rpm) for 15 rpm output |
|---|---|---|---|---|
| RV-20E / 40E / 80E (Full Range) | Up to 1088 | Up to ~193 | ≥ 20.0 | ~2898 |
| RV-40E (Specific) | Up to 572 | ~183 | ≥ 11.0 | ~2754 |
Based on these calculations, a 3 kW servo motor with a rated torque of 14.3 N·m and a maximum speed of 3000 rpm was selected, providing sufficient headroom. The control scheme employs direct digital control from the IPC for precise speed and torque command.
Sensor Selection
| Sensor | Location | Key Specification | Rationale |
|---|---|---|---|
| Torque Sensor 1 | Input Shaft | Range: 0-±20 N·m, High Accuracy | Measures drive torque for efficiency and input power calculation. |
| Torque Sensor 2 | Output Shaft | Range: 0-±1000 N·m, High Accuracy | Measures load torque for efficiency, stiffness, and load control feedback. |
| Rotary Encoder 1 | Input Shaft | Resolution: ±10 arcseconds | Measures input angle for transmission error and speed. |
| Rotary Encoder 2 | Output Shaft | Resolution: ±10 arcseconds | Measures output angle for transmission error, backlash, and stiffness. |
Mechanical Platform and Fixturing
A critical design feature is the modular mounting system on a heavy-duty cast iron surface plate (2.5m x 1.0m x 0.3m). This base provides exceptional vibration damping and stability. All major modules (drive, UUT, load) are mounted on individual plates that slide and lock onto precision linear guide rails embedded in the base plate. This allows for quick, repeatable, and highly accurate alignment for different sizes of rotary vector reducers, drastically reducing setup time and alignment errors.
Platform Capabilities and Operational Workflow
The final integrated test platform meets the designed specifications, as summarized below:
| Performance Parameter | Specification |
|---|---|
| Input Power Capacity | 3 kW |
| Input Torque Measurement Range | 0 – ±20 N·m |
| Input Speed Range | 0 – 3000 rpm |
| Output Torque Measurement Range | 0 – ±1000 N·m |
| Output Speed Control Range | 0 – 100 rpm |
| Angular Measurement Precision | ±10 arcseconds |
| Applicable Reducer Series | RV-20E, RV-40E, RV-80E analogues |
The custom software suite enables real-time data display, automated test sequences, data logging, and post-processing. Tests can be performed for:
- Efficiency mapping under varying load and speed.
- Transmission error over single and multiple revolutions.
- Torsional stiffness and hysteresis measurement.
- Backlash and starting torque assessment.
- Durability and life testing.
- Temperature rise, vibration, and noise monitoring.
Experimental Results from the Test Platform
The platform successfully generates high-fidelity data for critical performance indicators of the rotary vector reducer. Below are examples of typical test outcomes.
1. Starting Torque Test
In this test, the load servo slowly increases torque on the output shaft of the stationary rotary vector reducer. The output shaft angle and applied torque are recorded simultaneously. The moment the angle sensor detects motion (breaking static friction), the corresponding torque value is recorded as the starting torque. The software plots this as a clear transition point on a torque vs. data-step count graph, providing a precise and repeatable measurement of static friction.
2. Torsional Stiffness Test
With the input shaft locked, the load servo applies a slowly oscillating torque to the output shaft, cycling from zero to positive rated torque, through zero to negative rated torque, and back to zero. The resulting plot of output torque vs. output angular deflection forms a hysteresis loop. The torsional stiffness is not a single value but is derived from the slope of the central “spine” of this hysteresis loop in its linear region, typically at higher torque levels. The non-linear region at very low torque reveals the effects of pre-load and internal clearances within the rotary vector reducer.
$$ K = \frac{\Delta T}{\Delta \phi} \quad \text{(from the central, linear portion of the hysteresis loop)} $$
3. Transmission Error Test
The drive motor rotates the rotary vector reducer at a constant low speed under light load. The high-resolution encoders on both the input and output shafts record angular positions synchronously. The software computes the instantaneous transmission error using the formula \( \Delta\theta = \theta_2 – \frac{\theta_1}{i} \) and plots it against the output shaft angle over one or more complete revolutions. The resulting plot shows the cyclic error pattern, and key metrics like peak-to-peak error or RMS error are automatically calculated. This test is fundamental for assessing the kinematic accuracy and gear quality of the rotary vector reducer.
4. Transmission Efficiency Test
This test maps the efficiency of the rotary vector reducer across its operational envelope. The drive motor maintains a set input speed. The load servo, in torque control mode, applies a series of discrete load points (e.g., 25%, 50%, 75%, 100%, 110% of rated torque). At each steady-state condition, the input and output torque and speed are recorded. The transmission efficiency \( \eta \) is calculated in real-time:
$$ \eta = \frac{P_{\text{out}}}{P_{\text{in}}} = \frac{T_{\text{out}} \cdot \omega_{\text{out}}}{T_{\text{in}} \cdot \omega_{\text{in}}} $$
The software generates efficiency contour maps or 2D plots showing efficiency versus output torque for different speeds, revealing the optimal operating region of the rotary vector reducer and losses due to friction and churning.
Conclusion
The successful design and implementation of this comprehensive dynamic test platform provide a powerful tool for the research, development, and quality validation of rotary vector reducers. Its modular, dual-servo architecture ensures high precision, flexibility, and quiet operation. By enabling simultaneous and accurate measurement of multiple critical performance parameters—including transmission error, torsional stiffness, efficiency, and backlash—the platform offers unparalleled insight into the dynamic behavior of these complex gear systems. The data generated is instrumental for benchmarking products, diagnosing design or manufacturing flaws, validating theoretical models, and guiding optimization efforts. This test bed establishes a essential experimental foundation for advancing the performance and reliability of domestically produced rotary vector reducers, a crucial step towards technological independence in precision robotics and automation.