
In the field of precision metal forming, the cold forging of a straight spur gear presents significant challenges due to high forming loads and limited die life. Traditional overall loading methods often result in enormous forces that restrict practical application. To address this issue, I propose a two-step cold forging process: first, pre-forging the billet using overall loading to create a blocker geometry, and then final forging of the tooth profile using local loading. In this study, I employ the finite element software DEFORM-3D to simulate the entire cold forging sequence for a straight spur gear. The results demonstrate that the locally loaded final forging step can reduce the required forming load by approximately 70% compared to conventional overall loading, while still achieving complete tooth filling.
The straight spur gear chosen for this investigation has the following geometric parameters: module \(m = 2\ \text{mm}\), number of teeth \(z = 18\), pressure angle \(\alpha = 20^\circ\), face width \(B = 10\ \text{mm}\), and a boss at the top with a height of \(1.5\ \text{mm}\) and diameter \(28\ \text{mm}\). I constructed the three-dimensional solid models of the forging, dies, and billet using Unigraphics NX, as detailed in the table below.
| Parameter | Symbol | Value |
|---|---|---|
| Module | \(m\) | 2 mm |
| Number of teeth | \(z\) | 18 |
| Pressure angle | \(\alpha\) | 20° |
| Face width | \(B\) | 10 mm |
| Boss height | \(h_{\text{boss}}\) | 1.5 mm |
| Boss diameter | \(d_{\text{boss}}\) | 28 mm |
| Billet diameter | \(d_0\) | 30 mm |
| Billet height | \(h_0\) | 19.4 mm |
Applying the principle of volume constancy, I determined the billet dimensions such that its outer diameter closely matches the root circle diameter of the straight spur gear. The resulting billet size is \(\varnothing 30\ \text{mm} \times 19.4\ \text{mm}\).
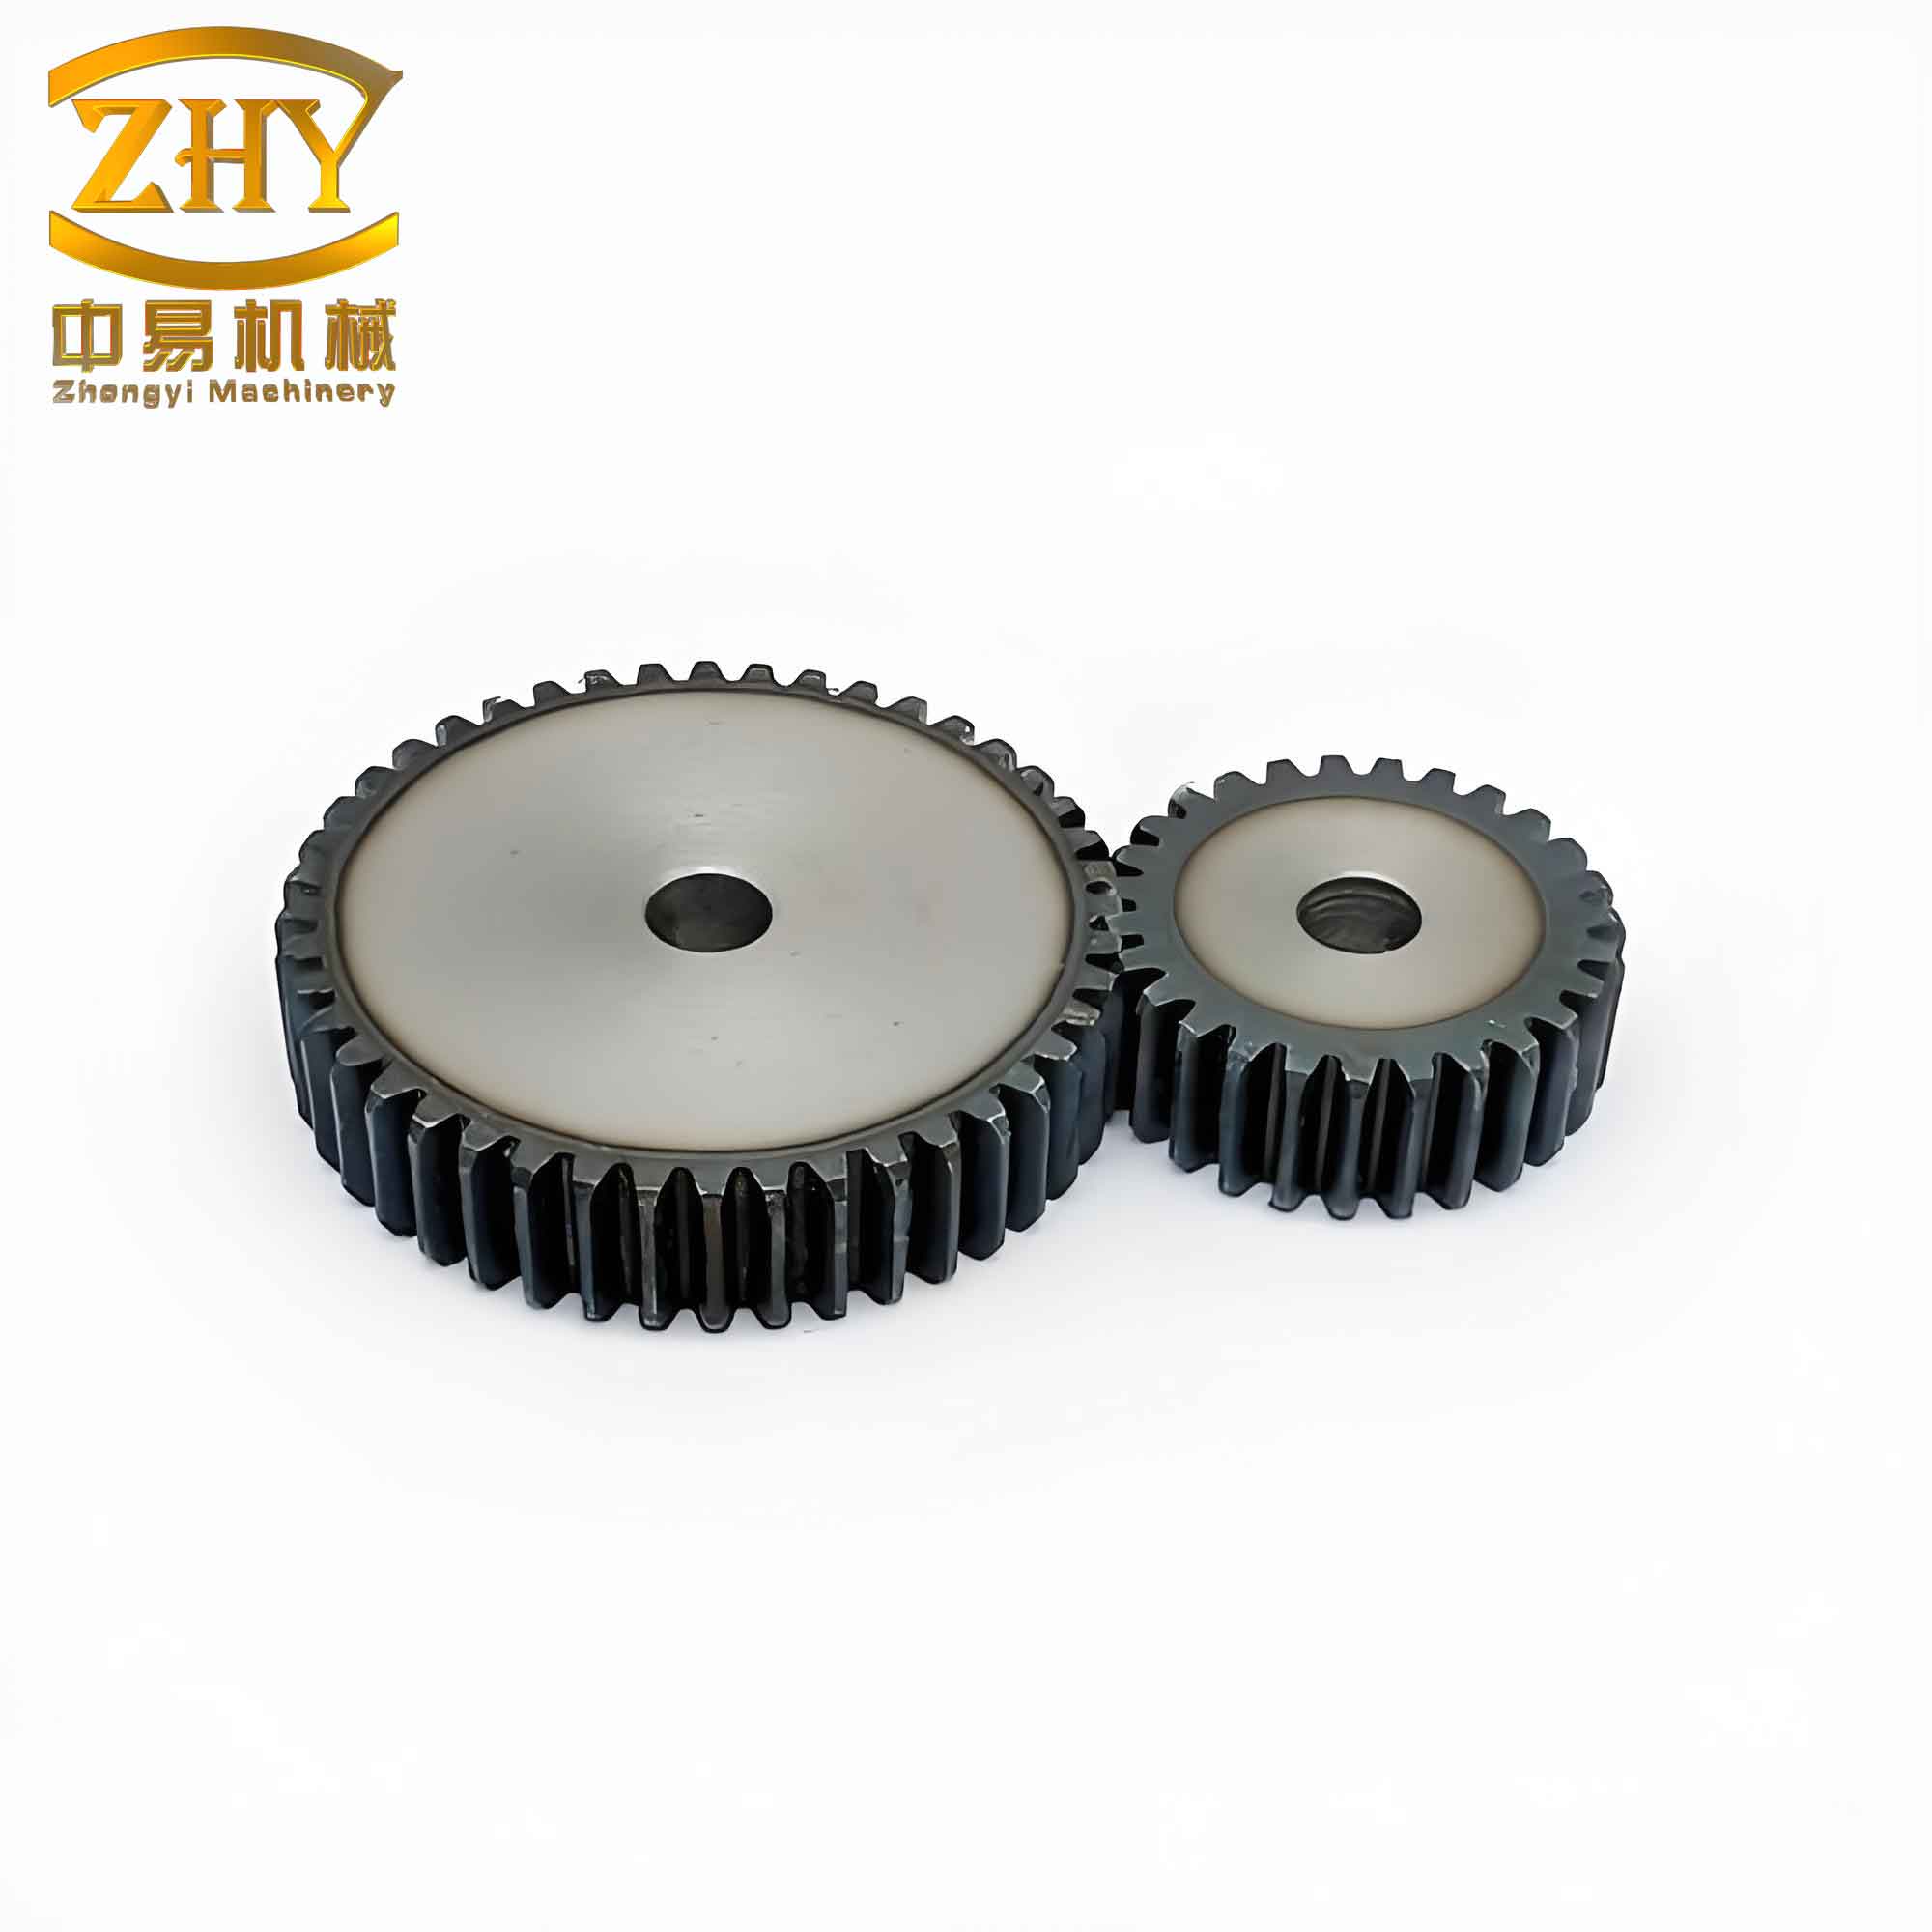
For the finite element simulation, I established a rigid-plastic material model because elastic deformation is negligible compared to the large plastic flow during cold forging of the straight spur gear. The dies were treated as rigid bodies, while the workpiece was defined as plastic using the DEFORM-3D material library AISI-1010 (cold). The yield strength is 205 MPa, and the flow stress is expressed as a function of equivalent strain, strain rate, and temperature. In this study, I adopted a simplified power‑law relationship:
$$ \bar{\sigma} = K \, \bar{\varepsilon}^n \, \dot{\bar{\varepsilon}}^m $$
where \(K\) is the strength coefficient, \(n\) is the strain hardening exponent, and \(m\) is the strain rate sensitivity. The friction between the billet and the dies was modeled as shear friction with a coefficient of 0.12. The forming temperature was set to 20 °C, and the velocities of the upper punch and the floating die were both 5 mm/s. The key simulation parameters are summarized in the table below.
| Parameter | Value |
|---|---|
| Material model | Rigid-plastic |
| Workpiece material | AISI-1010 (cold) |
| Yield strength | 205 MPa |
| Friction type | Shear friction |
| Friction coefficient | 0.12 |
| Temperature | 20 °C |
| Upper punch velocity | 5 mm/s |
| Floating die velocity | 5 mm/s |
| Maximum element size (global) | 0.4 mm |
| Maximum element size (tooth region) | 0.2 mm |
Mesh generation is critical because the straight spur gear undergoes severe three-dimensional plastic deformation, leading to element distortion and potential interference with the die surfaces. I employed a tetrahedral mesh with automatic remeshing based on strain, contact penetration, volume ratio, and direct criteria. To improve computational efficiency and accuracy, I refined the mesh in the tooth profile region where the largest deformation occurs. The global maximum element size was set to 0.4 mm, while the tooth region was refined to 0.2 mm. The resulting finite element model is shown schematically in the simulation setup.
The process was divided into two stages: first, a closed‑die pre‑forging (blocker) step using overall loading, and second, a local loading final forging step to form the tooth profile. In the pre‑forging stage, I applied a load up to 150 kN, which corresponds to a unit pressure of 1364 MPa. The pre‑forged billet accumulates material in the tooth cavity region, providing a favorable starting geometry for the local loading stage. After pre‑forging, I subjected the workpiece to stress‑relief annealing before transferring it into the final die cavity for the local loading step.
I extracted the equivalent strain distribution from the simulation results at different incremental steps. During the initial stage of local loading (step 90), the material at the upper part of the tooth cavity starts to fill radially because the annular punch acts only on the tooth region. The equivalent strain is concentrated in the upper tooth area. As deformation progresses, the lower part of the tooth cavity also begins to fill. Simultaneously, because the central region of the annular punch is hollow, material flows upward to form the boss when resistance in the tooth region increases. At the final stage (step 111), the highest equivalent strain appears at the lower corner of the tooth (region I) and at the transition between the boss and the tooth (region II), reaching a value of 1.60. These are the most difficult areas to fill. The equivalent strain distribution can be described by the von Mises equivalent strain:
$$ \bar{\varepsilon} = \sqrt{\frac{2}{3} \left( \varepsilon_x^2 + \varepsilon_y^2 + \varepsilon_z^2 + 2\varepsilon_{xy}^2 + 2\varepsilon_{yz}^2 + 2\varepsilon_{zx}^2 \right) } $$
The equivalent stress distribution follows a similar pattern. The maximum stress in the tooth region gradually shifts from the upper corner to the lower corner. At step 111, the stress at the lower corner reaches its peak value. Throughout the entire deformation, the highest stress never exceeds 666 MPa, which is well below the rupture limit of the material. The stress state can be expressed using the von Mises equivalent stress:
$$ \bar{\sigma} = \sqrt{ \frac{1}{2} \left[ (\sigma_1 – \sigma_2)^2 + (\sigma_2 – \sigma_3)^2 + (\sigma_3 – \sigma_1)^2 \right] } $$
To further understand the material flow, I analyzed the velocity field. At step 90, the metal in the upper tooth region flows fastest, while some material also moves toward the lower tooth corner and the boss. By step 100, the upper tooth corner is nearly filled, so the flow toward the lower corner and the boss accelerates. At the final stage (step 111), both tooth corners are completely filled, and the boss region exhibits the highest velocity. This observation confirms that the local loading sequence effectively avoids the sudden load spike typical of overall loading. The annular upper punch also acts as a分流 mechanism (flow relief), which redistributes material and reduces the required force.
The forming load as a function of punch travel is shown in the load‑stroke curves. I compared three cases: local loading after annealing (curve 1), local loading without annealing (curve 2), and overall loading after annealing (curve 3). The results are summarized in the following table.
| Loading strategy | Peak load (kN) | Reduction relative to overall loading |
|---|---|---|
| Overall loading (annealed) | ~400 | – |
| Local loading (without annealing) | ~150 | ~62 % |
| Local loading (annealed) | ~120 | ~70 % |
It is evident that local loading drastically reduces the forming load. The annealed local loading case (curve 1) achieves the lowest peak load of approximately 120 kN, which is about 70 % lower than the overall loading peak of 400 kN. This significant reduction is attributed to the smaller contact area in the main loading direction and the favorable material flow promoted by the pre‑forged blocker. The load‑stroke relationship can be approximated by a polynomial function:
$$ F(s) = a s^3 + b s^2 + c s + d $$
where \(s\) is the punch stroke, and the coefficients vary with the loading method. For the optimal local loading case, the load increases gradually without any abrupt jumps, indicating smooth filling of the tooth profile.
In conclusion, the two‑step cold forging process combining overall pre‑forging and local final forging is highly effective for manufacturing a straight spur gear. The pre‑forging step accumulates material in the tooth cavity, while the local loading step fills the tooth profile with a greatly reduced forming load. The simulation results confirm that the tooth shape is completely filled, and the maximum equivalent strain and stress remain within acceptable limits. The forming load is reduced by approximately 70 % compared to conventional overall loading. This process provides a practical reference for the cold forging of straight spur gears with high precision and long die life.
Key findings from the simulation are summarized in the final table below.
| Metric | Value |
|---|---|
| Maximum equivalent strain | 1.60 (at tooth corner and boss transition) |
| Maximum equivalent stress | < 666 MPa |
| Peak load (local loading, annealed) | 120 kN |
| Reduction in load vs. overall loading | ~70 % |
| Tooth filling | Complete |
The successful application of local loading to the cold forging of a straight spur gear demonstrates its potential for industrial production. Further work can explore optimization of the pre‑forging geometry and the effect of different annealing conditions on material flow and load reduction.