
In the field of industrial robotics and CNC machinery, the RV reducer plays a critical role due to its compact design, high reduction ratio, substantial power transmission capacity, and superior precision. As a key component in robotic joints, the performance of the RV reducer directly influences the overall accuracy, reliability, and longevity of the system. My research focuses on addressing the gap in real-time motion precision evaluation for domestically developed RV reducers, particularly before mass production. The goal is to ensure high qualification rates and extended service life by implementing an online detection system that can simulate actual working conditions and provide actionable data for design optimization.
The core innovation of my work lies in the creation of a multi-station, parallel-operating detection system that leverages non-contact eddy current sensors, advanced data acquisition hardware, and custom software built on VC++ and Access database technologies. This system not only captures real-time motion accuracy data but also processes and analyzes it to identify patterns and influences of various components on the overall performance of the RV reducer. Through rigorous testing, I have been able to correlate specific design parameters, such as cycloid gear tooth profile, with observable precision metrics like positioning error and vibration amplitude, thereby offering a data-driven pathway for enhancing RV reducer quality.
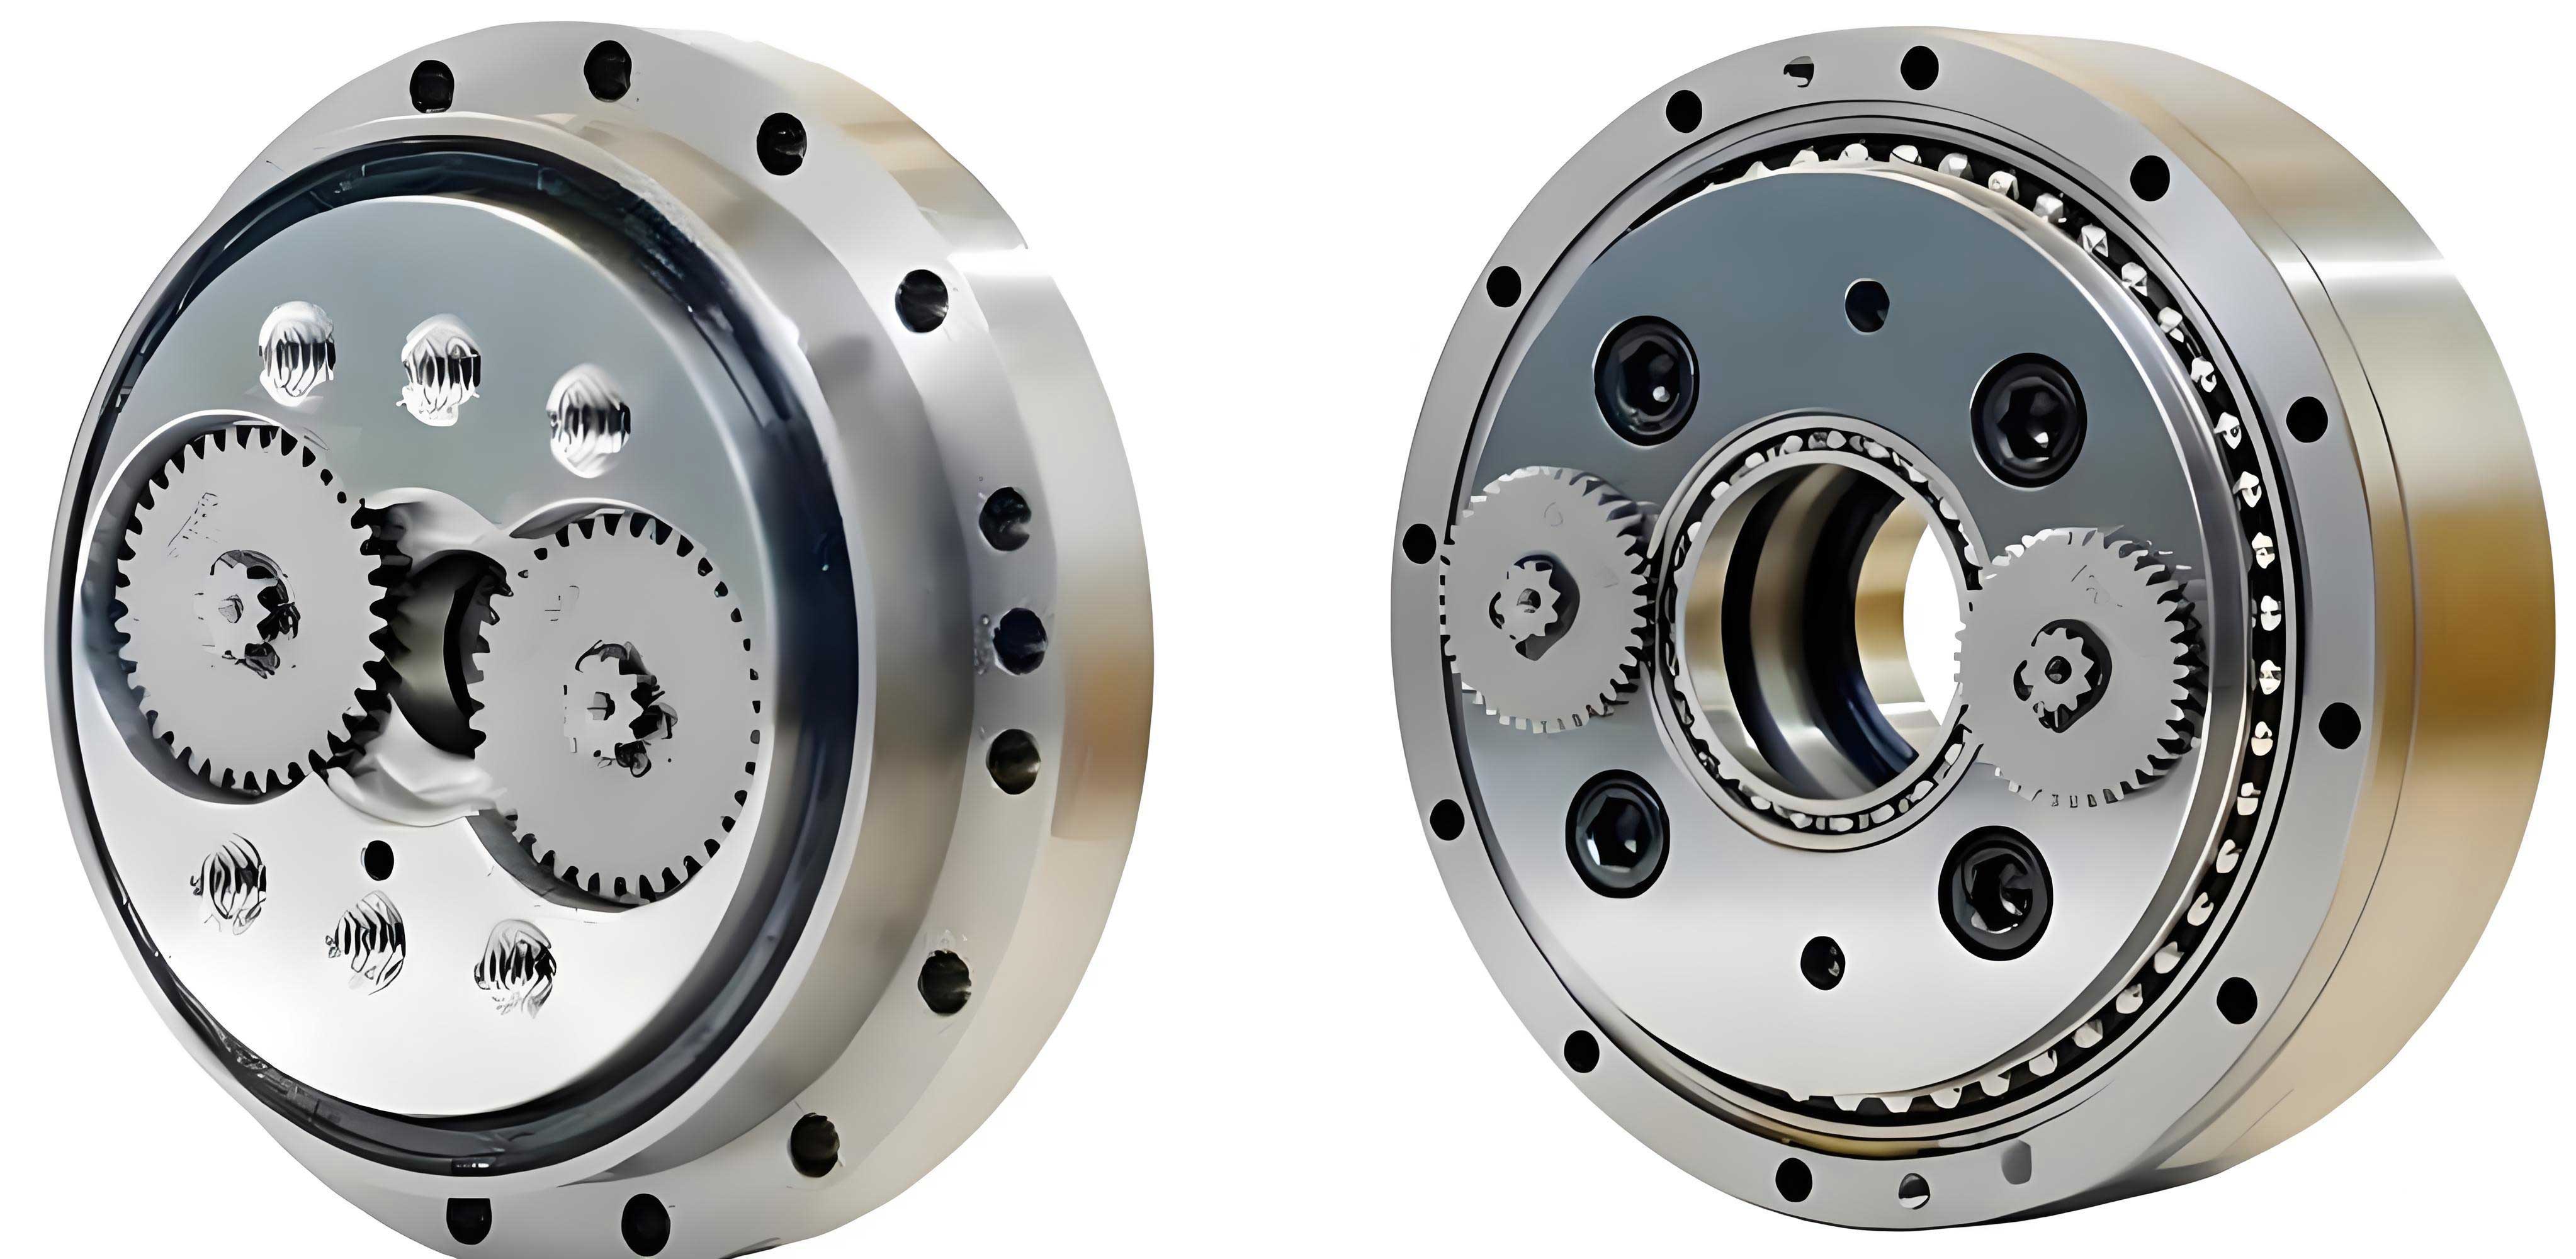
The motivation for this research stems from the dominance of foreign manufacturers, like Japan’s Teijin, in the high-precision RV reducer market. While static mechanical analyses of RV reducers have seen significant progress, dynamic motion characteristics under operational loads remain underexplored, especially for prototype evaluation. My system tackles this by providing a comprehensive solution for online motion precision detection, which is essential for predicting fatigue life, wear resistance, and overall reliability. The ability to conduct comparative tests across multiple stations simultaneously further accelerates the optimization process for RV reducer components.
The entire detection system is architecturally divided into three primary subsystems: the mechanical loading system, the data acquisition system, and the data processing system. Each subsystem is meticulously designed to work in harmony, replicating the dynamic environment of an industrial robot joint. The mechanical system incorporates a servo motor for motion control and an adjustable cantilever arm to apply variable loads, simulating different operational scenarios for the RV reducer. The data acquisition system centers on high-sensitivity eddy current sensors and a multi-channel DAQ card, ensuring synchronous and precise capture of displacement signals. Finally, the data processing system, hosted on an industrial PC, handles real-time filtering, display, storage, and analysis through a custom MFC application.
| Module Name | Primary Components | Key Function |
|---|---|---|
| Motion Control Module | Servo Motor, Encoder, Control Software | Programs motor for specific frequencies, angles, and motion profiles to test the RV reducer under varied conditions. |
| RV Reducer Loading Module | Adjustable Cantilever Arm, Weights | Applies configurable loads to the RV reducer output, mimicking real-world robotic arm payloads and stresses. |
| Eddy Current Sensor Module | ECL202e Series Sensors, Mounting Brackets | Measures non-contact displacement at the cantilever tip with high linearity and sensitivity to detect minute motions of the RV reducer. |
| Data Acquisition Module | PCI-9222 DAQ Card, SCSI-VHDCI Cable, Terminal Blocks | Converts analog sensor signals to digital data, supports dual-channel synchronous sampling, and buffers data for transmission. |
| Upper Computer Module | Industrial PC, VC++ MFC Software, Access Database | Provides user interface, controls acquisition, performs data processing and filtering, displays real-time graphs, and stores results. |
The principle of operation for the eddy current sensors is fundamental to the system’s accuracy. These sensors operate based on the electromagnetic induction effect. When an alternating current passes through the sensor’s coil, it generates a magnetic field. As this field interacts with the conductive target (the cantilever arm), eddy currents are induced. The strength of these eddy currents alters the impedance of the coil. The relationship between the gap distance \(d\) and the sensor’s output voltage \(V_{out}\) can be modeled with high linearity within a specific range. For our selected sensor, the sensitivity \(S\) is 2.857 mV/µm. The output voltage for a given gap is:
$$ V_{out} = V_0 – S \cdot d $$
where \(V_0\) is the output voltage at the reference gap. The system is calibrated so that changes in \(d\), resulting from the motion of the RV reducer’s output shaft, are directly proportional to changes in \(V_{out}\). This allows us to precisely track the positional accuracy and any vibrations or errors introduced by the RV reducer during operation.
Selecting the right data acquisition card was crucial for handling the high-fidelity data from the sensors. The chosen card features 16-bit analog-to-digital converters, a maximum sampling rate of 250 kS/s, and simultaneous sampling across multiple channels. This ensures that the data from both sensor channels, which monitor symmetric points on the loading mechanism, are captured without phase delay, enabling true comparative analysis. The card’s specifications comfortably exceed the requirements set by the sensor’s 15 kHz bandwidth and 0-10 V output range.
The software architecture is the brain of the system. Developed in VC++ 6.0 using the Microsoft Foundation Classes (MFC), the application manages the entire workflow. The main program flow is designed for robustness and user control. It begins with system initialization and sensor positioning verification. Once the sensors are correctly aligned, the user can set acquisition parameters such as sampling frequency, sampling length, and motor speed through the graphical interface. The software then registers the DAQ card, configures the acquisition threads, and starts the servo motor. As data streams in, it undergoes a two-stage software filtering process to eliminate noise and transient artifacts.
The data filtering methodology is a custom combination of an optimized median filter and an arithmetic mean filter. This approach effectively suppresses random interference and smoothens the data while preserving the true motion signal from the RV reducer. The process is mathematically described as follows:
Stage 1: Primary Averaging Filter
Raw data points \(X_n\) are acquired from the DAQ card buffer. To reduce high-frequency noise, consecutive groups of five points are averaged to form a preliminary data array \(\text{Data}[i]\):
$$ \text{Data}[i] = \frac{1}{5} \sum_{j=0}^{4} X_{5 \cdot k + j} \quad \text{for } i = 0, 1, 2, …, m; \quad k = 0, 1, 2, … $$
Here, \(m\) represents the total number of points set for acquisition per trigger event.
Stage 2: Optimized Mid-value and Secondary Mean Filter
The \(\text{Data}[i]\) array often contains edge disturbances from the start and stop of sensor acquisition. To mitigate this, we discard a fixed number of points at the beginning and end (“掐头去尾”). The central point \(\text{Data}[m/2]\) is selected as the target. A window of 12 points around this target (6 on either side) is then used for a final arithmetic mean calculation, yielding the processed value \(P_k\) for the \(k\)-th acquisition cycle:
$$ P_k = \frac{1}{12} \sum_{q=-5}^{6} \text{Data}\left[\frac{m}{2} + q\right] $$
To analyze the repeatability and drift of the RV reducer’s positioning, we calculate the error fluctuation \(B_i\) relative to a baseline measurement \(P_0\):
$$ B_i = P_i – P_0 $$
where \(i\) indexes subsequent test cycles. Plotting \(B_i\) over multiple cycles reveals the repeat positioning accuracy and long-term stability trends of the RV reducer.
| Component | Model/Specification | Performance Metric |
|---|---|---|
| Eddy Current Sensor | ECL202e Series | Range: 35 mm, Sensitivity: 2.857 mV/µm, Linearity Error: 0.02%, Output: 0-10 V DC |
| Data Acquisition Card | PCI-9222 | Channels: 16 AI (16-bit), Max Sample Rate: 250 kS/s, Synchronous Sampling, Input Range: ±10V |
| Servo Motor System | Custom with Encoder | Programmable speed (RPM) and angular displacement for precise motion control of the RV reducer input. |
| Software Platform | VC++ 6.0, MFC, Access DB | Real-time display, data logging, advanced filtering, and analysis functions specific to RV reducer testing. |
The communication between the software and hardware is managed through dynamic link libraries (DLLs) provided by the DAQ card manufacturer. The MFC application calls functions to configure the card’s sampling rate and trigger mode, allocate buffers, and start acquisition tasks. When the sensor detects the predefined start position of the RV reducer’s output cycle, a digital trigger signal is sent to the DAQ card, initiating data capture. The acquired voltage data is transferred from the card’s onboard memory to the PC’s RAM via DMA, ensuring high-speed, uninterrupted data flow. The software then converts these voltage values into displacement values using the calibrated sensitivity, applies the filtering algorithms, and immediately updates the graphical display while concurrently committing the results to the Access database.
System calibration and debugging are essential preliminary steps. Each time a sensor is repositioned or an RV reducer sample is changed, the system requires realignment. This involves adjusting the sensor支架 so that the target falls within the linear mid-range of the sensor’s measurement span. Furthermore, software parameters like sampling frequency and the number of points per acquisition must be tuned based on the rotational speed of the RV reducer to ensure that the plotted curves accurately reflect the motion and that data points are sufficiently dense for analysis.
The true value of this online detection system is realized in the analysis of test results. By subjecting a prototype RV reducer to prolonged running-in tests and varying load conditions, we can extract critical performance indicators. Two of the most revealing metrics are vibration error and positioning error.
Vibration Error Analysis: When the servo motor pauses or reverses direction, the inertia and internal clearances within the RV reducer can cause damped oscillations at the output arm. The amplitude and decay rate of these vibrations, measured by the eddy current sensor, are direct indicators of the RV reducer’s dynamic stiffness and assembly quality. A well-designed and precisely assembled RV reducer will exhibit minimal and quickly decaying vibration. The vibration error \(A_v\) for a given stop event can be quantified as the peak-to-peak displacement during the oscillation period. Repeated measurements allow us to plot vibration amplitude against test cycle number, monitoring for any degradation that might signal wear or loosening.
Positioning Error Analysis: This is perhaps the most critical metric for an RV reducer in robotics. It measures the deviation of the output shaft from its commanded angular position. Our system measures this indirectly as the linear displacement at the end of the cantilever arm. By commanding the RV reducer to return to the same angular position multiple times, we can capture its repeatability. The positioning error \(E_p\) for the \(i\)-th cycle is defined as the difference between the measured position and the nominal (or first measured) position. The spread of \(E_p\) values over many cycles defines the repeat positioning accuracy. Furthermore, the systematic shift of the average \(E_p\) over a long test run can indicate phenomena like thermal drift or progressive wear within the RV reducer.
To illustrate the system’s diagnostic power, consider the following analysis. Initial tests on a prototype RV reducer showed significant positioning jump errors at specific points in its rotation, as seen in Figure 9 (conceptual representation). The error pattern suggested intermittent binding or backlash. After optimizing the design of the cycloid gear tooth profile—a primary component influencing the motion precision of the RV reducer—and improving the assembly tolerance of the crankshaft and pinion gears, subsequent tests showed a marked reduction in both the magnitude and frequency of these jump errors, as conceptually shown in Figure 10. This direct feedback loop from test data to design modification is invaluable for RV reducer development.
The system also incorporates a proactive protection feature. Thresholds for maximum allowable displacement or vibration can be set in the software. If the real-time data exceeds these thresholds, the software triggers an audible and visual alarm and can send a stop command to the servo motor. This prevents potential damage to the sensor or the RV reducer under test from unforeseen mechanical failures or overloads.
In conclusion, the online motion precision detection system I have developed provides a comprehensive, reliable, and efficient platform for evaluating the dynamic performance of RV reducers. Its ability to simulate real operating conditions, capture high-resolution data in real-time, and perform sophisticated analysis fills a crucial need in the domestic development and production of high-performance RV reducers. The insights gained regarding the influence of cycloid gear design, gear shaft alignment, and crankshaft precision on the overall motion accuracy of the RV reducer are directly applicable to design optimization and quality control processes. By enabling multi-station parallel testing and detailed historical data tracking, this system significantly contributes to improving the qualification rate, reliability, and longevity of RV reducers before they are deployed in critical industrial applications. The integration of sensitive eddy current sensing, robust data acquisition, and intelligent software processing creates a powerful tool for advancing the state-of-the-art in RV reducer technology.