
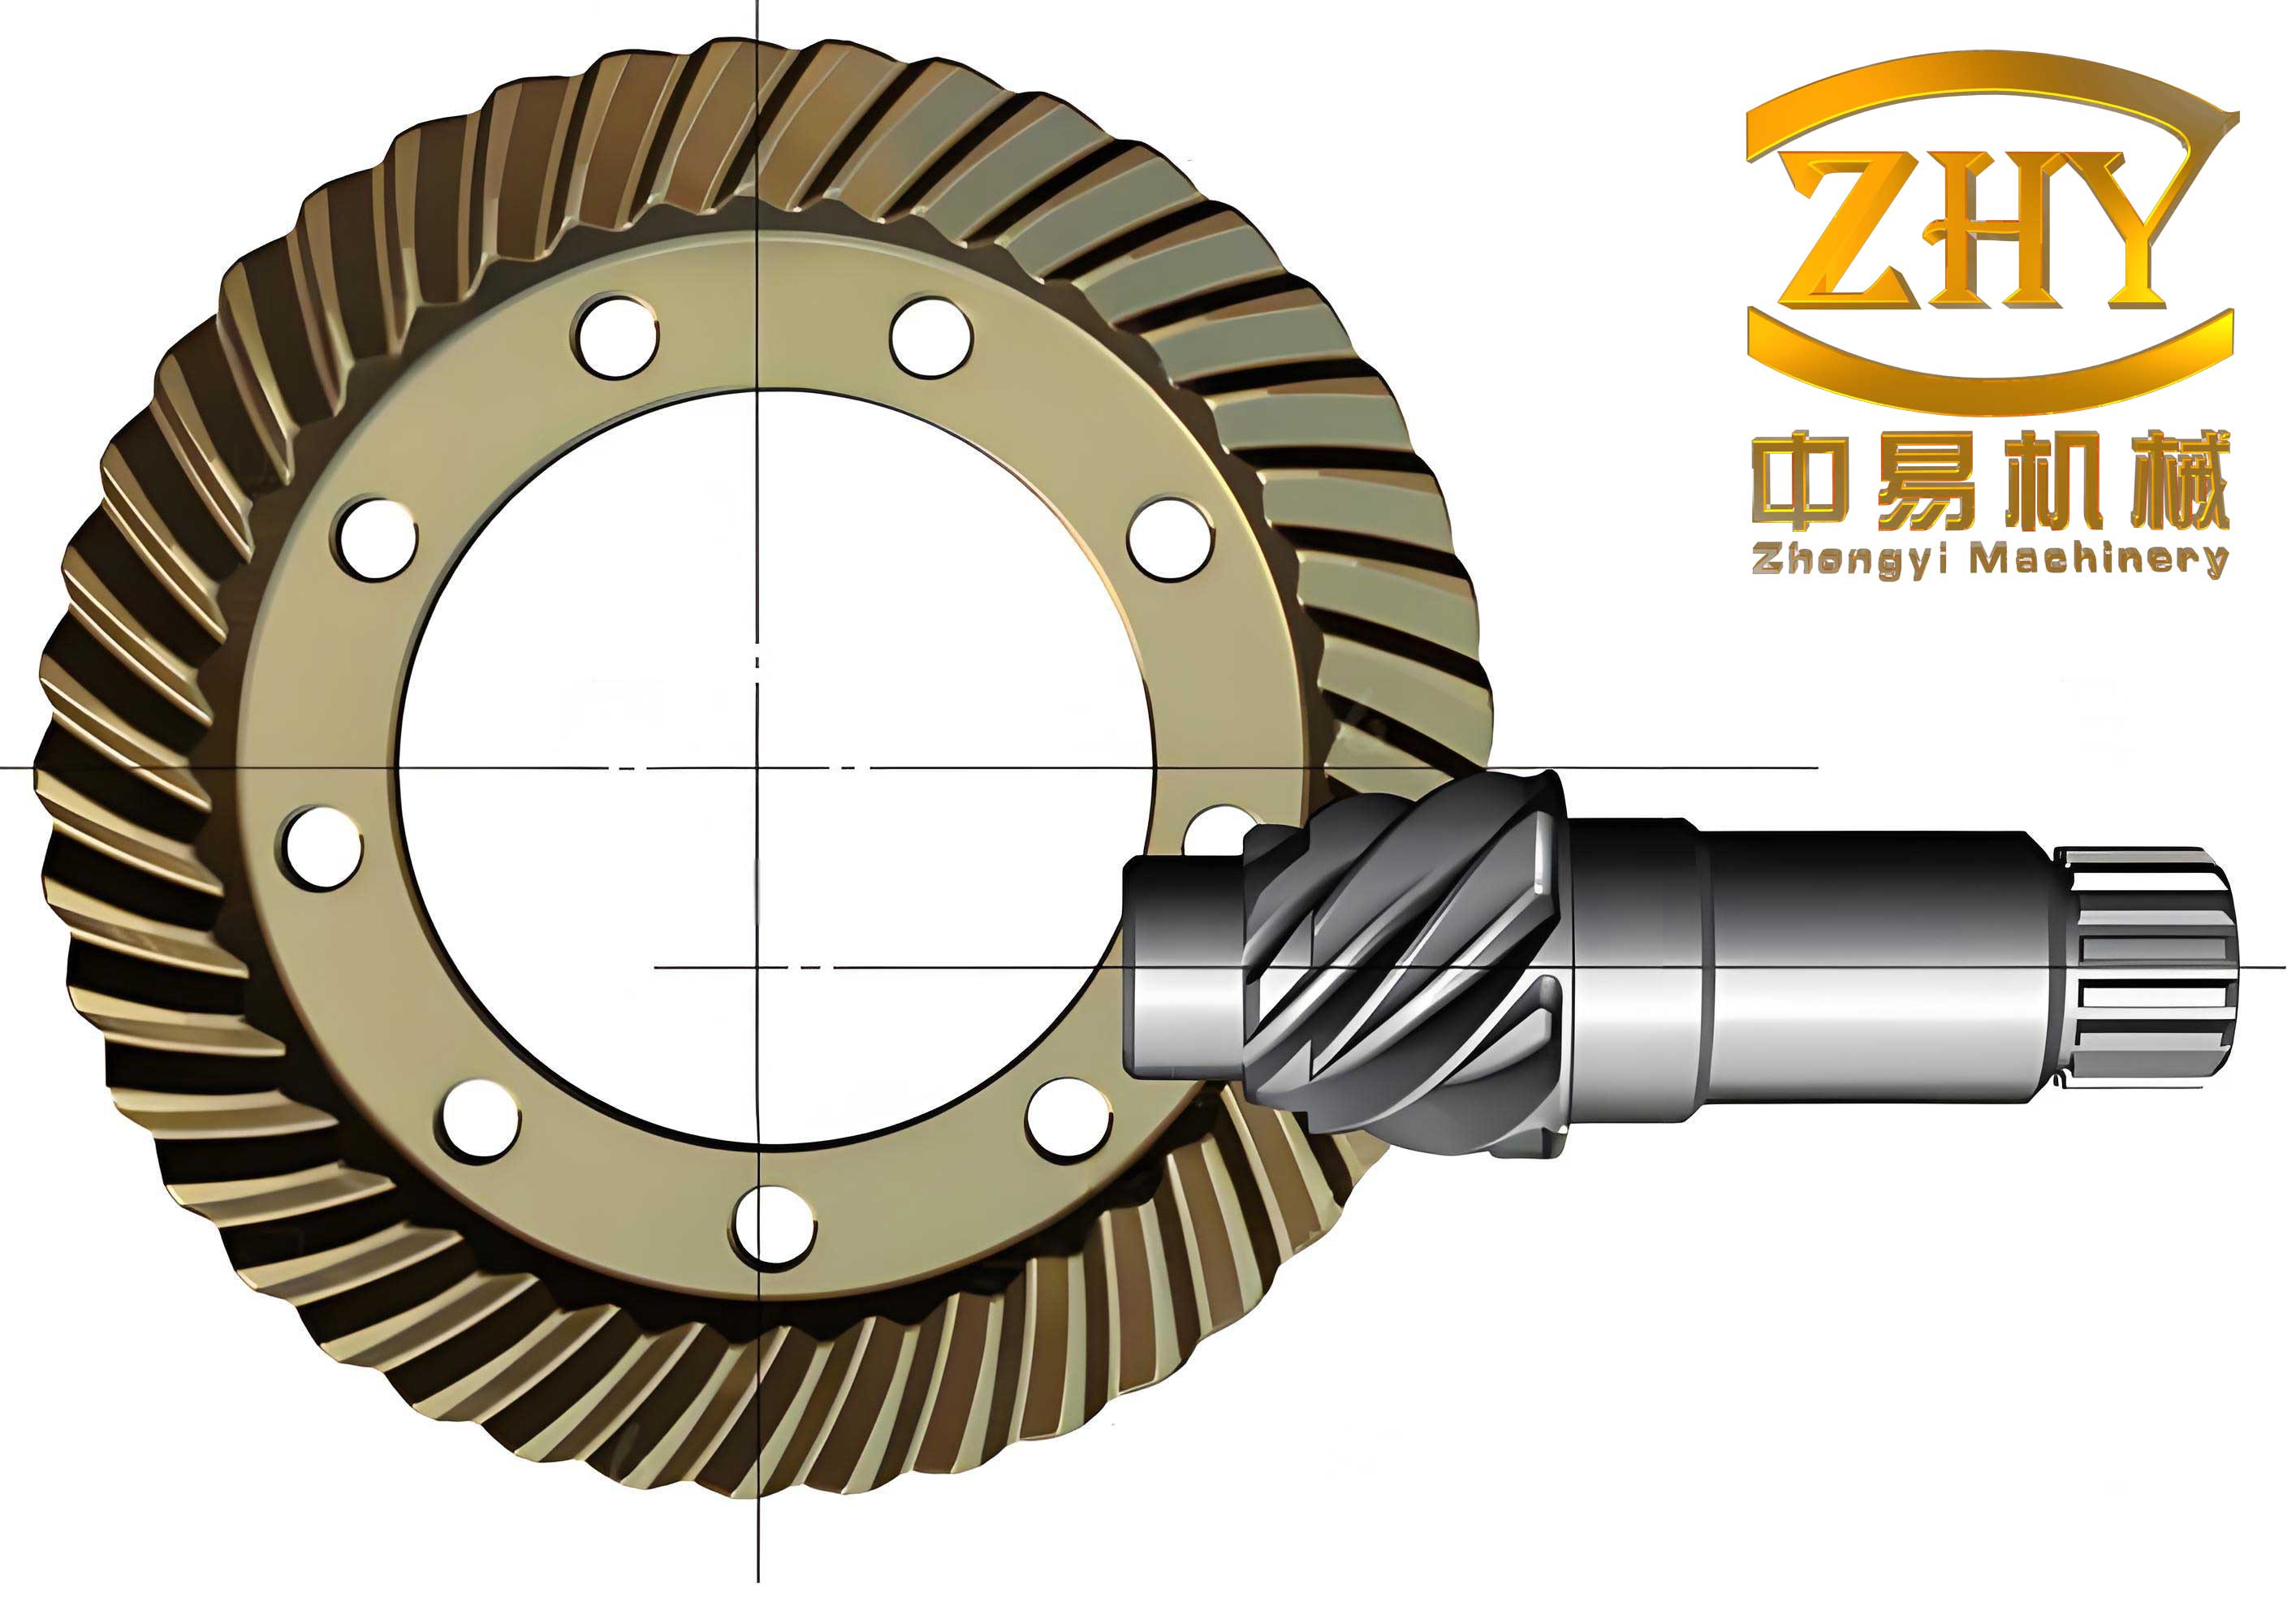
In this work, I focused on the dynamic characteristics of a transmission mechanism containing hypoid gears. Hypoid gears are widely employed in vehicle drive axles, aviation reducers, and industrial gearboxes because of their excellent load capacity, high contact ratio, low noise, and high transmission stability. However, their complex tooth surfaces make them sensitive to machining and assembly errors. My research aimed to quantify the natural properties, dynamic response, and stability of hypoid gears under healthy and faulty conditions. I built a parametrically defined three-dimensional model of a hypoid gear pair, performed finite element simulations, and analyzed mesh stiffness and transmission error under different loads and fault states. The main contributions of this thesis are a comprehensive dynamic analysis of hypoid gears, a new crack prefabrication method, and a comparative sensitivity study of installation errors.
Introduction and Research Background
Hypoid gears are essentially spiral bevel gears with an offset between the pinion axis and the gear axis. This offset allows the pinion to be placed lower than the gear center, which is beneficial for vehicle chassis design. The gear mesh in a hypoid pair involves a curved line of action, and the teeth are generated by complex machine motions. Because of the strong influence of tooth geometry on the dynamic behavior, I started from the gear generation process. In the literature, many researchers have studied gear dynamics using lumped parameter models and finite element models. The main dynamic issues include modal characteristics, time-varying mesh stiffness, internal excitation, transmission error, and fault-induced changes. I found that most previous studies concentrated on spur or helical gears, and relatively few comprehensive studies exist for hypoid gears under realistic failure conditions. Therefore, I decided to build a complete modeling and simulation framework for a hypoid gear reducer.
The fundamental dynamic equation of a gear transmission can be written in matrix form:
$$
\mathbf{M}\ddot{\mathbf{x}} + \mathbf{C}\dot{\mathbf{x}} + \mathbf{K}\mathbf{x} = \mathbf{F}(t)
$$
where \(\mathbf{M}\), \(\mathbf{C}\), and \(\mathbf{K}\) are the mass, damping, and stiffness matrices, respectively. For the free vibration analysis, the external force vector is zero. The natural frequencies and mode shapes are obtained by solving the undamped eigenvalue problem. I applied this formulation to a pair of hypoid gears in my finite element software environment.
Geometric Modeling of Hypoid Gears
To perform accurate dynamic simulations, I first established a three-dimensional model of a hypoid gear pair. The modeling procedure was based on the local conjugate principle. In conventional conjugate gear theory, two tooth surfaces contact along a line. However, hypoid gears manufactured by the local conjugate principle contact at a point, and the contact area under load expands to an ellipse. This point contact provides a small amount of elasticity and reduces sensitivity to manufacturing errors.
The local conjugate principle can be described mathematically. For a selected contact point \(M\), the common normal vectors of the theoretical conjugate surface and the actual generated surface are identical, but the curvatures are modified. Let \(\Delta k_n\) be the relative normal curvature between the two surfaces in a certain direction. If two surfaces are separated by a small distance \(\Delta \delta\), the half-length of the contact area along that direction is \(l/2\). The fundamental relation is:
$$
\Delta \delta = \frac{l^2}{8}\Delta k_n
$$
For practical gear design, I introduced a contact length coefficient \(f\), which is the ratio of the contact length along the tooth length direction to the whole face width. If \(b\) is the face width and \(\beta\) is the spiral angle, the actual contact length is \(l = f b / \cos\beta\). Substitution into the curvature relation gives the curvature correction along the tooth length direction:
$$
\Delta A = \left(\frac{\cos\beta}{f b}\right)^2
$$
Similarly, the curvature correction along the tooth height direction can be related to the gear tooth number and pitch radius. To avoid interference, the short geodesic torsion correction must satisfy the condition:
$$
2\Delta A \Delta B – \Delta C^2 \geq 0
$$
This condition ensures that the two tooth surfaces do not interfere near the contact point. I used these equations to determine the cutter and machine settings for generating the hypoid gear pair.
In my model, the gear blank and cutter were represented in a virtual machine coordinate system. The large gear was generated by the face-milling method with a generating process, while the small pinion was generated by the tilted head cutter method. The key parameters of the hypoid gear pair are summarized in Table 1.
| Parameter | Pinion | Gear |
|---|---|---|
| Number of teeth | 17 | 43 |
| Module / mm | 5 | |
| Face width / mm | 34.678 | 33.000 |
| Offset distance / mm | 15 | |
| Shaft angle / ° | 90 | |
| Outside diameter / mm | 95.9646 | 216.9153 |
| Pitch diameter / mm | 85 | 215 |
| Spiral angle / ° | 35 | 35 |
| Spiral direction | Left hand | Right hand |
The machine adjustment parameters for the large gear generated by the generating method are shown in Table 2. These values correspond to a cutter radial setting, angular setting, machine root angle, horizontal setting, vertical setting, ratio of roll, and sliding base.
| Parameter | Value |
|---|---|
| Generating method | Face-milling with generating |
| Radial cutter setting, \(S_q\) / mm | 78.354 |
| Angular cutter setting, \(q\) / ° | 49.258 |
| Machine root angle, \(G_m\) / ° | 5.120 |
| Horizontal setting, \(X_p\) / mm | 66.785 |
| Vertical setting, \(E_m\) / mm | 2.946 |
| Ratio of roll, \(i_G\) | 5.348 |
| Sliding base, \(X_b\) / mm | 0.99854 |
For the pinion, I used the tilted cutter method and adjusted the machine settings separately for the concave and convex flanks. Table 3 lists the pinion machine settings. The resulting tooth forms were generated by the envelope of the cutter set. I created the solid model of one tooth by connecting the tooth surfaces, root surface, and gear body. Then, by circular patterning around the gear axis, I obtained the complete gear models. The two gears were assembled in SolidWorks with the correct offset and shaft angle, and I then exported the model for finite element meshing.
| Parameter | Concave flank | Convex flank |
|---|---|---|
| Generating method | Tilted cutter | Tilted cutter |
| Radial cutter setting, \(S_q\) / mm | 77.3248 | 75.1467 |
| Angular cutter setting, \(q\) / ° | 75.0243 | 73.4000 |
| Machine root angle, \(G_m\) / ° | 18.42 | 18.42 |
| Horizontal setting, \(X_p\) / mm | 1.3485 | 2.6784 |
| Vertical setting, \(E_m\) / mm | 25.6542 | 25.5421 |
| Ratio of roll, \(i_G\) | 4.1243 | 3.0148 |
| Sliding base, \(X_b\) / mm | 0.57824 | 1.24580 |
Finite Element Dynamic Analysis
After building the solid models, I imported them into the finite element preprocessor HyperMesh. I used hexahedral structured meshes because they give better accuracy for contact analysis than tetrahedral meshes. The meshing process was not trivial due to the complex hypoid tooth surfaces. I first isolated one tooth, divided it into several blocks, generated two-dimensional quadrilateral meshes on the projection, and then extruded them into three-dimensional hexahedral elements. After copying around the axis and merging coincident nodes, I obtained the full gear mesh. For the dynamic simulation, I reduced the model to a segment with six teeth to save computation time while still ensuring enough tooth engagements.
The finite element mesh was then imported into Abaqus. I defined the material properties with a Young’s modulus of \(2.1\times10^5\) MPa, a Poisson’s ratio of 0.3, and a density of \(7.8\times10^{-9}\) t/mm³. I defined the contact between the pinion concave flank and the gear convex flank. The contact property included a hard normal behavior and a friction coefficient of 0.1 in the tangential direction. To apply the boundary conditions, I created reference points at the centers of the pinion and gear and kinematically coupled the inner bore surfaces of both gears to the reference points. I applied a rotational speed of 6000 r/min to the pinion and a resisting torque of \(1.0\times10^6\) N·mm to the gear in the analysis.
For the dynamic analysis, I used the implicit dynamics solver with a time step small enough to capture the mesh cycle. Each tooth engagement period was divided into twenty increments. The total simulation time was 0.00353 s, and the number of time increments was chosen such that about six teeth passed through the mesh. This allowed me to obtain a stable response after the initial transient.
Modal Analysis of Hypoid Gears
Modal analysis is an important part of gear dynamics because the natural frequencies determine the resonance conditions. I performed a free vibration analysis of the hypoid gear set and extracted the first six mode shapes and natural frequencies. The results are listed in Table 4.
| Mode order | 1 | 2 | 3 | 4 | 5 | 6 |
|---|---|---|---|---|---|---|
| Natural frequency / Hz | 100.22 | 101.56 | 104.28 | 118.97 | 150.61 | 207.10 |
The first mode is a torsional mode in which the teeth are twisted and the stress is distributed uniformly in the circumferential direction. The second and third modes are bending modes with axial deformation and symmetric stress distribution about perpendicular planes. The fourth and fifth modes are higher bending modes where the deflected teeth are more localized, and the sixth mode is a combined bending-torsion mode in which the gear body tends to expand outward. The natural frequency increase is small between modes 1 and 2, but becomes significant between modes 5 and 6. These results provide useful guidance for avoiding resonance in a hypoid gear reducer.
Time-Varying Mesh Stiffness
Time-varying mesh stiffness is the main internal excitation in gear systems. I computed the instantaneous mesh stiffness from the finite element results using the following equation:
$$
K_n(t) = \frac{F_n(t)}{u_n(t)}
$$
where \(F_n(t)\) is the normal contact force and \(u_n(t)\) is the combined elastic displacement at the contact point. Because the hypoid tooth surface is not a simple plane, I obtained \(F_n\) and \(u_n\) directly from the nodal contact results in Abaqus. I extracted the contact force on one tooth as a function of time and selected only the nodes where the contact pressure was positive. The contact displacement was then averaged over those nodes. After inserting these values into the stiffness formula, I obtained the single-tooth mesh stiffness curve. The mesh engagement time and the time difference between two consecutive teeth are important parameters. The contact ratio can be expressed as:
$$
\varepsilon = \frac{\Delta T}{\Delta t}
$$
where \(\Delta T\) is the actual engagement time of a single tooth and \(\Delta t\) is the time interval between adjacent tooth engagements. From the simulation I found \(\Delta T = 0.00053\) s and \(\Delta t = 0.00039\) s, yielding a contact ratio of \(\varepsilon = 1.76\). Using the single-tooth stiffness and the contact ratio, I constructed the multi-tooth meshing stiffness by shifting the single-tooth curve by the angular pitch increment:
$$
\Delta \alpha = \frac{\varphi}{\varepsilon}
$$
where \(\varphi\) is the total rotation angle of the gear during one mesh cycle. The resulting multi-tooth mesh stiffness increases as a new pair enters engagement and decreases as a pair leaves engagement. This periodic variation is the main excitation for vibration.
I also studied the effect of load magnitude on the mesh stiffness. When the load torque was increased to 1.5 times and 2 times the rated value, the engagement time between adjacent teeth decreased, the contact ratio increased, and the average mesh stiffness increased. The increase became larger with increasing load because higher loads deform the teeth more and bring more contact area into action. This trend is important for the design of heavy-duty hypoid gear reducers.
Transmission Error
Transmission error is a direct measure of the angular deviation between the input and output members. I defined the loaded transmission error as:
$$
TE = \left(\varphi_2 – \varphi_{20}\right) – \frac{z_1}{z_2}\left(\varphi_1 – \varphi_{10}\right)
$$
where \(\varphi_1\) and \(\varphi_2\) are the actual rotation angles of the pinion and the gear, \(\varphi_{10}\) and \(\varphi_{20}\) are their initial angles, and \(z_1\) and \(z_2\) are the numbers of teeth of the pinion and gear, respectively. By extracting the rotations from the finite element model, I calculated the transmission error history. The curve showed a relatively large fluctuation at the beginning, which was caused by the acceleration from rest. After a short transient, the fluctuation amplitude decreased and settled into a harmonic pattern. This harmonic behavior is characteristic of the periodic tooth mesh.
I then applied load torques of 1.5 times and 2 times the rated value and recomputed the transmission error. The results showed that the amplitude of the transmission error decreased with increasing load. The reduction from 1.0 to 1.5 times the rated load was larger than the reduction from 1.5 to 2.0 times the rated load. This indicates that increasing the load improves the effective meshing quality of hypoid gears by increasing the contact ratio, but the benefit gradually saturates.
Fault Analysis of Hypoid Gears
In practice, hypoid gears are subjected to various defects. I considered two important fault categories: tooth cracks and installation errors. These faults affect the dynamic response and stability of the gear transmission.
Crack Fault in Hypoid Gears
To simulate a tooth crack, I used fracture mechanics. The stress intensity factors represent the intensity of the singular stress field near the crack tip. For a hypoid gear tooth, the crack can be of opening mode, sliding mode, or tearing mode. I used the linear elastic fracture mechanics theory to compute the distribution of stress near the crack tip. For the opening mode, the normal stress components near the crack tip are:
$$
\sigma_x = \frac{K_I}{\sqrt{2\pi r}} \cos\frac{\theta}{2}\left(1 – \sin\frac{\theta}{2}\sin\frac{3\theta}{2}\right)
$$
$$
\sigma_y = \frac{K_I}{\sqrt{2\pi r}} \cos\frac{\theta}{2}\left(1 + \sin\frac{\theta}{2}\sin\frac{3\theta}{2}\right)
$$
$$
\tau_{xy} = \frac{K_I}{\sqrt{2\pi r}} \sin\frac{\theta}{2}\cos\frac{\theta}{2}\cos\frac{3\theta}{2}
$$
where \(r\) and \(\theta\) are the polar coordinates with respect to the crack tip. I evaluated the average values of the stress intensity factors for the three modes. The opening mode stress intensity factor was much higher than the sliding and tearing modes, which means the crack propagates mainly in the opening mode. The average values are listed in Table 5, where \(K_Y\) denotes the representative stress intensity factor magnitude.
| Crack mode | Opening mode | Sliding mode | Tearing mode |
|---|---|---|---|
| \(K_Y\) / (MPa·mm\(^{1/2}\)) | 168.47 | 4.32 | 3.98 |
I prefabricated semi-elliptical cracks at the critical location where the maximum contact pressure occurred. The critical location was determined from the contact pressure distribution on the tooth surface; the maximum contact pressure in the healthy gear was 1954.5 MPa. Three crack depths were considered: the semi-minor axis \(b\) was set to 1 mm, 1.5 mm, and 2 mm, while the semi-major axis was fixed at 10 mm. I inserted these cracks into the finite element model by splitting the solid at the crack plane, so that the crack faces were free surfaces.
After simulating the cracked hypoid gear pair, I calculated the mesh stiffness and transmission error. The cracked gear showed a reduction in mesh stiffness. The average stiffness values and the percentage decreases are summarized in Table 6.
| Crack level | Average stiffness / (\(10^4\) N/m) | Reduction / % | Increment in reduction / % |
|---|---|---|---|
| No crack | 11.22 | — | — |
| Crack 1 | 7.26 | 13.9 | — |
| Crack 2 | 7.06 | 24.5 | 76.5 |
| Crack 3 | 4.99 | 48.8 | 98.9 |
The transmission error of the cracked hypoid gear pair was also strongly affected. The fluctuation amplitude increased as the crack depth increased, but only when the cracked tooth was in engagement. After the cracked tooth disengaged, the transmission error returned to the healthy condition. The transmission error amplitude data are given in Table 7.
| Crack level | Amplitude / (\(10^{-3}\) rad) | Increase / % | Increment in increase / % |
|---|---|---|---|
| No crack | 3.01 | — | — |
| Crack 1 | 5.31 | 76.39 | — |
| Crack 2 | 6.49 | 115.48 | 39.09 |
| Crack 3 | 9.36 | 210.82 | 95.35 |
These results show that a crack primarily reduces the mesh stiffness and increases the vibration excitation. The mesh stiffness reduction and the transmission error fluctuation happen in the same mesh period, which means that the cracked tooth produces a strong impact at its engagement frequency. In a reducer, if such a crack is present, the dynamic load will increase considerably and may lead to further crack propagation.
Installation Error Faults
Installation errors are common in practical applications of hypoid gears. I considered three types of installation errors: pinion axial error, gear axial error, and offset error. I introduced each error in the range from \(-0.3\) mm to \(+0.3\) mm and evaluated the resulting changes in transmission error and mesh stiffness.
The pinion axial error shifted the transmission error curve along the time axis. A positive pinion axial error delayed the transmission, while a negative pinion axial error advanced it. The magnitude of the shift increased with the error amplitude, and the negative direction produced a larger shift than the positive direction. The pinion axial error also increased the transmission error amplitude. The offset error, on the other hand, did not shift the curve but increased the amplitude. The gear axial error caused only a small shift and a small amplitude increase. The transmission error amplitude changes for the three installation errors at different error values are summarized in Table 8.
| Error value / mm | Pinion axial error | Gear axial error | Offset error |
|---|---|---|---|
| −0.3 | 3.57229 | 3.40076 | 4.11998 |
| −0.2 | 3.38693 | 3.35063 | 3.70475 |
| −0.1 | 3.30363 | 3.21979 | 3.30414 |
| 0 | 3.08586 | 3.08586 | 3.08586 |
| 0.1 | 3.27718 | 3.12212 | 3.27772 |
| 0.2 | 3.27553 | 3.19167 | 3.22119 |
| 0.3 | 3.38966 | 3.27887 | 3.39007 |
From Table 8, the offset error causes the largest increase in transmission error amplitude when compared to the healthy value. The pinion axial error is the most significant factor for shifting the transmission error curve, and it also increases the amplitude by about 15.7% at 0.3 mm. The gear axial error has the least influence among the three. These observations are consistent with the fact that the pinion is the more sensitive member in a hypoid gear pair because of its smaller size and larger spiral angle.
I also calculated the average mesh stiffness under installation errors, as shown in Table 9. The mesh stiffness generally increased with installation error, but the change was relatively small. The maximum increase was about 2.51% compared with the healthy condition, and this occurred for the pinion axial error. The offset error had the smallest effect on the average mesh stiffness.
| Error value / mm | Pinion axial error | Gear axial error | Offset error |
|---|---|---|---|
| −0.3 | 11.64455593 | 11.407792 | 11.221419 |
| −0.1 | 11.538922 | 11.460914 | 11.429027 |
| 0 | 11.358989 | 11.358989 | 11.358989 |
| 0.1 | 11.460913 | 11.538922 | 11.303954 |
| 0.3 | 11.407791 | 11.644556 | 11.265779 |
The contact line analysis showed that axial errors shifted the contact pattern toward the tooth tip. For positive pinion axial error, the contact line moved to a later time step, and for negative error it moved earlier. The contact pressure also increased significantly with installation errors. For example, the maximum contact pressure reached 2778.470 MPa for a pinion axial error of \(-0.3\) mm, compared with 1954.5 MPa in the healthy case. This increase in local contact pressure is a major concern because it can accelerate surface wear and pitting.
By comparing the three installation error types, I concluded that the pinion axial error is the most critical for the dynamic response of hypoid gears. It affects both the shift and the amplitude of the transmission error, and it also produces the largest increase in mesh stiffness. The gear axial error is less critical, and the offset error is mainly responsible for increasing the amplitude without shifting the curve. Therefore, when assembling a hypoid gear reducer, the pinion axial position must be controlled with high precision.
Sensitivity of Installation Errors
Turbine engines and vehicle reducers often require extremely small installation tolerances. My sensitivity analysis allowed me to quantify the severity of each error. If I define the sensitivity as the maximum change in transmission error amplitude per unit error, then the pinion axial error has a mixed influence. The largest amplitude increase for the offset error is 33.5%, while the pinion axial error produces a 15.7% increase. However, the pinion axial error also shifts the phase, which may be even more harmful in synchronizing applications. The average mesh stiffness is most sensitive to the pinion axial error, with a maximum change of 2.51%, followed by the gear axial error and then the offset error.
From an engineering point of view, the assembly of hypoid gears should focus on minimizing the pinion axial runout. A small axial misalignment not only increases the transmission error and dynamic load but also causes an unfavorable contact pattern. The offset error, although having a smaller effect on stiffness, produces the largest fluctuation amplitude in transmission error, which can lead to noise and vibration. Therefore, both axial and offset tolerances should be carefully controlled during the manufacturing and installation of hypoid gears.
Conclusions
In this thesis, I studied the dynamic characteristics of reducer transmission mechanisms containing hypoid gears. I established a complete modeling and simulation approach based on the local conjugate principle and finite element analysis. The main conclusions are summarized as follows.
First, the natural frequencies of hypoid gears increase with the mode order. The first six modes range from about 100 Hz to 207 Hz. The mode shapes evolve from a torsional mode to bending modes and then to a combined bending-torsion mode. These results are important for avoiding resonance in the overall reducer system.
Second, the time-varying mesh stiffness of hypoid gears is load-dependent. Increasing the load reduces the effective engagement time between adjacent teeth, increases the contact ratio, and raises the mesh stiffness. The multi-tooth stiffness curve increases when a tooth enters engagement and decreases when it leaves engagement.
Third, the transmission error of a healthy hypoid gear pair shows an initial transient fluctuation and then a steady harmonic fluctuation. Increasing the load reduces the amplitude of the transmission error, but the improvement becomes less significant at higher loads.
Fourth, a tooth crack in hypoid gears causes a significant reduction in mesh stiffness and an increase in transmission error amplitude. The reduction percentage increases with crack depth; the maximum stiffness reduction was 48.8% for the deepest crack. The opening mode dominates the crack propagation, and the crack-induced dynamic excitation occurs at the same period as the mesh of the cracked tooth.
Fifth, installation errors have different effects. The pinion axial error is the most sensitive parameter, producing both a phase shift and an amplitude increase in the transmission error. The offset error produces the largest amplitude increase, while the gear axial error has the least influence. The average mesh stiffness is only slightly affected by installation errors, but the contact pressure increases dramatically, which can accelerate surface failure.
Finally, this research provides a practical reference for the design, optimization, and fault diagnosis of hypoid gear reducers. The dynamic model and the sensitivity results can be used to predict the influence of manufacturing and installation tolerances on the vibration and stability of hypoid gear transmission systems. Future work can extend this study by including bearing flexibility, lubrication effects, and more complex crack paths.