
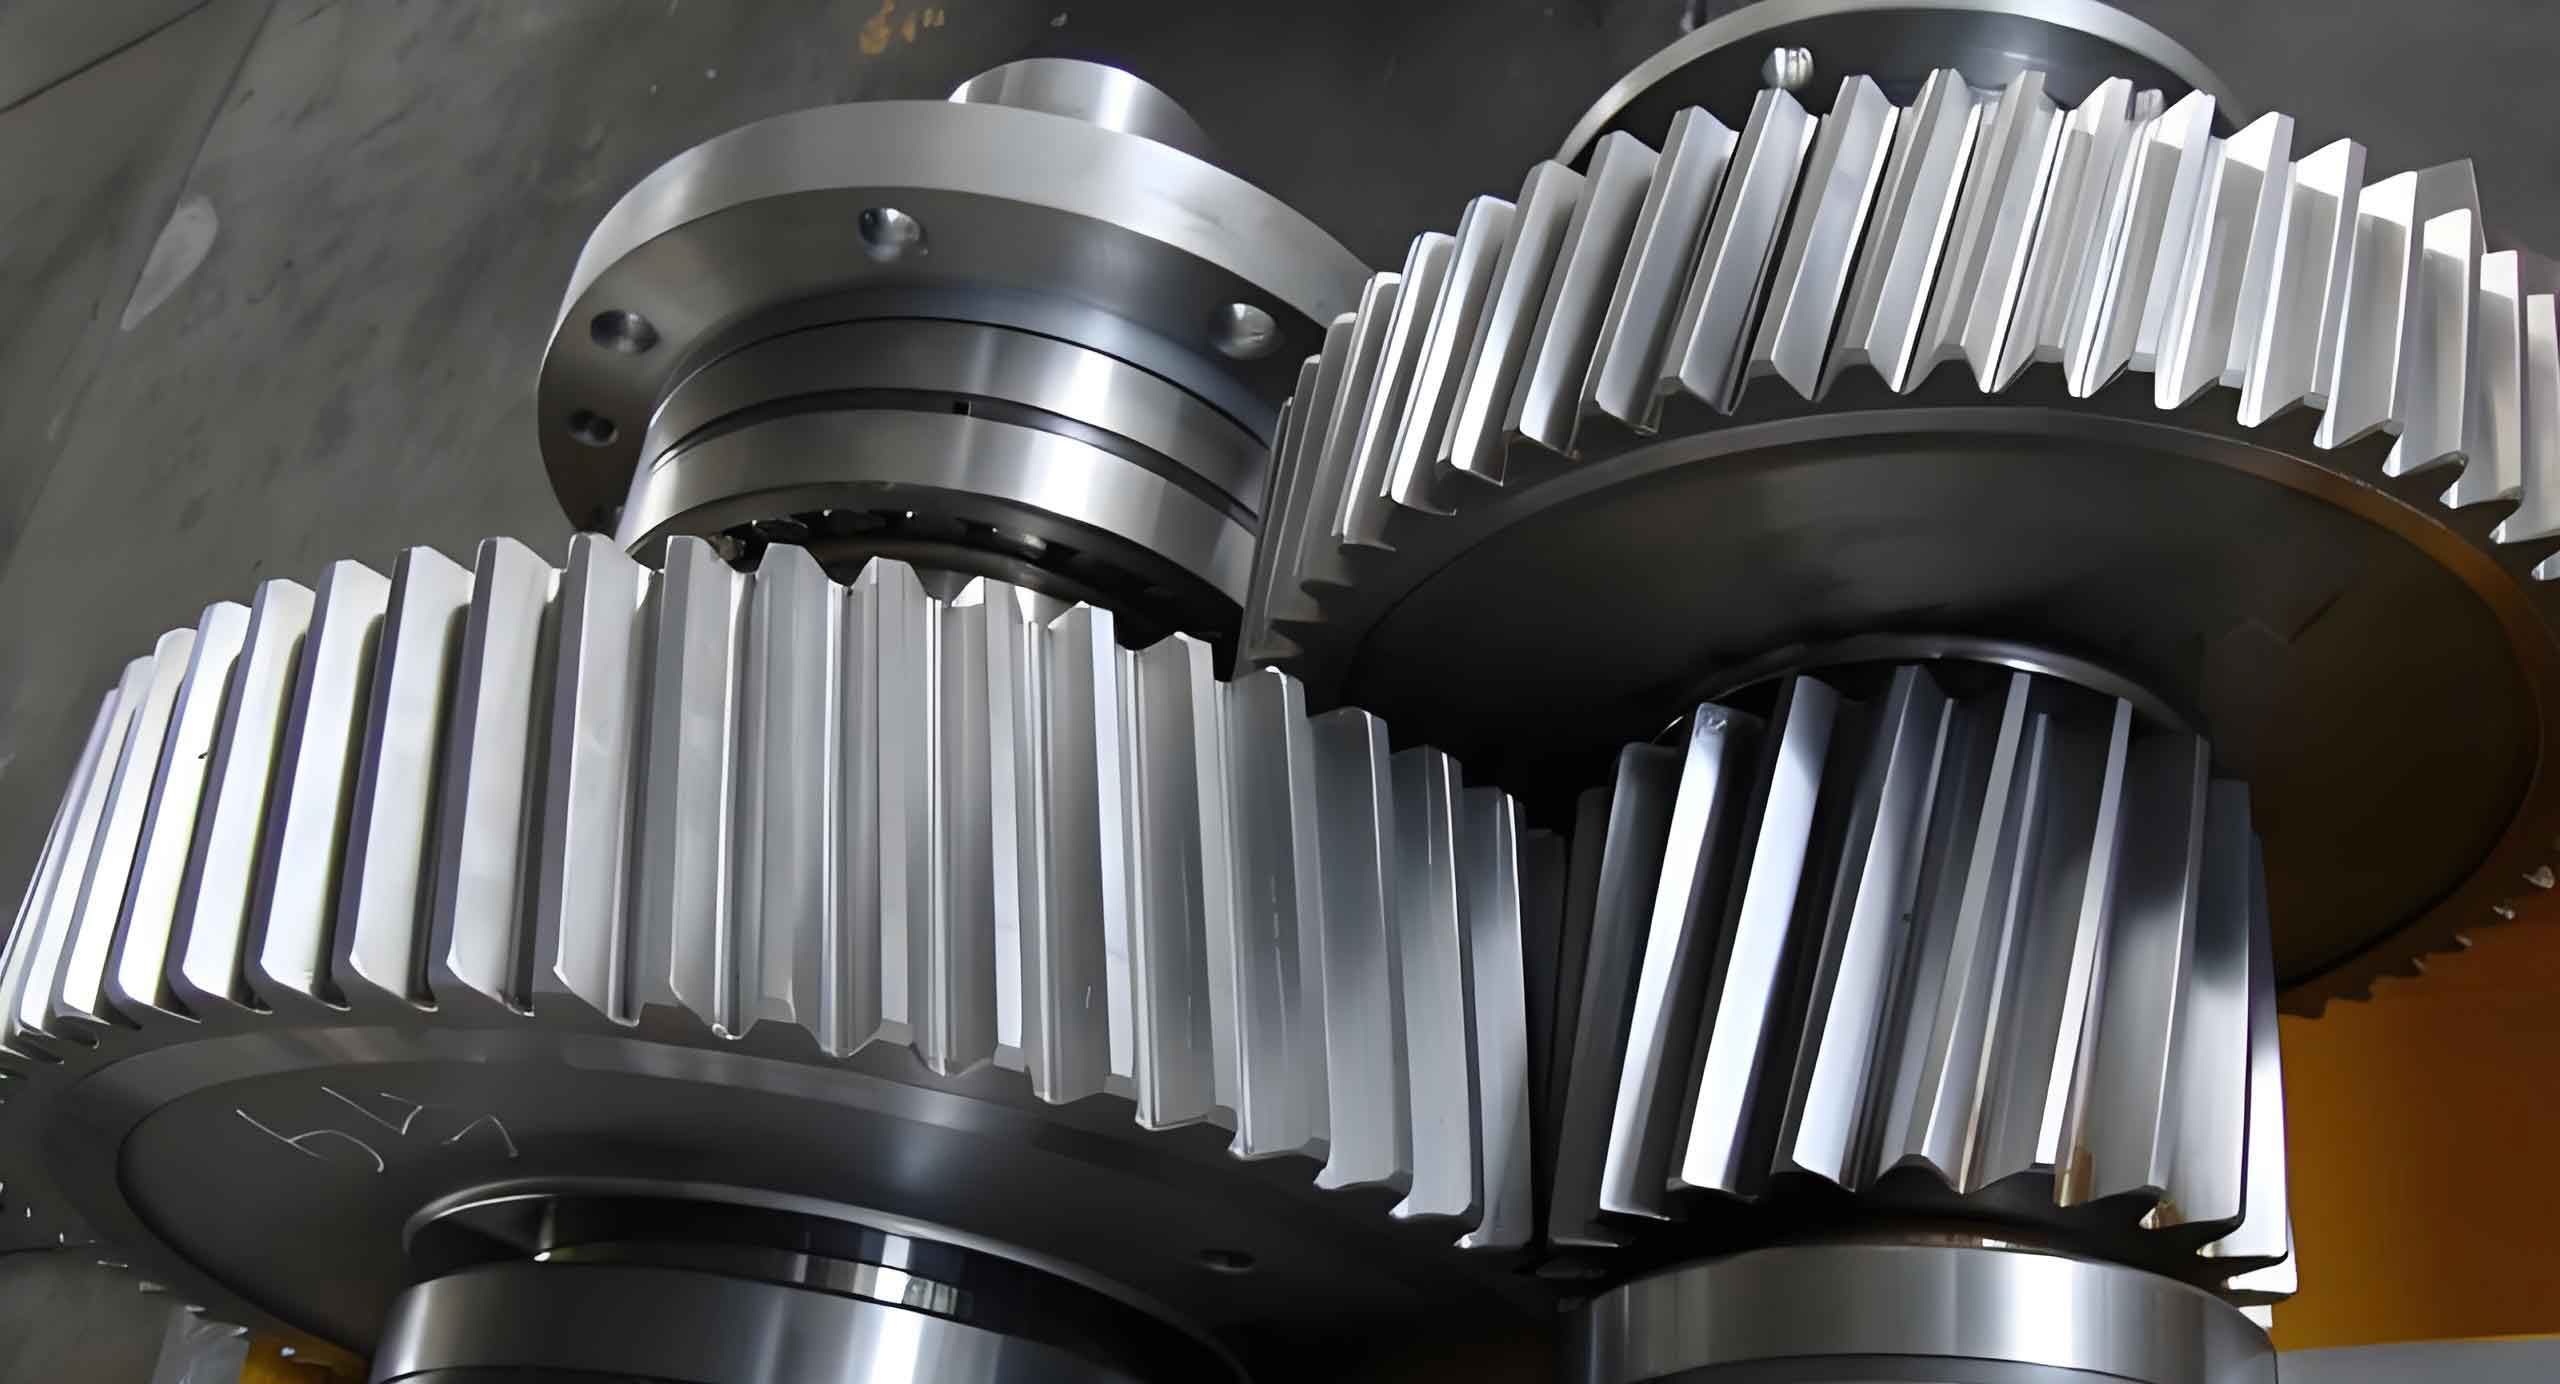
The reliable transmission of power and motion in modern machinery is heavily dependent on gear systems. Among various gear types, the helical gear is particularly valued for its smooth and quiet operation, high load-bearing capacity, and superior durability compared to spur gears. This performance stems from the gradual engagement of their angled teeth, which reduces impact forces and vibration. However, like all mechanical components, helical gears are susceptible to failures when operating under demanding conditions such as high speeds and heavy loads. Common failure modes include pitting, scuffing, and most critically, crack initiation and propagation. A crack, whether at the tooth root or on the tooth surface, fundamentally alters the local stiffness of the gear tooth. This change in stiffness modifies the dynamic meshing forces and excitations within the gear transmission system, leading to altered vibration signatures. Therefore, a detailed analysis of the dynamic characteristics of a helical gear pair with crack faults is not merely an academic exercise; it is crucial for developing early fault detection strategies, enabling predictive maintenance, and preventing catastrophic system failures. This article delves into the methodologies for modeling crack faults, calculating the resultant time-varying mesh stiffness (TVMS), and analyzing the dynamic response of the gear system.
1. Modeling Crack Faults and Calculating Time-Varying Mesh Stiffness
The core of dynamic analysis for a faulty gear lies in accurately determining how the crack affects the gear tooth’s resistance to deformation during meshing, quantified as mesh stiffness. For a healthy gear pair, the total effective mesh stiffness ($k_{total}$) is a periodic function resulting from the changing number of tooth pairs in contact and the varying position of the contact point along the tooth profile. When a crack is present, it reduces the tooth’s ability to resist bending and shear, thereby lowering its contribution to the overall mesh stiffness.
1.1 Stiffness Calculation using the Potential Energy Method
A gear tooth can be modeled as a non-uniform cantilever beam fixed at the root circle. The total potential energy stored in the tooth during deformation comprises several components: Hertzian contact energy ($U_h$), bending energy ($U_b$), shear energy ($U_s$), and axial compressive energy ($U_a$). According to the potential energy method, the corresponding stiffness components are the inverse of these energy values for a unit load.
For a healthy tooth, the stiffness components (bending $k_b$, shear $k_s$, axial $k_a$, Hertzian $k_h$) are calculated by integrating the strain energy along the tooth profile. The single-tooth mesh stiffness ($k_t$) is then given by the series combination of these components:
$$ \frac{1}{k_t} = \frac{1}{k_h} + \frac{1}{k_b} + \frac{1}{k_s} + \frac{1}{k_a} $$
For a gear pair, the effective mesh stiffness is the series combination of the stiffness from the pinion (1) and gear (2):
$$ \frac{1}{k_{mesh}} = \frac{1}{k_{t1}} + \frac{1}{k_{t2}} $$
1.2 Modifying Stiffness for Cracked Teeth
The presence of a crack reduces the effective area moment of inertia ($I_{xc}$) and the effective cross-sectional area ($A_{xc}$) of the tooth along the crack path. This reduction must be incorporated into the calculation of bending and shear energies.
Root Crack Model: A root crack is characterized by its length ($q$) and its propagation angle ($V$) relative to the tooth centerline. The cracked section’s geometry changes the expressions for $h$ and $h_x$, which define the tooth thickness at a distance $x$ from the tooth root. The modified bending and shear stiffness ($k_{b,crack}$, $k_{s,crack}$) for the cracked gear are calculated by integrating the strain energy with the updated $I_{xc}$ and $A_{xc}$ over the appropriate intervals (cracked and uncracked sections).
The single-tooth stiffness for the cracked pinion (assuming the crack is on the pinion) becomes:
$$ \frac{1}{k_{t,crack}} = \frac{1}{k_h} + \frac{1}{k_{b,crack}} + \frac{1}{k_{s,crack}} + \frac{1}{k_{a}} + \frac{1}{k_{b2}} + \frac{1}{k_{s2}} + \frac{1}{k_{a2}} $$
where subscripts 1 and 2 denote the pinion and the healthy gear, respectively.
Surface Crack Model: A surface crack originates on the tooth flank and is defined by its length ($q$), its distance from the root ($s$), and its angle ($V$). The calculation methodology is similar, but the geometric boundaries for the integration change as the crack starts at a point on the tooth profile rather than at the root. The expressions for $h$ and $h_x$ are adjusted accordingly before computing the affected bending and shear stiffness.
1.3 Extending to Helical Gears: The Slice Method
The calculation for a helical gear is more complex due to the angled teeth. The helical gear tooth is conceptually divided into a series of thin slices along its face width. Each slice is treated as a spur gear with a small, fixed face width. The contact line moves across these slices as the gears rotate. The total TVMS for the helical gear pair at any instant is the sum of the mesh stiffness of all slices that are in contact at that moment. This method effectively captures the gradual engagement and disengagement characteristic of helical gears, leading to a smoother stiffness variation compared to spur gears. The influence of a crack is evaluated slice-by-slice, affecting the stiffness contribution of only those slices through which the crack propagates.
| Parameter | Symbol | Value |
|---|---|---|
| Number of Teeth (Pinion/Gear) | $z_1 / z_2$ | 19 / 48 |
| Normal Module | $m_n$ | 3.175 mm |
| Normal Pressure Angle | $\alpha_n$ | 20° |
| Helix Angle | $\beta$ | ~0.2443° (or as specified) |
| Face Width | $B$ | 16 mm |
| Center Distance | $a$ | 106.3625 mm |
| Young’s Modulus | $E$ | 206 GPa |
| Poisson’s Ratio | $\nu$ | 0.3 |
2. Influence of Crack Parameters on Mesh Stiffness
The severity of the crack’s impact on the TVMS depends on its location, length, and orientation.
| Crack Type | Parameter | Effect on Mesh Stiffness ($k_t$) | Physical Reason |
|---|---|---|---|
| Root Crack | Length ($q \uparrow$) | Significant decrease $\downarrow \downarrow$ | Dramatically reduces area moment of inertia at the highly stressed root region. |
| Angle ($V \uparrow$) | Moderate decrease $\downarrow$ | Affects the path and extent of the reduced cross-section. | |
| Surface Crack | Length ($q \uparrow$) | Noticeable decrease $\downarrow$ | Reduces effective tooth thickness in the flank region. |
| Distance from Root ($s \uparrow$) | Varies; often less severe than root crack | Impact is less critical if crack is away from the maximum bending stress zone at the root. |
For a helical gear, the overall TVMS curve over one mesh cycle shows a periodic reduction corresponding to the engagement of the cracked tooth. The magnitude of this stiffness drop is directly related to the crack’s severity. A key finding is that for the same crack length, a root crack causes a more substantial reduction in mesh stiffness than a surface crack. This is because the root region is subject to the highest bending stresses, and any material loss there severely compromises the tooth’s structural integrity. The periodic engagement of the helical gear means this stiffness drop repeats each time the faulty tooth comes into contact, creating a periodic internal excitation.
3. Dynamic Modeling of a Helical Gear System with Crack Fault
To understand how the altered TVMS translates into measurable vibrations, a dynamic model of the gear transmission system is essential. A lumped-parameter, torsional vibration model provides significant insight while maintaining computational efficiency.
3.1 System Dynamics Equations
The system is modeled with two degrees of freedom, representing the torsional displacements of the pinion ($\theta_p$) and the gear ($\theta_g$). The governing equations of motion, derived using Newton’s second law, are:
$$ I_p \ddot{\theta}_p + c_m r_{b1} \left[ r_{b1} \dot{\theta}_p – r_{b2} \dot{\theta}_g – \dot{e}(t) \right] \cos \beta + k(t) r_{b1} \left[ r_{b1} \theta_p – r_{b2} \theta_g – e(t) \right] \cos \beta = T_p $$
$$ I_g \ddot{\theta}_g – c_m r_{b2} \left[ r_{b1} \dot{\theta}_p – r_{b2} \dot{\theta}_g – \dot{e}(t) \right] \cos \beta – k(t) r_{b2} \left[ r_{b1} \theta_p – r_{b2} \theta_g – e(t) \right] \cos \beta = -T_g $$
Where:
$I_p, I_g$ = Mass moments of inertia of pinion and gear.
$r_{b1}, r_{b2}$ = Base circle radii of pinion and gear.
$k(t)$ = Time-varying mesh stiffness (the primary source of parametric excitation, now modulated by the crack).
$c_m$ = Mesh damping coefficient.
$e(t)$ = Static transmission error (STE), representing geometrical imperfections and mounting errors.
$\beta$ = Helix angle.
$T_p, T_g$ = Input and output torques.
The dynamic transmission error (DTE), a common indicator of gear health, is defined as:
$$ \delta(t) = r_{b1} \theta_p – r_{b2} \theta_g $$
3.2 Numerical Solution
The equations of motion form a set of second-order, non-linear differential equations with time-varying coefficients ($k(t)$). These are typically solved using numerical integration methods like the fourth-order Runge-Kutta method. The solution yields the time-domain responses of the dynamic transmission error and the vibration velocities/accelerations.
| Parameter | Symbol | Value / Range |
|---|---|---|
| Pinion Inertia | $I_p$ | 7.5e-3 kg·m² (example) |
| Gear Inertia | $I_g$ | 1.84e-4 kg·m² (example) |
| Mesh Damping Ratio | $\zeta$ | 0.05 – 0.10 |
| Input Torque | $T_p$ | 500 N·m to 50,000 N·m |
| Pinion Speed | $n$ | ~3785 rpm to ~5785 rpm |
4. Dynamic Response Characteristics and Fault Signatures
The dynamic response of the helical gear system under crack faults exhibits distinct patterns in both time and frequency domains, which serve as diagnostic features.
4.1 Time-Domain Signatures
The periodic drop in mesh stiffness caused by the cracked tooth acts as an internal excitation. Each time the faulty tooth enters the mesh, it generates an impulse-like response because the tooth deflects more under load due to its reduced stiffness.
- Periodic Impacts: The DTE and vibration velocity/acceleration signals show clear periodic冲击. The time interval between these冲击 equals the mesh period of the faulty gear ($T_c = 60/(z \times n)$), where $z$ is the number of teeth on the cracked gear and $n$ is its rotational speed in RPM.
- Amplitude Modulation: The amplitude of vibration increases during the faulty tooth’s engagement period. The severity of the冲击 amplitude increases with:
- Crack Length: Longer cracks cause larger stiffness drops and larger冲击.
- Load (Torque): Higher torque amplifies the force acting on the weakened tooth, leading to larger deflections and more pronounced冲击. Simulations show DTE and velocity peaks can double when torque increases significantly.
- Speed: Higher speeds can lead to stronger dynamic effects and potentially larger冲击 amplitudes, though the relationship can be complex due to resonances.
4.2 Frequency-Domain Signatures (Spectrum Analysis)
Transforming the time-domain signal to the frequency domain using the Fast Fourier Transform (FFT) reveals the most tell-tale signs of a localized fault like a crack.
- Sidebands around Mesh Frequency: The primary signature is the appearance of sidebands around the gear mesh frequency ($f_m = z \times f_r$, where $f_r$ is the rotational frequency of the cracked gear) and its harmonics. The periodic amplitude modulation caused by the fault creates these sidebands. Their spacing is equal to the rotational frequency ($f_r$) of the cracked gear.
- Fault Localization: The sidebands appear around the mesh frequency because the fault is on a gear, not a bearing. The specific rotational frequency ($f_r$) indicated by the sideband spacing identifies which gear in the train (pinion or gear) is faulty.
- Severity Indicator: The amplitude of the sidebands relative to the mesh frequency peak tends to increase with the severity (length/depth) of the crack. A root crack typically generates more prominent sidebands than a surface crack of comparable size due to its greater impact on stiffness.
| Domain | Feature | Description & Cause | Diagnostic Utility |
|---|---|---|---|
| Time Domain | Periodic Impulses/Shocks | Impacts occurring at the fault period ($T_c$). Caused by sudden stiffness change when cracked tooth meshes. | Indicates a localized fault. Period reveals faulty component. |
| Increased Vibration Amplitude | Peak DTE and velocity increase during faulty tooth engagement. | Correlates with fault severity and load. | |
| Frequency Domain | Sidebands around $f_m$ and harmonics | Spacing = $f_r$ (faulty gear’s rotational freq). Caused by amplitude modulation. | Confirms gear fault. Sideband spacing identifies the faulty gear. |
| Increased Sideband Amplitude | Amplitude grows with crack severity. More pronounced for root cracks. | Indicator of fault progression. |
The analysis consistently shows that for a helical gear pair, the dynamic manifestations of a root crack are more severe and diagnostically clearer than those of a comparable surface crack. This is a direct consequence of the more significant reduction in TVMS caused by a root crack.
5. Conclusion
This comprehensive analysis of the dynamic characteristics of a helical gear pair with crack faults leads to several critical conclusions for both understanding and diagnosing such failures:
- Stiffness Degradation is Fundamental: The primary effect of a tooth crack is the reduction of the local time-varying mesh stiffness. The degree of reduction is highly dependent on the crack’s location and size. For identical crack lengths, a root crack imposes a far more severe stiffness loss than a surface crack, making root cracks more critical.
- Dynamic Response is Modulated by Fault and Operational Parameters: The altered stiffness acts as a parametric excitation. The resulting dynamic transmission error and vibration signals exhibit periodic冲击 with an interval matching the mesh cycle of the faulty gear. The amplitude of these冲击 is amplified by increasing load (torque) and is generally more severe for longer cracks.
- Frequency-Domain Sidebands are Key Diagnostic Markers: The most reliable spectral signature of a gear crack is the appearance of sidebands around the mesh frequency and its harmonics. The sideband spacing corresponds to the rotational frequency of the cracked gear, enabling fault localization within the gear train. The prominence of these sidebands, especially for root cracks, provides an indicator of fault severity.
- Modeling as a Tool for Prediction and Understanding: The combined methodology of using the potential energy method (with crack geometry) and the slice method for helical gears provides an effective analytical framework for predicting TVMS. Coupling this with a torsional dynamics model allows for the simulation and study of vibration responses under various crack scenarios and operating conditions. This forms a theoretical basis for developing advanced condition monitoring algorithms for helical gear transmissions.
In essence, monitoring for the emergence and growth of sideband families around the mesh frequency, alongside observing periodic冲击 in time-domain signals, provides a robust approach for the early detection and diagnosis of crack faults in helical gear systems, thereby enhancing reliability and preventing unexpected downtime.