
Spur gear transmission systems are widely used in industrial machinery due to their high efficiency and stable transmission ratio. During operation, the dynamic characteristics of the gear pair directly affect the overall stability and safety of the equipment. With the trend toward higher operating speeds, the thermal deformation of the tooth profile caused by temperature rise has become increasingly significant. In this work, I focused on the influence of tooth profile thermal deformation on the dynamic behavior of spur gear systems. I developed a mathematical model for the thermal deformation of the tooth profile, established a nonlinear dynamic model of the spur gear transmission system considering this thermal deformation, and numerically solved the model to investigate the effects of various nonlinear factors and temperature variations. The research includes the construction of a flash temperature model for gear tooth surfaces under dry friction and mixed lubrication conditions based on Blok’s flash temperature theory and Hertz contact theory. Then, considering the gear meshing geometry and the non-uniform steady-state temperature field theory, I derived a calculation model for the tooth profile thermal deformation. Numerical simulations were carried out with MATLAB to analyze the friction coefficient, flash temperature, and tooth profile thermal deformation. The results show that the lubrication state and operating conditions strongly affect these values. With increasing rotational speed and torque, the friction coefficient, flash temperature, and thermal deformation all increase, and there is a strong positive correlation among them. I further incorporated the thermal deformation into the mathematical expressions of the backlash and time-varying mesh stiffness. Based on the traditional nonlinear dynamic model, I established a nonlinear dynamics model of the spur gear system with thermal deformation. The Runge–Kutta method was used to solve the model, and I obtained time history diagrams, phase diagrams, Poincaré maps, and bifurcation diagrams. Comparing the dynamic characteristics with and without thermal deformation, I analyzed the effects of excitation frequency, damping, and mesh stiffness amplitude. The results reveal that thermal deformation mainly affects the stability of the transmission system rather than its periodicity, while the excitation frequency, damping, and mesh stiffness amplitude have a greater influence on the periodic and bifurcation behavior. Finally, I conducted vibration experiments on a spur gear test rig at rotational speeds of 1000 rpm, 2000 rpm, and 3000 rpm. The experimental acceleration signals were compared with the simulation results of the torsional vibration model with and without thermal deformation. The comparison demonstrated that the model with thermal deformation agrees better with the experimental results, validating the accuracy of the proposed model for predicting the dynamic characteristics of spur gear systems.
1. Introduction
Spur gear pairs are among the most common components in mechanical transmission systems. Their dynamic behavior is critical for the performance of gearboxes, especially under high-speed and heavy-load conditions. In recent decades, researchers have developed numerous dynamic models to predict the vibration and noise of gear systems. These models usually incorporate nonlinear factors such as time-varying mesh stiffness, backlash, and transmission errors. However, most traditional models assume a constant temperature and neglect the thermal deformation of the tooth profile caused by frictional heating.
During the meshing process of a spur gear pair, sliding between tooth surfaces generates heat. The resulting temperature rise changes the tooth profile geometry. Since the material expands with temperature, the actual tooth profile deviates from the ideal involute curve. This deviation modifies the backlash and the mesh stiffness, thereby affecting the dynamic response of the system. The thermal deformation problem is more pronounced in high-speed applications where the flash temperature can be very high. Therefore, it is necessary to include the thermal deformation effect in the dynamic model of spur gear systems.
Previous studies on gear dynamics have considered many factors, including tooth wear, pitting, surface roughness, and lubrication. Some researchers have also investigated the flash temperature and its influence on scuffing. However, the coupling between thermal deformation and the nonlinear dynamic response of spur gears has not been fully explored. In this work, I aim to fill this gap by establishing a comprehensive dynamic model of a spur gear pair that considers the thermal deformation of the tooth profile. The model is based on the calculation of the flash temperature and the resulting tooth profile change. Then, I integrate this thermal deformation into the expressions for backlash and time-varying mesh stiffness. The dynamic equations are solved numerically, and the results are compared with experiments.
The main contributions of this research are as follows. First, I develop a tooth profile thermal deformation model for spur gear pairs under different lubrication states. Second, I propose a modified backlash and time-varying mesh stiffness model that includes the thermal deformation. Third, I establish a nonlinear torsional vibration model of a spur gear transmission system considering the thermal deformation. Fourth, I analyze the influence of key parameters on the system dynamics using bifurcation diagrams. Finally, I validate the model through vibration experiments on a spur gear test rig.
2. Calculation Model of Tooth Profile Thermal Deformation
2.1 Flash Temperature Model of Spur Gear Tooth Surfaces
The contact temperature of a spur gear tooth surface during meshing consists of the body temperature and the flash temperature. According to Blok’s flash temperature theory, the instantaneous flash temperature at the contact point can be expressed as:
$$ \Delta T_f = \frac{u f_m f_e |v_1 – v_2|}{B\left(\sqrt{g_1 \rho_1 c_1 v_1} + \sqrt{g_2 \rho_2 c_2 v_2}\right)} $$
where \(u\) is the temperature rise coefficient, \(f_m\) is the friction coefficient which depends on the lubrication condition, \(f_e\) is the normal load per unit tooth width, \(v_1\) and \(v_2\) are the tangential velocities of the driving and driven gear tooth surfaces, \(g_1\) and \(g_2\) are the thermal conductivities, \(\rho_1\) and \(\rho_2\) are the densities, \(c_1\) and \(c_2\) are the specific heats, and \(B\) is the half-width of the contact band.
For a spur gear pair, the tangential velocities can be calculated by:
$$ v_i(t) = \omega_i \left[ r_i \cos \alpha \left( \arccos \left( \frac{r_{bi}}{r_{ki}(t)} \right) \right) \right] \quad (i=1,2) $$
where \(i=1\) denotes the driving gear, \(i=2\) the driven gear, \(\omega_i\) is the angular velocity, \(r_i\) is the pitch radius, \(\alpha\) is the pressure angle, \(r_{bi}\) is the base radius, and \(r_{ki}(t)\) is the distance from the meshing point to the gear center. The distance \(r_{ki}(t)\) can be determined from the geometry of the gear meshing process.
The normal load per unit tooth width \(f_e\) depends on the meshing region. Since the contact ratio of a spur gear pair is usually between 1 and 2, there are single-tooth and double-tooth meshing regions. In the double-tooth region, the total load is shared by two pairs of teeth, so the load per tooth is smaller. This causes a sudden change in the flash temperature at the transition points.
The half-width of the contact band \(B(t)\) is obtained from Hertz contact theory:
$$ B(t) = \eta \sqrt{\frac{2 F_n (1-\mu^2)}{\pi b E} \frac{R_1(t) R_2(t)}{R_1(t) + R_2(t)}} $$
where \(\eta\) is a correction factor, \(\mu\) is the Poisson’s ratio, \(E\) is the elastic modulus, \(F_n\) is the normal load, \(b\) is the tooth width, and \(R_i(t) = r_{ki}(t) \sin(\alpha_t)\) is the curvature radius at the meshing point.
2.2 Friction Coefficient under Different Lubrication States
The friction coefficient of a spur gear pair is strongly affected by the lubrication condition. There are four typical lubrication states: dry friction, boundary lubrication, mixed lubrication, and elastohydrodynamic lubrication. In this work, I focus on dry friction and mixed lubrication states. For dry friction, the friction coefficient is usually taken as a constant between 0.1 and 0.5. For mixed lubrication, the friction coefficient can be calculated using the expression proposed by He et al.:
$$ \mu_m(t) = 0.127 \log_{10} \left[ \frac{29700 \eta_0 v_e(t)}{\sqrt{S_{av}} p_{ei}(t) v_s(t)} \right] \cdot \text{sign}\left( v_1(t) – v_2(t) \right) \cdot \left[ \frac{v_s(t)}{v_e(t)} \right]^{0.13} $$
where \(\eta_0\) is the dynamic viscosity of the lubricant, \(S_{av}\) is the average surface roughness, \(p_{ei}(t)\) is the normal load per unit width, \(v_e(t)\) is the entraining velocity, and \(v_s(t)\) is the sliding velocity.
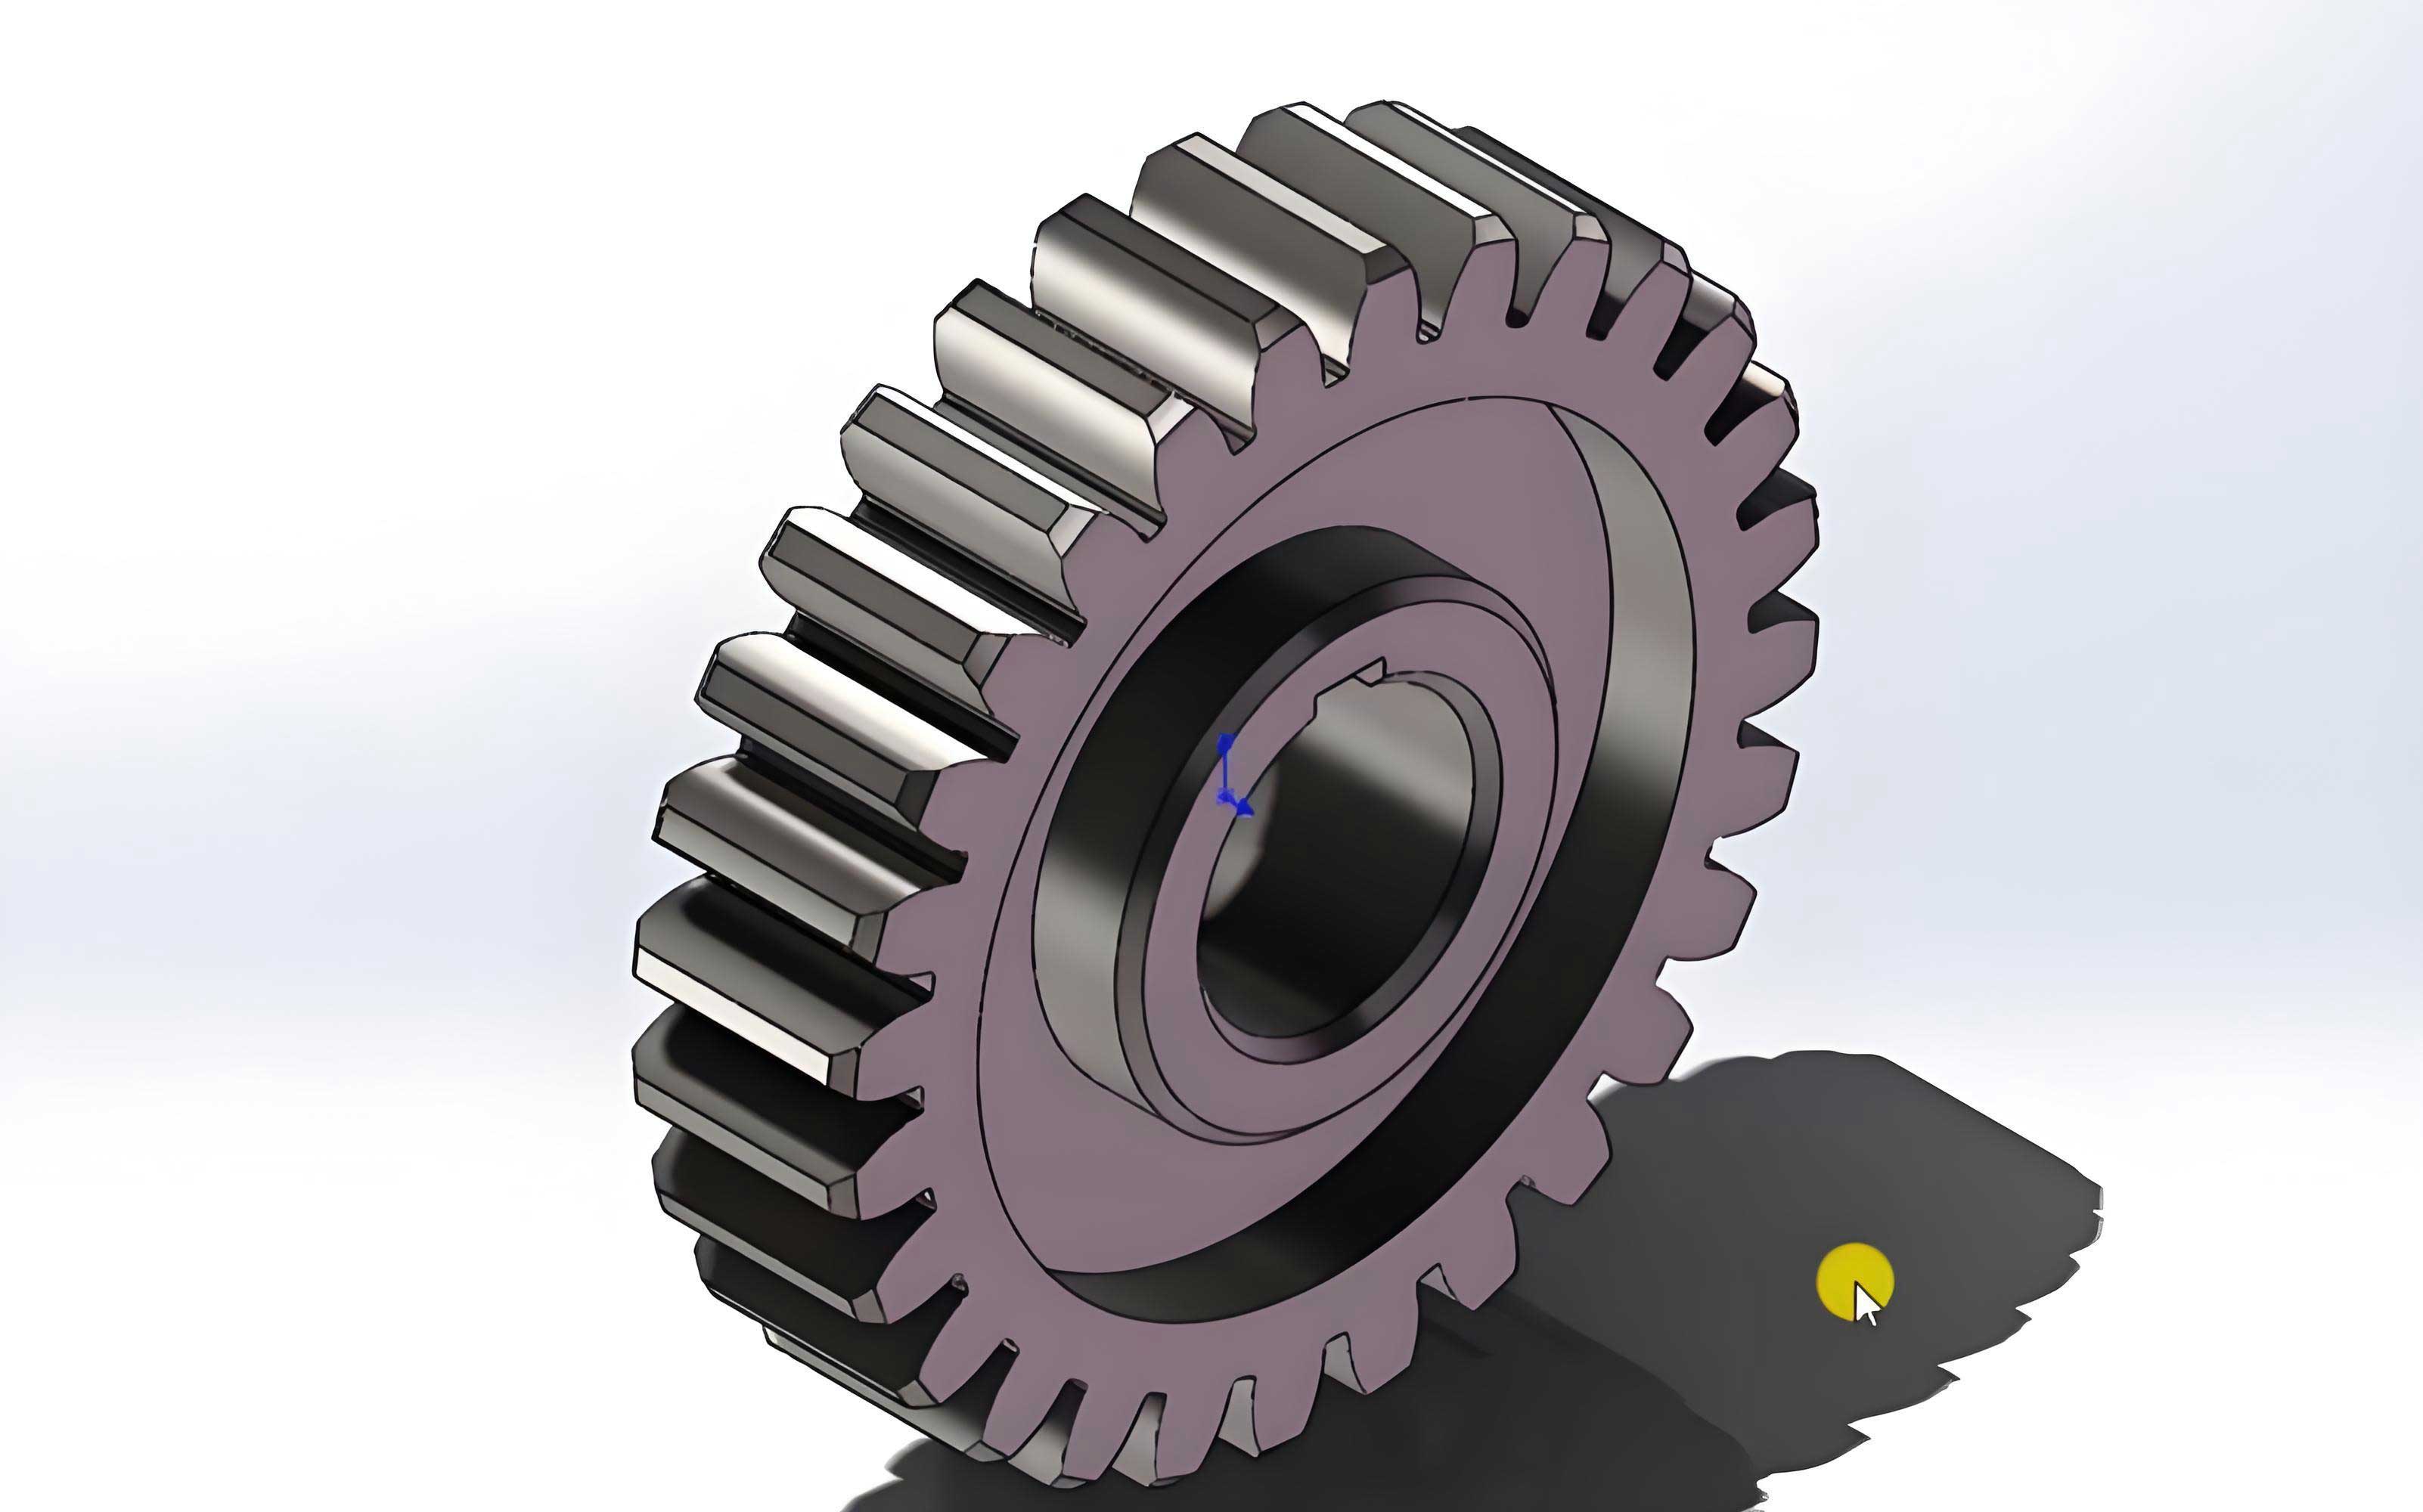
Using the friction coefficient model, the flash temperature can be computed for different lubrication conditions. Figure 1 shows a typical spur gear pair used in this study. The figure illustrates the geometry and the meshing process of a spur gear pair.
2.3 Tooth Profile Thermal Deformation Model
The temperature rise in a spur gear tooth causes thermal deformation. The total deformation consists of two parts: the deformation of the base circle and the deformation of the tooth. The base circle deformation can be calculated using the theory of thermal elasticity:
$$ u_b(r_x) = \lambda \frac{1+\mu}{1-\mu} \frac{1}{r_x} \int_{r_b}^{r_x} T(r) r \, dr + \lambda \frac{1-3\mu}{1-\mu} \frac{1-\mu}{1-\mu} r_x T(r_x) – \lambda r_x T(r_b) $$
where \(\lambda\) is the coefficient of linear expansion, \(\mu\) is the Poisson’s ratio, \(T(r_b)\) and \(T(r_x)\) are the temperatures at the base circle and the shaft, respectively.
For the tooth deformation, I consider both radial and circumferential components. The actual tooth profile after thermal deformation can be described by a modified involute equation. According to the non-uniform steady-state temperature field theory, the temperature distribution along the radial direction is:
$$ T(r_i) = T(r_x) + \frac{T(r_a) – T(r_x)}{\ln(r_a) – \ln(r_x)} \left[ \ln(r_i) – \ln(r_x) \right] $$
where \(r_a\) is the radius of the tooth tip and \(T(r_a)\) is the temperature at the tooth tip.
Based on this temperature distribution and the geometric relationship between the actual and theoretical tooth profiles, I derived the following formula for the tooth profile thermal deformation \(\Delta f\):
$$ \Delta f = \frac{\lambda}{\cos \alpha_k} \left\{ T(r_k) – T_0 \right\} \cdot \frac{2 \cos \alpha_k}{r_k^2} \left[ s r_k – r_k^2 (\mathrm{inv}\,\alpha_k – \mathrm{inv}\,\alpha) \right] \cdot \frac{1}{2} \left[ \frac{r_b}{r_k} + 1 \right] \Delta l $$
To simplify the derivation, I used the fact that the angle change \(\Delta \theta_k\) is very small, so the displacement along the tooth profile can be approximated as:
$$ \Delta f = \Delta l \cos \alpha_k $$
where \(\Delta l\) is the arc length corresponding to the angular deformation \(\Delta \theta_k\). The final expression of the tooth profile thermal deformation is:
$$ \Delta f = \frac{\lambda}{2} \left[ T(r_k) – T_0 \right] \left[ 1 + \frac{\ln(r_k) – \ln(r_b)}{\ln(r_a) – \ln(r_b)} \right] \left[ s_k – r_k (\mathrm{inv}\,\alpha_k – \mathrm{inv}\,\alpha) \right] $$
This equation accounts for the non-uniform temperature field and the varying tooth thickness along the profile. The tooth thickness \(s_k\) at the meshing point is calculated as:
$$ s_k = s \frac{r_k}{r} – r_k \left[ \mathrm{inv}\,\alpha_k – \mathrm{inv}\,\alpha \right] $$
where \(s\) is the tooth thickness at the pitch circle, \(r\) is the pitch radius, and \(\mathrm{inv}\,\alpha = \tan \alpha – \alpha\).
2.4 Numerical Simulation of Friction, Flash Temperature, and Thermal Deformation
I performed numerical simulations to study the variation of the friction coefficient, flash temperature, and tooth profile thermal deformation over a single meshing period. The basic parameters of the spur gear pair are listed in Table 1.
| Parameter | Driving gear | Driven gear |
|---|---|---|
| Module \(m\) (mm) | 5 | 5 |
| Number of teeth | 21 | 26 |
| Pressure angle \(\alpha\) (°) | 20 | 20 |
| Tooth width \(b\) (mm) | 30 | 30 |
| Elastic modulus \(E\) (GPa) | 163 | 211 |
| Poisson’s ratio \(\mu\) | 0.277 | 0.3 |
| Density \(\rho\) (kg/m³) | 8900 | 7820 |
| Thermal conductivity \(g\) (J/(s·K)) | 22 | 32 |
| Coefficient of linear expansion \(\lambda\) (1/K) | 1.52×10⁻⁵ | 1.3×10⁻⁵ |
| Specific heat \(c\) (J/(kg·K)) | 420 | 550 |
| Surface roughness \(S\) (μm) | 1.6 | 1.6 |
| Shaft diameter (mm) | 20 | 20 |
The initial operating condition is \(n=1080\) rpm and \(T=8\) N·m. Figure 2 shows the variation of the friction coefficient under dry friction and mixed lubrication conditions over one meshing cycle. The dry friction coefficient is constant, taken as 0.2 in this simulation. The mixed lubrication friction coefficient changes sign at the pitch point due to the reversal of the sliding velocity. There are also jumps at the transition points between double-tooth and single-tooth meshing regions.
Figure 3 shows the flash temperature under the two lubrication states. The flash temperature reaches its maximum at the beginning of engagement and its minimum at the pitch point. The dry friction state gives a much higher flash temperature because of the larger friction coefficient. The jumps correspond to the sudden change in the load sharing ratio.
Figure 4 shows the tooth profile thermal deformation for the same operating conditions. The trend is very similar to the flash temperature, which indicates a strong linear correlation between them. When the input torque increases from 8 N·m to 20 N·m, the thermal deformation increases. Similarly, when the rotational speed increases from 1080 rpm to 1800 rpm, the thermal deformation also increases.
3. Dynamic Model of Spur Gear System with Thermal Deformation
3.1 Internal Excitations of the Spur Gear System
The internal excitations of a spur gear system mainly include the time-varying mesh stiffness, the transmission error, and the meshing impact. The time-varying mesh stiffness can be approximated by a Fourier series. In this work I take the first harmonic component:
$$ k(t) = k_0 + k_1 \cos(\omega_h t + \varphi_h) $$
where \(k_0\) is the average mesh stiffness, \(k_1\) is the stiffness fluctuation amplitude, and \(\omega_h\) is the meshing frequency.
The transmission error can also be approximated similarly:
$$ e(t) = e_0 + e_1 \sin(\omega_h t + \varphi_e) $$
where \(e_0\) is the mean error and \(e_1\) is the fluctuating amplitude.
3.2 Effect of Thermal Deformation on Backlash
The backlash of a spur gear pair is a piecewise linear function. In the traditional model, the half-backlash is denoted by \(b\). When the tooth profile is deformed by heat, the actual backlash decreases because the tooth expands. The modified half-backlash becomes:
$$ b’ = b – \frac{\Delta f_1 + \Delta f_2}{2} $$
where \(\Delta f_1\) and \(\Delta f_2\) are the thermal deformations of the driving and driven gear tooth profiles, respectively. The backlash function is then:
$$ f(x’) = \begin{cases} x’ – b’, & x’ > b’ \\ 0, & -b’ \le x’ \le b’ \\ x’ + b’, & x’ < -b’ \end{cases} $$
3.3 Effect of Thermal Deformation on Time-Varying Mesh Stiffness
The time-varying mesh stiffness of a spur gear pair can be obtained by the potential energy method. The total potential energy includes the Hertzian contact energy, bending energy, shear energy, radial compression energy, and gear body deformation energy. The stiffness components are expressed as:
$$ k_h = \frac{\pi E b}{4(1-\mu^2)} $$
$$ k_b = \int_{0}^{l} \frac{3 \left[ \cos \beta (l – x) – h \sin \beta \right]^2}{2 b E h_x^3} \, dx $$
$$ k_s = \int_{0}^{l} \frac{1.2 \cos^2 \beta}{2 b G h_x} \, dx $$
$$ k_a = \int_{0}^{l} \frac{\sin^2 \beta}{2 b E h_x} \, dx $$
$$ k_f = \frac{E b}{\cos^2 \beta \left[ L^* \left( \frac{u_f}{S_f} \right)^2 + M^* \left( \frac{u_f}{S_f} \right) + P^* (1 + Q^* \tan^2 \beta) \right]} $$
The total mesh stiffness for a single tooth pair is:
$$ k_e(t) = \frac{1}{\frac{1}{k_h} + \frac{1}{k_{b1}} + \frac{1}{k_{s1}} + \frac{1}{k_{a1}} + \frac{1}{k_{f1}} + \frac{1}{k_{b2}} + \frac{1}{k_{s2}} + \frac{1}{k_{a2}} + \frac{1}{k_{f2}}} $$
For double-tooth engagement, the total stiffness is the sum of the two tooth pairs.
The thermal deformation changes the contact geometry and hence the stiffness. I define the stiffness variation due to temperature as:
$$ k_T(t) = \frac{k_{T1}(t) k_{T2}(t)}{k_{T1}(t) + k_{T2}(t)} $$
where \(k_{Ti}(t) = F_n / \Delta f_i\). Then the total mesh stiffness considering thermal deformation is:
$$ k_{total}(t) = k_e(t) + k_T(t) $$
In the numerical simulation, I found that the average mesh stiffness is \(4.875 \times 10^8\) N/m and the stiffness fluctuation amplitude is \(2.75 \times 10^8\) N/m when the thermal deformation is included. Thus, the time-varying mesh stiffness can be expressed as:
$$ k(t) = 4.875 \times 10^8 + 2.75 \times 10^8 \cos(\omega_h t + \varphi_h) $$
3.4 Nonlinear Torsional Vibration Model
Using the concentrated mass method, I established a two-degree-of-freedom torsional vibration model of a spur gear pair. The dynamic equations are:
$$ I_1 \ddot{\theta}_1 + c_m r_{b1} \left( r_{b1} \dot{\theta}_1 – r_{b2} \dot{\theta}_2 – \dot{e}(t) \right) + k_{total}(t) f\left( r_{b1} \theta_1 – r_{b2} \theta_2 – e(t) \right) = T_1 $$
$$ I_2 \ddot{\theta}_2 – c_m r_{b2} \left( r_{b1} \dot{\theta}_1 – r_{b2} \dot{\theta}_2 – \dot{e}(t) \right) – k_{total}(t) f\left( r_{b1} \theta_1 – r_{b2} \theta_2 – e(t) \right) = -T_2 $$
where \(I_1\) and \(I_2\) are the moments of inertia, \(\theta_1\) and \(\theta_2\) are the angular displacements, \(c_m\) is the meshing damping, and \(T_1\), \(T_2\) are the input and output torques. Let \(q(t) = r_{b1}\theta_1 – r_{b2}\theta_2 – e(t)\) be the relative displacement along the line of action. Combining the two equations gives:
$$ m_e \ddot{q}(t) + c_m \dot{q}(t) + k_{total}(t) f(q) = F_m $$
where \(m_e\) is the equivalent mass:
$$ m_e = \frac{I_1 I_2}{I_1 r_{b2}^2 + I_2 r_{b1}^2} $$
and \(F_m\) is the equivalent external excitation:
$$ F_m = \frac{I_2 r_{b1} T_1 + I_1 r_{b2} T_2}{I_1 r_{b2}^2 + I_2 r_{b1}^2} $$
To facilitate numerical analysis, I introduced the dimensionless time \(\tau = \omega_n t\) and the dimensionless displacement \(x = q/b’\), where \(b’\) is the half-backlash after thermal deformation. The dimensionless equation is:
$$ \ddot{x} + 2\zeta \dot{x} + \left( 1 + \varepsilon \cos(\Omega \tau) + \varepsilon_T \cos(\Omega \tau) \right) f(x) = F_m^* + F_h^* \cos(\Omega \tau) $$
where \(\zeta\) is the dimensionless damping ratio, \(\Omega = \omega_h / \omega_n\) is the dimensionless excitation frequency, \(\varepsilon\) is the dimensionless mesh stiffness fluctuation amplitude, \(\varepsilon_T\) is the additional amplitude caused by thermal deformation, and \(F_m^*\), \(F_h^*\) are the dimensionless external and internal excitations.
4. Dynamic Characteristics Simulation Analysis
4.1 Dynamic Response without Thermal Deformation
I first solved the dynamic model using the parameters \(\zeta = 0.18\), \(\Omega = 1\), and \(\varepsilon = 0.1\), without considering thermal deformation. The time history, phase portrait, Poincaré map, and frequency spectrum indicate that the system is in a stable single-periodic motion. The phase portrait is a closed ellipse, and the Poincaré points are concentrated in a small region. The frequency spectrum shows only a 1× component.
4.2 Dynamic Response with Thermal Deformation
Next, I included the thermal deformation effect. The body temperatures were set to 100°C, 130°C, and 160°C. The simulation results are summarized in Table 2.
| Temperature | Time history | Phase portrait | Poincaré map | Frequency spectrum | Motion state |
|---|---|---|---|---|---|
| 100°C | Some fluctuation | Slightly dispersed | Wider distribution | 1/2× and 1× components | Quasi-periodic |
| 130°C | More fluctuation | Further dispersed | More scattered | Increased 1/2× component | Quasi-periodic |
| 160°C | Significant fluctuation | Two apparent loops | Clearly separated points | Strong 1/2× component | Unstable quasi-periodic |
It is evident that the thermal deformation reduces the stability of the spur gear system. As the temperature rises, the system becomes less stable even though the periodicity remains similar.
4.3 Influence of Meshing Damping
I then varied the dimensionless damping \(\zeta\) while keeping \(\Omega=1\), \(\varepsilon=0.1\), and the body temperature at 160°C. The results for \(\zeta = 0.17\), 0.14, and 0.1 are given in Table 3.
| \(\zeta\) | Motion state | Stability |
|---|---|---|
| 0.17 | Unclear double-periodic | Moderate |
| 0.14 | Clear double-periodic | Relatively stable |
| 0.1 | Double-periodic | Less stable |
Decreasing the damping causes the system to transition from single-periodic to multi-periodic motion and worsens the stability.
4.4 Influence of Excitation Frequency
Similarly, I changed the dimensionless excitation frequency \(\Omega\) while keeping \(\zeta=0.18\), \(\varepsilon=0.1\), and a body temperature of 160°C. Table 4 shows the corresponding dynamic responses.
| \(\Omega\) | Time history | Phase portrait | Frequency spectrum | Motion state |
|---|---|---|---|---|
| 1.1 | Clear fluctuation | Two separated regions | 1/2× and 1× | Unstable double-periodic |
| 1.2 | Less fluctuation | Two dense loops | Reduced amplitudes | Stable double-periodic |
| 1.3 | Fluctuation again | One broad loop | Further reduced amplitudes | Quasi-double-periodic |
4.5 Influence of Mesh Stiffness Amplitude
The dimensionless mesh stiffness amplitude \(\varepsilon\) also affects the system response. With \(\zeta=0.2\), \(\Omega=1\), and 160°C, I obtained the results in Table 5.
| \(\varepsilon\) | Motion state | Description |
|---|---|---|
| 0.1 | Single-periodic | Stable, closed phase trajectory |
| 0.5 | Double-periodic | Two closed loops, dense points |
| 0.9 | Quasi-double-periodic | Scattered points, additional frequencies |
4.6 Bifurcation Analysis
To study the global behavior of the spur gear system, I plotted bifurcation diagrams with respect to \(\zeta\), \(\Omega\), and \(\varepsilon\) for different temperatures. The results are summarized in Table 6.
| Parameter | Without thermal deformation | With thermal deformation |
|---|---|---|
| \(\zeta\) decreasing from 0.2 | Single → double → four → quasi-four → chaos | Single → double → quasi-four → chaos (more scattered) |
| \(\Omega\) increasing from 1 to 2 | Double → single (at ~1.31) | Double → single (at ~1.4) |
| \(\varepsilon\) increasing from 0 to 1 | Single → double (at ~0.3), jump at ~0.54, four (at ~0.7) | Single → double (at ~0.35), jump at ~0.55, four (at ~0.85) |
The thermal deformation mainly increases the scatter of points in the bifurcation diagrams, indicating lower stability, but it does not fundamentally change the bifurcation patterns.
5. Experimental Verification
5.1 Test Rig and Instrumentation
I built a spur gear vibration test rig to validate the proposed model. The test rig consists of a three-phase asynchronous motor, a gearbox with a spur gear pair, a magnetic powder brake, a speed controller, and a data acquisition system. The acceleration signals were measured with a tri-axial accelerometer and processed using the DHDAS dynamic signal acquisition system. A FIR filter was applied to remove noise from the measured signals.
The spur gear pair in the experiment has a module of 5 mm, a pressure angle of 20°, and tooth numbers of 25 and 75. The gear material is steel with an elastic modulus of 205 GPa and a Poisson’s ratio of 0.3. The operating speeds are 1000 rpm, 2000 rpm, and 3000 rpm.
5.2 Signal Processing and Comparison
The measured acceleration signals were numerically integrated twice to obtain the displacement signals. Then the frequency spectra were computed. The experimental results were compared with the simulation results from the dynamic model with and without thermal deformation. The measured body temperatures at different speeds are listed in Table 7.
| Speed (rpm) | Shaft temperature (°C) | Gear body temperature (°C) |
|---|---|---|
| 1000 | 25.3 | 35.6 |
| 2000 | 27.2 | 41.7 |
| 3000 | 33.4 | 48.8 |
Figure 5 shows the displacement frequency spectra from the experiment and simulations at 1000 rpm. The dominant frequency in the experiment is 419.7 Hz with a displacement amplitude of 10.4 μm. The simulation with thermal deformation gives 413 Hz and 8.7 μm, while the simulation without thermal deformation gives 411 Hz and 8.17 μm. All are close to the meshing frequency of 416.7 Hz.
At 2000 rpm, the experimental dominant frequency is 832.58 Hz with 19.3 μm, the model with thermal deformation gives 826 Hz and 15.9 μm, and the model without thermal deformation gives 823 Hz and 15.15 μm. The meshing frequency is 833.3 Hz.
At 3000 rpm, the experimental dominant frequency is 1251.6 Hz with 48.5 μm, the model with thermal deformation gives 1248 Hz and 41 μm, and the model without thermal deformation gives 1245 Hz and 39.6 μm.
The frequency and displacement errors are summarized in Table 8.
| Speed (rpm) | Case | Frequency error (%) | Displacement error (%) |
|---|---|---|---|
| 1000 | With thermal deformation | 1.60 | 16.3 |
| Without thermal deformation | 2.07 | 21.4 | |
| 2000 | With thermal deformation | 0.79 | 17.6 |
| Without thermal deformation | 1.15 | 18.5 | |
| 3000 | With thermal deformation | 0.29 | 15.4 |
| Without thermal deformation | 0.53 | 18.4 |
The model including the tooth profile thermal deformation yields smaller errors and better agreement with the experimental data. This confirms that the thermal deformation effect should not be neglected in the dynamic analysis of spur gear systems.
6. Conclusion and Outlook
In this work, I studied the dynamic behavior of spur gear transmission systems considering the thermal deformation of the tooth profile. The main conclusions are as follows:
- The mixed lubrication friction coefficient of a spur gear pair changes sign at the pitch point and has jumps at the transitions between single- and double-tooth engagement. The first temperature, flash temperature, and tooth profile thermal deformation all increase with increasing speed and torque.
- The tooth profile thermal deformation of a spur gear pair strongly affects the system stability. In the temperature range considered, the system changes from stable single-periodic motion to unstable quasi-periodic motion as the temperature increases.
- The meshing damping, excitation frequency, and mesh stiffness amplitude mainly determine the periodicity and bifurcation behavior of the spur gear system. Thermal deformation primarily affects the scatter of the response and reduces the stability.
- The vibration experiments at different speeds show that the dynamic model with thermal deformation predicts the dominant frequency and vibration amplitude more accurately than the model without thermal deformation.
There are some limitations in this work. I only considered dry friction and mixed lubrication states; boundary and elastohydrodynamic lubrication states were not included. The dynamic model is a torsional vibration model with two degrees of freedom; it does not account for lateral motion, bearing flexibility, or friction forces. In future work, I plan to develop a multi-degree-of-freedom spur gear dynamic model that incorporates the thermal deformation and more realistic lubrication conditions.
Overall, this research provides a new insight into the influence of tooth profile thermal deformation on the dynamic characteristics of spur gear systems and offers a reference for the design and condition monitoring of gear transmissions.