
The analysis and calculation of mesh stiffness form the cornerstone of dynamic studies for gear transmission systems. Helical gears are pivotal components in powertrains across critical industries such as automotive and aerospace, prized for their smooth operation, high efficiency, and precise transmission ratios. The time-varying mesh stiffness (TVMS) is a primary internal excitation parameter that significantly influences the vibration and noise characteristics of these systems. Consequently, accurately predicting the TVMS is of paramount importance for the design and optimization of quiet and reliable gear drives. In practical applications, manufacturing and assembly tolerances in gearbox housings inevitably lead to installation errors in the gear pair post-assembly. These errors, which include axis intersection angle deviation, axis skew angle deviation, and center distance deviation, alter the contact pattern and load distribution along the tooth flank. This modification directly impacts the tooth deflection and, therefore, the effective mesh stiffness, deviating from the ideal design condition. While previous research has extensively studied the mesh stiffness of ideal gears or those with manufacturing errors like profile and lead deviations, a systematic investigation into the influence of assembly-induced axis misalignments on the mesh stiffness of helical gears remains less explored. This work aims to address this gap by developing a parameterized finite element model capable of simulating various installation error states, performing a quasi-static analysis to extract the TVMS, and quantitatively analyzing the impact and coupling effects of different error types on mesh stiffness behavior.
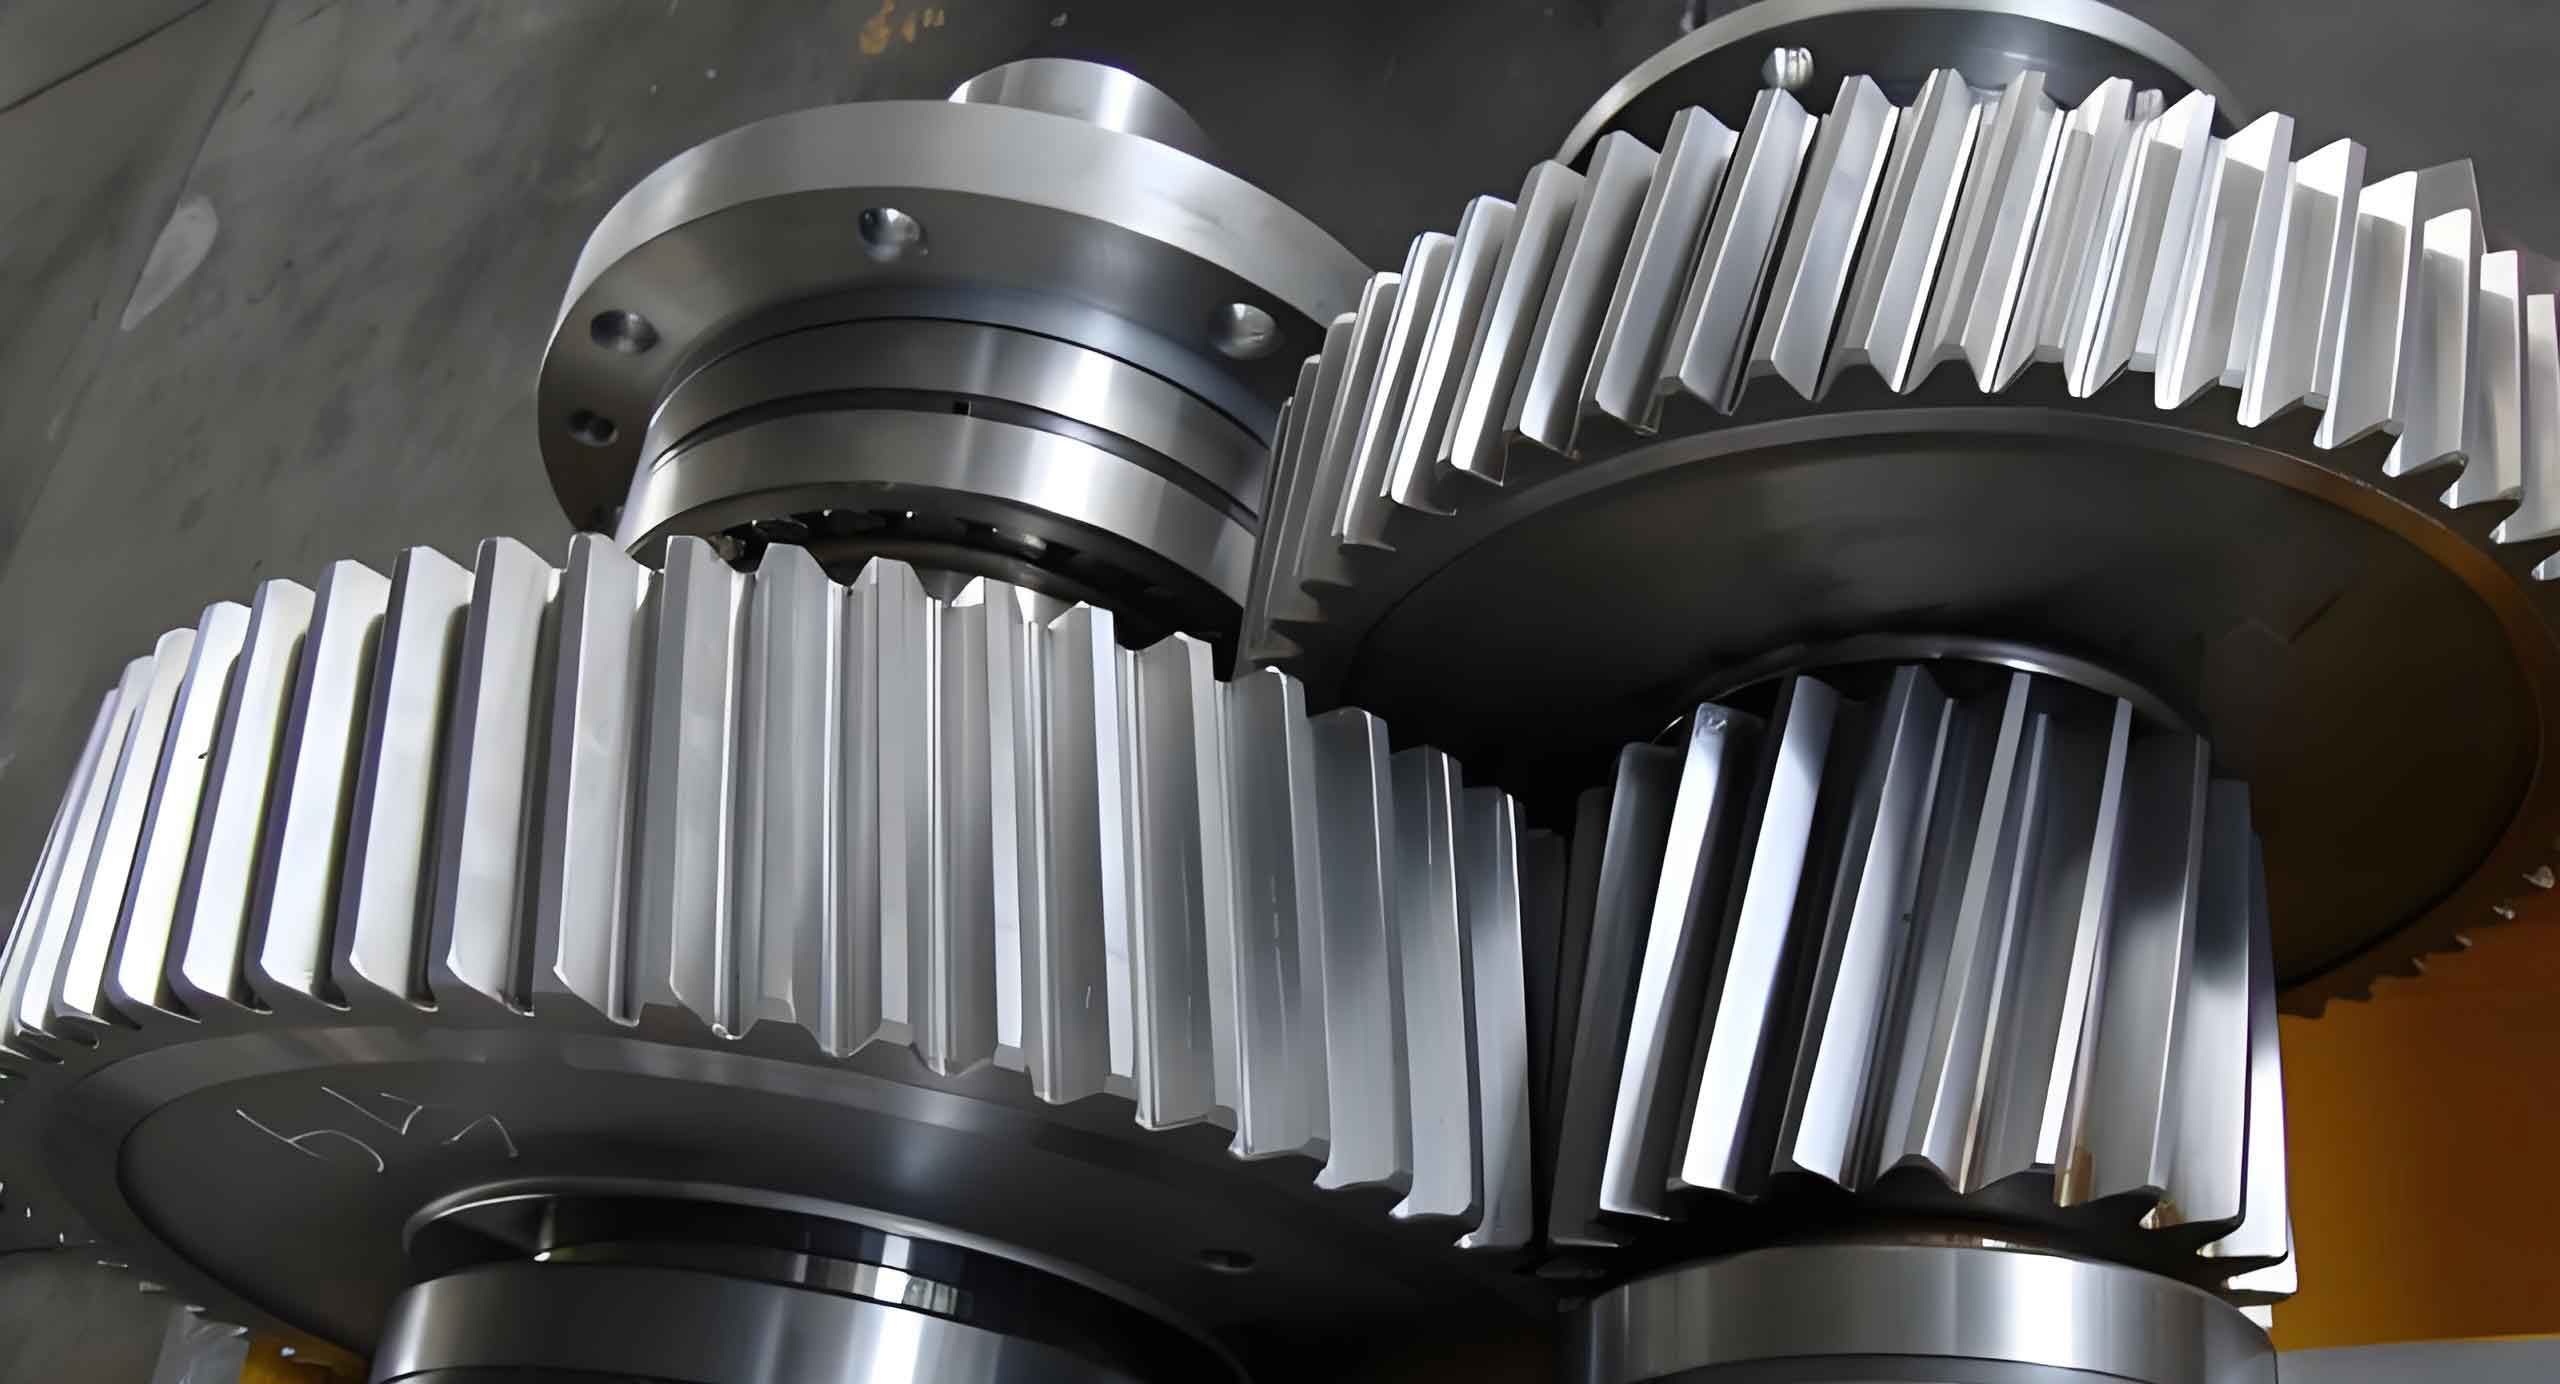
Theoretical Foundation: Installation Errors and Mesh Stiffness
The relative position of two mating helical gears is defined within a coordinate system framework. Let a global coordinate system \(S(O-xyz)\) be fixed in space. The driving gear (Gear 1) is attached to coordinate system \(S_1(O_1-x_1y_1z_1)\), which can rotate about the \(z_1\)-axis. Similarly, the driven gear (Gear 2) is attached to \(S_2(O_2-x_2y_2z_2)\), rotating about its \(z_2\)-axis. An auxiliary coordinate system \(S_p(O_p-x_py_pz_p)\) is used to define the relative position of the driven gear’s axis. The angular positions of the gears are defined by \(\phi_1\) (rotation of \(S_1\) relative to \(S\) about \(z\)) and \(\phi_2\) (rotation of \(S_2\) relative to \(S_p\) about \(z_p\)).
Installation errors are introduced as small deviations from the ideal positional relationship between the gear axes. These are defined as translations \((u_x, u_y, u_z)\) and rotations \((r_x, r_y, r_z)\) from system \(S\) to system \(S_p\). For an ideal meshing condition (no installation error), we have \(r_x = r_y = r_z = 0\), \(u_x = u_z = 0\), and \(u_y = -a\), where \(a\) is the standard center distance. The primary installation errors studied are:
- Axis Skew (or Parallelism) Error, \(r_x\): A rotational deviation in the plane containing the axes’ common perpendicular (often related to “B-plane” misalignment).
- Axis Intersection (or Angularity) Error, \(r_y\): A rotational deviation in the plane perpendicular to the common perpendicular (often related to “A-plane” misalignment).
- Center Distance Error, \(\Delta u_y\): A linear deviation along the \(y\)-axis, where \(u_y = -a + \Delta u_y\).
The transformation matrices between these coordinate systems are derived using homogeneous coordinate transformation theory. The matrix from \(S_1\) to \(S\) is a simple rotation about the z-axis:
$$T_{o1} = \begin{bmatrix}
\cos \phi_1 & -\sin \phi_1 & 0 & 0\\
\sin \phi_1 & \cos \phi_1 & 0 & 0\\
0 & 0 & 1 & 0\\
0 & 0 & 0 & 1
\end{bmatrix}$$
The matrix from \(S_2\) to \(S_p\) is analogous:
$$T_{p2} = \begin{bmatrix}
\cos \phi_2 & -\sin \phi_2 & 0 & 0\\
\sin \phi_2 & \cos \phi_2 & 0 & 0\\
0 & 0 & 1 & 0\\
0 & 0 & 0 & 1
\end{bmatrix}$$
The comprehensive transformation from \(S_p\) to \(S\), incorporating all installation errors, is given by:
$$T_{op} = \begin{bmatrix}
\cos r_y \cos r_z & \cos r_z \sin r_x \sin r_y – \sin r_z \cos r_x & \cos r_z \sin r_y \cos r_x + \sin r_x \sin r_z & u_x\\
\sin r_z \cos r_y & \sin r_z \sin r_x \sin r_y + \cos r_x \cos r_z & \sin r_z \sin r_y \cos r_x – \sin r_x \cos r_z & u_y\\
-\sin r_y & \sin r_x \cos r_y & \cos r_y \cos r_x & u_z\\
0 & 0 & 0 & 1
\end{bmatrix}$$
The center distance error \(\Delta u_y\) primarily introduces backlash but does not alter the fundamental line contact pattern of a perfect helical gear pair. In contrast, angular errors \(r_x\) and \(r_y\) significantly modify the contact geometry. Based on tooth contact analysis (TCA) principles, the presence of axis misalignments transforms the theoretical line contact into a localized point contact, drastically affecting load distribution and contact stresses, which in turn influences the composite mesh stiffness.
The mesh stiffness \(k_m\) of a gear pair is conventionally defined as the ratio of the applied normal load \(F_n\) to the total deflection along the line of action \(\delta_n\):
$$k_m = \frac{F_n}{\delta_n}$$
For a model neglecting transmission error from micro-geometry, the total deflection \(\delta_n\) comprises several components experienced by the contacting tooth pairs:
$$\delta_n = \sum_{i=1}^{p} \delta_{h,i} + \sum_{i=1}^{p} \delta_{b,i} + \sum_{i=1}^{p} \delta_{s,i} + \sum_{i=1}^{p} \delta_{r,i}$$
Where:
- \(\delta_{h,i}\): Hertzian contact deformation of the \(i^{th}\) tooth pair.
- \(\delta_{b,i}\): Bending deflection contribution at the contact point for the \(i^{th}\) tooth.
- \(\delta_{s,i}\): Shear deflection contribution.
- \(\delta_{r,i}\): Deflection contribution from the gear body and rim for the \(i^{th}\) tooth.
- \(p\): Number of tooth pairs in simultaneous contact (contact ratio).
The stiffness of the driving and driven gears are considered to be in series. Therefore, the total mesh stiffness \(k_{total}\) for a single tooth pair in contact is calculated as:
$$\frac{1}{k_{total}} = \frac{1}{k_{gear1}} + \frac{1}{k_{gear2}}$$
For multiple tooth pairs, the total stiffness is the sum of the individual pair stiffnesses at their respective contact positions.
Finite Element Modeling and Analysis Methodology
To accurately model the complex geometry and contact behavior of a helical gear pair with installation errors, a precise parametric finite element model was developed. The basic parameters of the example transmission helical gear pair used in this study are listed in the table below:
| Parameter | Gear 1 (Pinion) | Gear 2 (Wheel) |
|---|---|---|
| Number of Teeth, \(z\) | 28 | 35 |
| Normal Module, \(m_n\) (mm) | 4 | 4 |
| Normal Pressure Angle, \(\alpha_n\) (°) | 23 | 23 |
| Helix Angle, \(\beta\) (°) | 24 | 24 |
| Face Width, \(b\) (mm) | 10 | 10 |
| Addendum Coefficient | 1.0 | 1.0 |
| Dedendum Coefficient | 1.25 | 1.25 |
| Profile Shift Coefficient | 0 | 0 |
| Young’s Modulus, \(E\) (GPa) | 207 | 207 |
| Poisson’s Ratio, \(\nu\) | 0.3 | 0.3 |
Instead of relying on external CAD software, the exact tooth profile was generated programmatically within the FE preprocessor. Coordinates for the involute curve and the trochoidal fillet were calculated based on gear geometry equations. These coordinates were then used to construct spline curves, creating a highly accurate 3D model of a helical tooth segment. A sector model containing five teeth from each gear was created to balance computational efficiency and accuracy, minimizing boundary effects from the gear body while capturing the multi-tooth contact phenomenon. The installation errors (\(r_x\), \(r_y\), \(\Delta u_y\)) were implemented as parameters using the transformation matrix \(T_{op}\), allowing for the automated generation of FE models with various misalignment conditions. The model was meshed with high-order solid elements, and a refined mesh was applied in the potential contact regions to capture stress gradients accurately.
Surface-to-surface contact pairs were established between the active flanks of the mating gears. CONTA174 and TARGE170 elements were used for the contact and target surfaces, respectively. The augmented Lagrangian method was employed for contact resolution. Boundary conditions were applied to simulate a quasi-static torque transmission: All degrees of freedom (DOFs) of the nodes on the inner cylindrical surface of the driven gear (Gear 2) were fully constrained. For the driving gear (Gear 1), radial and axial DOFs on its inner surface were constrained, while a tangential force was applied to these nodes to simulate the input torque \(T\). The force per node \(F_{node}\) was calculated as:
$$F_{node} = \frac{T}{R \cdot N}$$
where \(R\) is the inner radius of the gear bore and \(N\) is the number of nodes on the constrained surface.
To validate the accuracy of the FE model, including contact definition and boundary conditions, the maximum contact stress from the FE simulation was compared against the theoretical Hertzian contact stress for the ideal gear pair under the same load. The maximum Hertzian pressure \(\sigma_{Hmax}\) for two parallel cylinders (approximating line contact) is given by:
$$\sigma_{Hmax} = \sqrt{ \frac{F}{L \pi} \cdot \frac{\frac{1}{R_1} + \frac{1}{R_2}}{\frac{1-\nu_1^2}{E_1} + \frac{1-\nu_2^2}{E_2}} }$$
where \(F/L\) is the load per unit face width, and \(R_1, R_2\) are the equivalent radii of curvature at the contact point. The comparison across a range of torques (e.g., 100 Nm to 1000 Nm) showed excellent agreement, with deviations within 5-6%, confirming the fidelity of the FE approach for subsequent stiffness analysis.
Results and Analysis: The Impact of Installation Errors
1. Stiffness Reduction Under Individual Errors
The mesh stiffness at a fixed meshing position (near the pitch point) was computed for various magnitudes of individual installation errors. The base case was the ideal meshing condition with no errors under a nominal load of 600 Nm. The results are summarized qualitatively in the table below, showing the trend and severity of impact.
| Error Type | Typical Value | Effect on Mesh Stiffness | Severity | Primary Reason |
|---|---|---|---|---|
| Center Distance Error (\(\Delta u_y\)) | ±0.025 mm | Minor decrease/increase | Low | Introduces backlash, slight change in load sharing and pressure angle. |
| Axis Intersection Error (\(r_y\)) | ±5 arc-min | Significant decrease | High | Changes contact from line to point, increasing local deflection. |
| Axis Skew Error (\(r_x\)) | ±5 arc-min | Very Significant decrease | Highest | Changes contact from line to point, often leads to edge contact, most detrimental. |
The angular errors (\(r_x\) and \(r_y\)) cause a pronounced reduction in mesh stiffness because they disrupt the ideal line contact. The load, which is ideally distributed along a line across the face width, becomes concentrated on a much smaller elliptical contact area. This localized contact results in significantly higher contact pressures and deformations (\(\delta_h\)), and also alters the bending deflection path, leading to a lower overall effective stiffness \(k_m\). The skew error \(r_x\) is generally observed to be more detrimental than the intersection error \(r_y\) for the same angular magnitude, as it often forces contact towards the edges of the tooth faces, creating the most unfavorable stress state.
2. Coupling Effect of Angular Errors
In reality, both angular errors may be present simultaneously. An orthogonal array was designed to study their coupling effect. The errors \(r_x\) and \(r_y\) were varied across six levels: -5′, -3′, -1′, +1′, +3′, +5′. A total of 36 FE simulations were performed for all combinations. The resulting mesh stiffness values revealed a clear and systematic coupling pattern. The stiffness reduction was most severe in the quadrant where both \(r_x\) and \(r_y\) were positive. The reduction was also significant when both were negative, but generally less severe than the positive-positive quadrant. Combinations with errors of opposite signs (e.g., +r_x/-r_y or -r_x/+r_y) showed an intermediate effect. This indicates that the direction of angular misalignments is critical, and certain combinations can compound their detrimental effects on gear mesh integrity.
3. Time-Varying Mesh Stiffness (TVMS) Characteristics
The quasi-static simulation method was extended to capture a full mesh cycle. The gear pair was rotated in small, discrete angular steps (\(\approx 0.573^\circ\)) from the start to the end of single tooth engagement (total rotation ~10.89°). At each step, representing a different contact position along the path of contact, the FE analysis was performed to compute the instantaneous total mesh stiffness. This process yields the discrete TVMS curve. To analyze the fluctuation characteristics, the discrete TVMS data was fitted with a Fourier series:
$$k(t) = k_m + \sum_{n=1}^{\infty} \left[ a_n \cos(n \omega t) + b_n \sin(n \omega t) \right]$$
where \(k_m\) is the mean mesh stiffness, \(\omega\) is the gear meshing frequency, and \(a_n, b_n\) are Fourier coefficients.
The TVMS curves and their Fast Fourier Transform (FFT) spectra for different error conditions reveal distinct behaviors:
- Ideal & Center Distance Error: The TVMS curves show the classic periodic fluctuation corresponding to the change in the number of tooth pairs in contact (from one to two and back to one). The FFT spectrum is dominated by the fundamental meshing frequency (\(1\times\) mesh freq) and its harmonics. The curve for a center distance error closely resembles the ideal case, albeit with a slightly shifted mean value.
- Angular Errors (\(r_x\) or \(r_y\)): The TVMS curves become more complex and irregular. The amplitude of stiffness fluctuation is larger relative to the mean stiffness. The FFT spectra show not only stronger fundamental frequency components but also significantly elevated higher harmonics (e.g., \(2\times\), \(3\times\) mesh freq). This indicates a more abrupt and non-linear change in stiffness during the mesh cycle, which would act as a richer source of vibratory excitation in a dynamic system.
The increased harmonic content in the stiffness excitation due to angular misalignments can potentially excite more system resonances, leading to higher vibration and noise levels compared to a perfectly aligned or purely center-distance-error gear pair.
4. Influence of Applied Load
The effect of installation error is not constant but varies with the transmitted load. Simulations were conducted for the error cases (\(\Delta u_y=0.025mm\), \(r_x=5’\), \(r_y=5’\)) across a wide load range from 100 Nm to 1000 Nm. The relationship between mesh stiffness and load is non-linear due to the contact mechanics.
- Ideal Condition: Stiffness increases with load and gradually saturates, a typical behavior as the contact area grows non-linearly.
- Center Distance Error: Follows a nearly identical stiffness-load trend as the ideal case, confirming its minor influence.
- Angular Errors: Exhibit a markedly different trend. Under light loads (e.g., 100-300 Nm), the mesh stiffness is drastically lower than the ideal case. As the load increases, the stiffness increases at a faster rate, and the gap between the misaligned and ideal stiffness narrows. This occurs because the higher load causes greater local deformation, which effectively “conforms” the tooth surfaces better, enlarging the contact ellipse and moving towards a more favorable load distribution that partially compensates for the misalignment. Consequently, the detrimental impact of angular installation errors is most pronounced under light load conditions.
Conclusion
This comprehensive finite element investigation elucidates the significant influence of gear installation errors on the mesh stiffness of helical gear pairs. The key findings are synthesized as follows:
- Severity of Error Types: Center distance error has a relatively minor effect on the mean and fluctuating characteristics of mesh stiffness, as it does not alter the fundamental line contact pattern. In stark contrast, angular installation errors (axis skew \(r_x\) and intersection \(r_y\)) induce a severe reduction in effective mesh stiffness. This is a direct consequence of the transformation from theoretical line contact to detrimental point contact, leading to elevated local deformations.
- Coupling of Angular Errors: The combined presence of axis skew and intersection errors exhibits a coupled effect on stiffness reduction. The most severe degradation occurs when both angular errors are positive, indicating that the direction of misalignment is a critical factor in gearbox tolerance design and system performance prediction.
- Excitation Characteristics: Angular errors not only lower the mean mesh stiffness but also profoundly alter the time-varying stiffness signal. The fluctuation becomes richer in higher harmonics, which can exacerbate dynamic response by exciting a broader range of system natural frequencies, potentially leading to increased noise and vibration.
- Load-Dependent Behavior: The impact of installation errors, particularly angular ones, is highly load-dependent. Their effect is most acute under light to moderate loads, where the contact conformity is low. As load increases, the non-linear contact deformation provides a compensating effect, reducing the relative stiffness penalty caused by the misalignment. This highlights the importance of considering the actual operational load range when assessing tolerance impacts.
These results underscore the critical importance of controlling gearbox housing machining and assembly tolerances to minimize axis misalignments. For high-precision, low-noise applications involving helical gears, special attention must be paid to limiting angular errors. The methodologies and findings presented provide a valuable framework for engineers to quantify the sensitivity of gear system stiffness and dynamics to installation imperfections, enabling more robust design and accurate performance forecasting.