
Since the theoretical model does not carry out finite element modeling on the box, and the effective value of vibration acceleration obtained from the experiment is measured from the surface of the box, the following treatment should be done: the experimental results take the average value of the total vibration acceleration of all measuring points, and the theoretical calculation results take the average value of the total vibration acceleration of representative nodes on bearings and helical gears, Then the experimental results are used to verify the correctness of the theoretical model and analysis results.

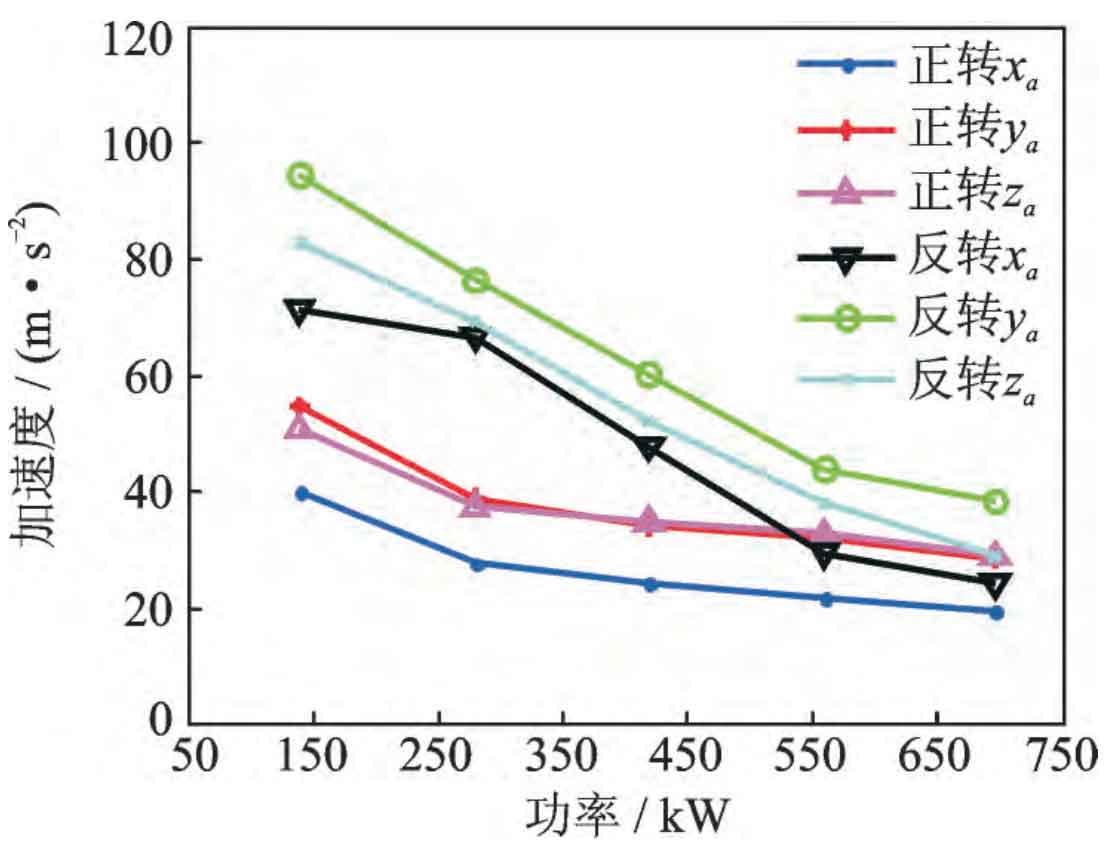
Under the experimental condition of stable speed, the variation of the average value of vibration acceleration in X, y and Z directions of measuring points 1, 2 and 3 with the load is shown in Figure 1. Modify the helical gear profile CA = 30 μ m. The modification length of helical gear tooth profile La = 6.4mm, and the modification amount of helical gear tooth direction CC = 5 μ m. The helical gear tooth modification length Lc = 5mm is substituted into the dynamic model as the optimal modification amount of helical gear, and the amplitude frequency curve of vibration acceleration under the condition of stable speed of helical gear system is obtained. The comparison between theoretical results and experimental results is shown in Fig. 2. With the increase of load, the amplitude frequency curve of theoretical vibration acceleration is consistent with the experimental results, and both show a downward trend. The difference is that from no-load to rated load, the experimental value is greater than the theoretical value; When the rated load is exceeded, the theoretical value is greater than the experimental value. Error of vibration acceleration between theoretical value and experimental value. Under the condition of rated speed and rated load, the error of vibration acceleration between theoretical value and experimental value is about 5.4%, which verifies the correctness of the theoretical model.

Under the torque stability test condition, the variation of the effective value of vibration acceleration in Z direction of measuring points 1, 2 and 3 with speed is shown in Fig. 3. When the rotating speed is 3500r / min, the vibration acceleration amplitude curve has a resonance peak. By comparing the theoretical and experimental results under no-load condition and torque stable condition, it can be seen from Figure 4 (a) that under no-load condition, the theoretical vibration acceleration amplitude increases approximately linearly with the increase of speed, and the experimental result is that when the speed is less than 3000r / min, the vibration acceleration amplitude increases approximately linearly, When the rotating speed is from 3000r / min to 3500r / min, the amplitude rise of vibration acceleration increases, which is consistent with the formant of the acceleration amplitude curve of the box when the rotating speed is 3500r / min. It can be seen from Fig. 4 (b) that under the condition of stable torque, the amplitude of vibration acceleration increases with the increase of speed, and there is a peak at 2500 and 3500r / min; The overall trend of the vibration acceleration amplitude curve obtained by theoretical calculation is basically consistent with the experimental results. The theoretical vibration acceleration amplitude curve has a peak at 2500r / min, but there is no resonance peak at 3500r / min. The main reason is that the influence of structural parts such as box on system vibration is not considered in modeling, resulting in a certain deviation in the results.

