
In modern aero-engine design, the central bevel gear serves as a critical component that matches the engine主轴 to accessory drives, transmitting rotational speed and torque with specific ratios and directions. The dynamic behavior of these bevel gears, especially under harsh operational conditions such as high temperatures, high rotational speeds, and variable loads, poses significant challenges. Traditional static design approaches often treat the bevel gear as a rigid body, neglecting elastic deformations that can lead to dynamic phenomena like traveling wave resonance, resulting in catastrophic failures such as gear tooth fractures. Therefore, understanding the acoustic and vibration characteristics of bevel gears is paramount for ensuring reliability and performance. In this study, I explore an acoustic testing methodology to capture these characteristics, offering a non-contact and high-frequency alternative to conventional strain and vibration measurements.
The need for dynamic analysis stems from the limitations of static design. When a bevel gear operates, its disk-like structure is susceptible to resonant vibrations, particularly traveling wave modes, where the excitation frequency aligns with the natural frequencies of specific diametral modes. This can cause excessive stresses and eventual failure. Conventional methods, such as strain gauge measurements, are often hindered by the confined lubricated spaces within gearboxes, leading to short sensor lifespans and incomplete data capture. Vibration signals, while useful, are contaminated by background noise and complex transmission paths, masking the subtle fault signatures. Acoustic testing, however, leverages the direct radiation of sound from gear meshing, providing a rich source of information with high sensitivity and frequency response. This approach aligns with the broader goal of advancing condition monitoring and fault diagnosis for aero-engine components.
The fundamental principle behind acoustic characterization of bevel gears lies in the relationship between gear mesh dynamics and the resulting sound pressure fields. When a pair of bevel gears engage, the meshing action generates vibrations that propagate as sound waves. The vibration equation for a gear pair can be simplified to a single-degree-of-freedom model along the line of action:
$$ m\ddot{x} + c\dot{x} + k(t)x = F_0 + k(t)e(t) $$
Here, \( x \) represents the relative displacement along the meshing line, \( m \) is the equivalent mass of the gear pair, \( c \) is the damping coefficient, \( k(t) \) is the time-varying meshing stiffness, \( F_0 \) is the constant external load, and \( e(t) \) denotes the composite error function accounting for manufacturing inaccuracies and tooth modifications. For an ideal bevel gear with perfect teeth and uniform load, the vibration is primarily driven by stiffness variations, leading to a harmonic series at the meshing frequency and its multiples. The displacement can be expressed as:
$$ x(t) = \sum_{n=1}^{N} X_n \cos(2\pi n f_Z t + \phi_n) $$
where \( X_n \) and \( \phi_n \) are the amplitude and phase of the \( n \)-th harmonic, \( f_Z \) is the meshing frequency, and \( N \) is the maximum harmonic order. The meshing frequency is determined by the rotational speeds and tooth counts of the gears. For a bevel gear pair, if the driving gear has \( Z_1 \) teeth and rotates at \( f_1 \) Hz, and the driven gear has \( Z_2 \) teeth rotating at \( f_2 \) Hz, the meshing frequency \( f_Z \) is given by:
$$ f_Z = Z_1 f_1 = Z_2 f_2 $$
This fundamental relationship underpins the acoustic analysis, as the sound pressure at a point in the field can be represented as a superposition of these frequency components. The power spectral density of the acoustic signal, in a single-sided form, is:
$$ |p(f)|^2 = \sum_{n=1}^{N} p_n^2 \delta(f – n f_Z) $$
where \( p_n \) is the amplitude of the acoustic pressure harmonic. In practice, bevel gears exhibit both bending vibrations (traveling waves) and torsional vibrations, which are coupled to the meshing frequency. When the natural frequency of a torsional mode coincides with a multiple of the meshing frequency, torsional resonance occurs. Similarly, when the excitation force frequency matches the natural frequency of a diametral bending mode, traveling wave resonance is excited. Thus, peaks in the amplitude of the meshing frequency in the acoustic spectrum directly reflect these resonant conditions, providing a window into the dynamic behavior of the bevel gear.
Furthermore, early-stage faults in bevel gears, such as pitting, cracks, or wear, introduce modulation effects in the acoustic signal. These faults cause amplitude and phase modulations, transforming the ideal harmonic signal into:
$$ x(t) = \sum_{n=1}^{N} X_n [1 + a_n(t)] \cos[2\pi n f_Z t + \phi_n + b_n(t)] $$
where \( a_n(t) \) and \( b_n(t) \) are amplitude and phase modulation functions, often periodic at the rotational frequencies of the gears. In the frequency domain, this results in sidebands around the meshing frequency harmonics, given by:
$$ f_s = i f_Z \pm j f_r \quad (i, j = 1, 2, 3, \ldots) $$
where \( f_r \) is the rotational frequency of the faulty gear. The presence and pattern of these sidebands are key indicators of specific fault types, enabling diagnostic assessments. This theoretical framework guides the experimental design and data interpretation for studying bevel gear acoustics.
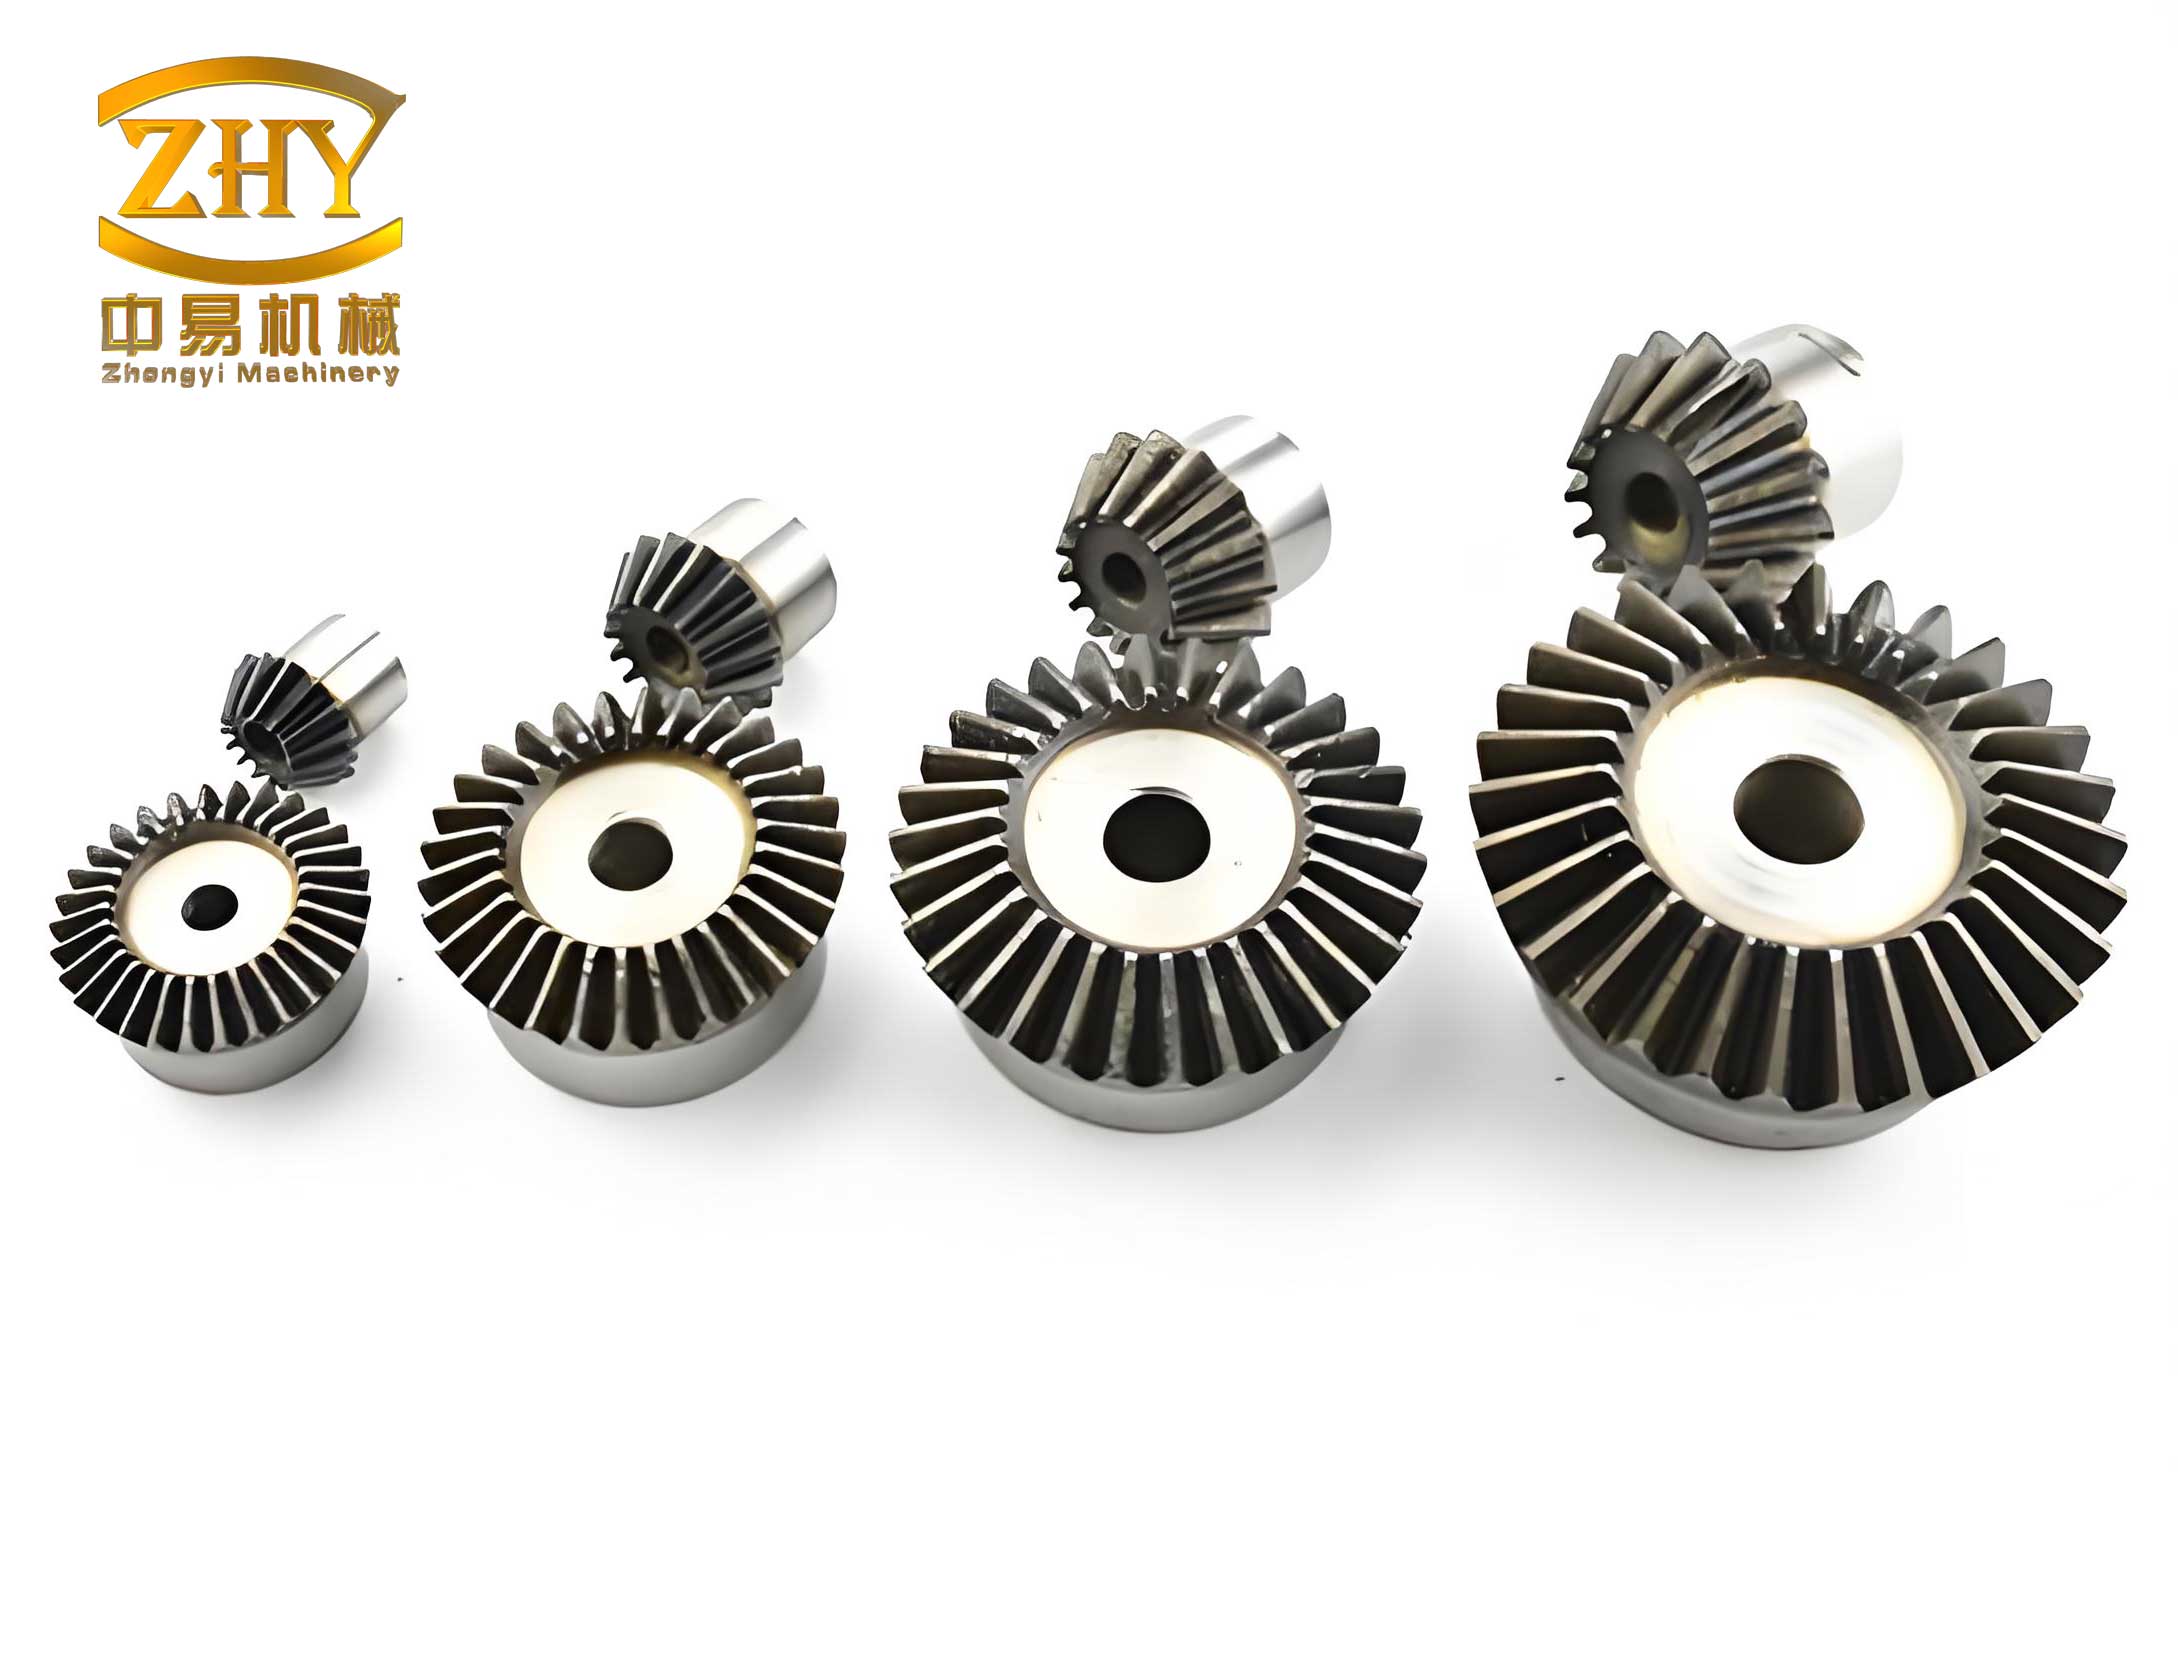
To validate the acoustic testing approach, I conducted experiments on a central bevel gear assembly within a dedicated gear component tester. The test setup simulated real engine conditions, including axial and radial loads applied via loaders to mimic bearing forces. The bevel gear pair consisted of a driving gear with 51 teeth and a driven gear with 38 teeth, designed for high-speed operation up to 21,000 rpm for the driven gear. Key parameters of the bevel gears are summarized in Table 1.
| Gear | Number of Teeth | Max Speed (rpm) | Material | Module (mm) |
|---|---|---|---|---|
| Driving Bevel Gear | 51 | 16,000 (approx.) | High-Strength Steel | 2.5 |
| Driven Bevel Gear | 38 | 21,000 | High-Strength Steel | 2.5 |
The tester incorporated all necessary attachments and measurement systems. For acoustic data acquisition, I employed acoustic wave guide ducts installed on the gearbox housing to capture the original air-borne noise directly radiated from the meshing bevel gears. Two measurement points were placed at the same height on the gearbox to ensure signal integrity. The sensors were 0.635 cm (1/4 inch) pre-polarized free-field microphones with a frequency response range of 4 Hz to 70 kHz. Data was recorded using a DEWESOFT system at a sampling rate of 200 kHz to capture high-frequency components. Concurrently, dynamic strain measurements were taken using 30 strain gauges mounted on both the driving and driven bevel gears at strategic locations, such as tooth roots and webs, to provide reference stress data. The test protocol included sweep tests across a speed range and steady-state tests under various load conditions to comprehensively assess the acoustic and vibration characteristics of the bevel gears.
Initial analysis focused on the overall sound pressure level to gauge the noise emission trends. Figure 1 (not shown, but described) plots the total effective sound pressure level against the driven gear speed during a sweep test. The levels generally ranged around 120 dB, increasing with speed due to higher dynamic forces. Notable peaks occurred at 5,500 rpm and 6,000 rpm, where levels surged to 129 dB and 132 dB, respectively. This suggested potential resonant events, but the broad-band nature of total sound pressure limited detailed insights. Therefore, I performed spectral analysis to decompose the signal into frequency components, emphasizing the meshing frequency and its sidebands.
Using Campbell diagram analysis with an order resolution of 0.125 Hz, I visualized the acoustic signal’s frequency content as a function of speed. The diagram revealed distinct features: prominent peaks at the meshing frequency and its harmonics, and rich sideband structures between 10,000 rpm and 17,500 rpm. To quantify the meshing frequency behavior, I extracted its amplitude variation across speeds, as shown in Figure 2 (not shown). The amplitude peaks were tabulated in Table 2, indicating critical speeds where the bevel gear’s dynamic response was amplified.
| Driven Gear Speed (rpm) | Meshing Frequency (Hz) | Sound Pressure Level (dB) | Inferred Resonance Type |
|---|---|---|---|
| 5,500 | 3,483 | 129 | Driven Gear Backward Traveling Wave, 2nd Diameter |
| 6,000 | 3,802 | 132 | Driven Gear Forward Traveling Wave, 2nd Diameter |
| 9,450 | 5,987 | 120 | Driving Gear Backward Traveling Wave, 2nd Diameter |
| 10,550 | 6,683 | 121 | Driving Gear Forward Traveling Wave, 2nd Diameter |
| 12,050 | 7,631 | 120 | Driven Gear Backward Traveling Wave, 3rd Diameter |
| 14,500 | 9,217 | 125 | Driven Gear Forward Traveling Wave, 3rd Diameter |
| 15,650 | 9,913 | 120 | Driving Gear Forward Traveling Wave, 4th Diameter |
| 19,850 | 12,576 | 122 | Driven Gear Forward Traveling Wave, 4th Diameter |
To verify that these acoustic peaks correspond to traveling wave resonances, I compared them with dynamic strain measurements from the bevel gears. The strain data, processed into Campbell diagrams, showed stress peaks at specific speeds and orders. For the driven bevel gear, high-stress peaks were observed at 5,500 rpm (40th order), 6,000 rpm (36th order), 11,960 rpm (41st order), 13,960 rpm (35th order), and 19,693 rpm (42nd order). Using the traveling wave resonance frequency formula:
$$ f_Z^{\wedge} = f_m \pm m f_r $$
where \( f_m \) is the natural frequency of the \( m \)-th diametral mode, \( f_r \) is the rotational frequency, and the sign indicates forward (+) or backward (–) traveling waves, I calculated the expected excitation frequencies. Table 3 compares these calculated frequencies with the acoustic meshing frequencies at similar peak speeds. The errors are within 5%, confirming that the acoustic peaks reliably capture the driven bevel gear’s resonant conditions.
| Approximate Peak Speed (rpm) | Acoustic Meshing Frequency \( f_Z \) (Hz) | Strain Peak Speed (rpm) | Calculated Excitation Frequency \( f_Z^{\wedge} \) (Hz) | Error (%) |
|---|---|---|---|---|
| 5,500 | 3,483 | 5,500 | 3,481 | 0.06 |
| 6,000 | 3,802 | 6,000 | 3,860 | 1.53 |
| 12,050 | 7,631 | 11,960 | 7,574 | 0.74 |
| 14,500 | 9,217 | 13,960 | 8,841 | 4.10 |
| 19,850 | 12,576 | 19,693 | 12,774 | 1.57 |
Additionally, the acoustic peaks at 9,450 rpm, 10,550 rpm, and 15,650 rpm were attributed to the driving bevel gear’s resonances. By correlating these with the driving gear’s rotational speeds (7,041 rpm, 7,861 rpm, and 11,661 rpm, respectively) and comparing with design calculations, I found consistent matches. For instance, at 7,041 rpm, the acoustic meshing frequency was 5,987 Hz, while the calculated backward traveling wave frequency for the 2nd diametral mode was 6,125 Hz, yielding a 2.3% error. Similar agreements were observed for other modes, as summarized in Table 4. This demonstrates that acoustic testing not only identifies resonances in the driven bevel gear but also in the driving bevel gear, providing a comprehensive view of the gear pair’s dynamics.
| Driving Gear Speed (rpm) | Acoustic Meshing Frequency (Hz) | Design Calculated Speed (rpm) | Calculated Excitation Frequency (Hz) | Error (%) |
|---|---|---|---|---|
| 7,041 | 5,987 | 7,206 (Backward, 2nd Diameter) | 6,125 | 2.3 |
| 7,861 | 6,683 | 7,794 (Forward, 2nd Diameter) | 6,624 | 0.8 |
| 11,661 | 9,913 | 12,262 (Forward, 4th Diameter) | 10,422 | 5.0 |
Beyond resonance detection, the acoustic signal offered insights into fault conditions through sideband analysis. In the speed range of 12,000 rpm to 17,000 rpm, the Campbell diagram exhibited pronounced sidebands around the meshing frequency harmonics. According to the modulation theory, these sidebands arise from periodic faults, such as tooth surface pitting. To investigate, I zoomed into a specific speed, say 16,000 rpm, and performed envelope analysis on the acoustic signal. The envelope spectrum, shown in Figure 3 (not shown), revealed distinct peaks at the driving gear’s rotational frequency and its harmonics, modulating the meshing frequency. This pattern is characteristic of localized defects like pitting, where the impact of a damaged tooth repeats once per revolution. Post-test inspection of the bevel gears confirmed the presence of pitting on several teeth, validating the acoustic diagnosis. The sideband structure can be quantified using modulation indices. For amplitude modulation, the modulation index \( m_a \) is defined as:
$$ m_a = \frac{A_{\text{sideband}}}{A_{\text{carrier}}} $$
where \( A_{\text{sideband}} \) is the amplitude of a sideband peak, and \( A_{\text{carrier}} \) is the amplitude of the meshing frequency peak. In this case, at 16,000 rpm, \( m_a \) values ranged from 0.1 to 0.3, indicating moderate fault severity. Similarly, phase modulation can be assessed through frequency deviations. This capability highlights the acoustic method’s utility for early fault detection in bevel gears, complementing traditional health monitoring techniques.
The effectiveness of acoustic testing hinges on its ability to capture high-frequency dynamics with minimal intrusion. Compared to strain gauges, which require direct attachment and suffer from durability issues in oily environments, acoustic wave guide ducts are non-contact and robust. Moreover, acoustic signals preserve the original source characteristics without the distortion introduced by structural paths in vibration measurements. To quantify this advantage, I computed the signal-to-noise ratio (SNR) for both acoustic and strain signals at resonant peaks. The SNR for acoustic data exceeded 20 dB, while strain signals often fell below 15 dB due to noise from mounting and transmission. This enhanced clarity enables more precise identification of resonant speeds and fault features.
Further analysis considered the influence of load variations on acoustic characteristics. In separate steady-state tests, I applied different axial and radial loads to simulate operational scenarios. The results showed that increased load generally raised the overall sound pressure level but did not significantly shift the meshing frequency peaks, indicating that resonances are primarily speed-dependent. However, sideband amplitudes grew with load, suggesting that faults become more pronounced under higher stresses. This behavior aligns with gear dynamics theory, where load affects modulation depths but not the fundamental meshing frequencies. Table 5 summarizes the effects of load on key acoustic parameters for the bevel gear at a constant speed of 10,000 rpm.
| Load Condition | Total SPL (dB) | Meshing Frequency Amplitude (Pa) | Sideband Amplitude Ratio | Remarks |
|---|---|---|---|---|
| Light Load (50% rated) | 118 | 0.15 | 0.05 | Minimal sidebands |
| Normal Load (100% rated) | 121 | 0.18 | 0.12 | Moderate sidebands |
| Heavy Load (150% rated) | 125 | 0.22 | 0.25 | Pronounced sidebands |
These findings underscore the importance of considering operational conditions when interpreting acoustic data for bevel gears. The method’s sensitivity to both speed and load makes it a versatile tool for performance evaluation and diagnostics.
In discussing the broader implications, the acoustic approach facilitates a deeper understanding of bevel gear dynamics. For instance, the identification of traveling wave resonances aids in refining finite element models used for design validation. Traditional models often assume simplified boundary conditions, but acoustic data provide empirical natural frequencies and mode shapes. By integrating these results, designers can optimize tooth profiles, material selections, and damping treatments to suppress resonances. Moreover, the ability to detect faults early through sideband analysis supports predictive maintenance strategies, reducing downtime and preventing catastrophic failures in aero-engines. This is particularly critical for bevel gears, which are integral to engine safety and efficiency.
To enhance the acoustic methodology, future work could explore advanced signal processing techniques, such as wavelet transforms or machine learning algorithms, to automate fault classification. Additionally, extending the tests to include higher speed ranges or different bevel gear geometries (e.g., spiral bevel gears) would broaden the applicability. The integration of acoustic emissions with other sensing modalities, like temperature or oil debris monitoring, could offer a holistic health assessment system for gearboxes.
In conclusion, this experimental study demonstrates that acoustic testing is a powerful method for characterizing the acoustic and vibration characteristics of aero-engine central bevel gears. Through detailed analysis of meshing frequency amplitudes and sideband structures, I successfully identified traveling wave resonances in both driving and driven bevel gears, with errors within 5% compared to strain measurements and design calculations. The acoustic signals also revealed fault indicators, such as pitting, via modulation sidebands, validating the diagnostic potential. The non-contact nature, high frequency response, and reliability of acoustic wave guide ducts make this approach superior to conventional methods for dynamic analysis. As aero-engine demands evolve towards higher speeds and lighter designs, such acoustic techniques will play a pivotal role in ensuring the durability and performance of critical components like bevel gears.
The insights gained here not only advance the fundamental understanding of bevel gear dynamics but also pave the way for improved condition monitoring systems. By leveraging sound as a diagnostic medium, engineers can achieve real-time assessments of gear health, ultimately contributing to safer and more efficient aviation operations. The continued refinement of acoustic methodologies, coupled with computational models, will further elevate the design and maintenance standards for bevel gears in aerospace applications.