1. Root stress analysis of transmission helical gears
Record and organize the results obtained from finite element analysis. The root stress analysis results of the helical gear transmission for subway vehicles are shown in Table 1.
| Pinion gear displacement coefficient 𝑥 1 | Root stress of pinion gear teeth (MPa) | Wheel gear modification coefficient 𝑥 2 | Root stress of wheel gear teeth (MPa) |
| 0.35 649.0-0.65 785.8 0.40 645.7-0.35 710.0 0.45 646.2-0.05 628.8 0.50 648.8 0.25 676.9 0.55 590.3 0.55 618.3 0.60 648.8 0.85 516.8 0.65 662.5 1.15 508.8 | 649.0 | -0.65 | 785.8 |
| 0.40 | 645.7 | -0.35 | 710.0 |
| 0.45 | 646.2 | -0.05 | 628.8 |
| 0.50 | 648.8 | 0.25 | 676.9 |
| 0.55 | 590.3 | 0.55 | 618.3 |
| 0.60 | 648.8 | 0.85 | 516.8 |
| 0.65 | 662.5 | 1.15 | 508.8 |
From the table, it can be seen that within the selection range of the modification coefficient for the helical gear pair in this study, the influence of the modification coefficient on the root stress of the small gear is relatively small. The variation amplitude of the root stress of the small gear is 10.90%, and the influence on the root stress of the large gear is relatively large. The variation amplitude of the root stress of the large gear is 35.25%. Based on the analysis results of tooth root stress in Table 1, using the Origin function drawing tool, a point line graph was drawn for the tooth root stress of different large and small gears with different displacement coefficients, as shown in Figure 1.
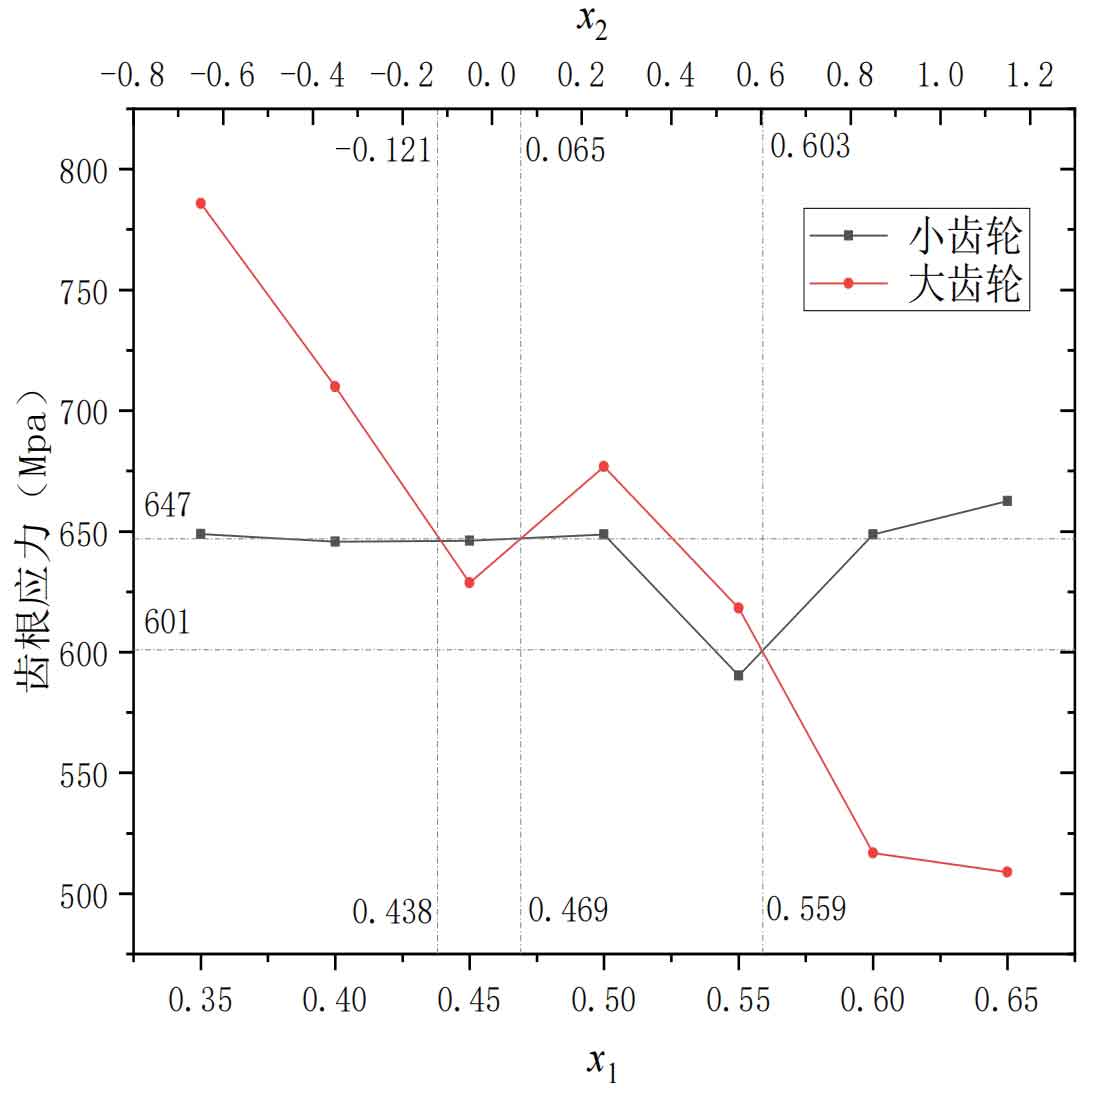
From Figure 1, it can be seen that according to the meaning of the intersection point of the stress lines corresponding to the tooth root of the large and small gears, an array of displacement systems with approximately equal root stresses of the large and small gears can be obtained. The magnitude of its displacement coefficient and the corresponding tooth root stress can be determined by the gray dotted line corresponding to the horizontal and vertical coordinates in the graph.
2. Bending fatigue life analysis of transmission helical gears
Organize and summarize the results obtained from finite element fatigue analysis using FE Safe software. The fatigue simulation results of the transmission helical gear for subway vehicles are shown in Table 2.
| Pinion gear displacement coefficient 𝑥 1 | Bending fatigue life of pinion gears (Cycles) | Wheel gear modification coefficient 𝑥 2 | Bending fatigue life of wheel gears (Cycles) |
| 0.35 | 4016000 | -0.65 | 448400 |
| 0.40 | 4259000 | -0.35 | 1437000 |
| 0.45 | 4220000 | -0.05 | 5837000 |
| 0.50 | 4039000 | 0.25 | 2492000 |
| 0.55 | 10000000 | 0.55 | 7026000 |
| 0.60 | 4032000 | 0.85 | 10000000 |
| 0.65 | 3179000 | 1.15 | 10000000 |
From the table, it can be seen that within the selection range of the modification coefficient for the helical gear pair in this study, the influence of the modification coefficient on the bending fatigue life of the small gear is relatively small. The variation factor of the bending fatigue life of the small gear is about 3.15 times, and the influence on the bending fatigue life of the large gear is relatively large. The variation factor of the bending fatigue life of the large gear is about 22.30 times. Based on the analysis results of tooth root stress in Table 2, using the Origin function drawing tool, a point line diagram was drawn for the tooth root stress of gears with different displacement coefficients, as shown in Figure 2 and Figure 1.
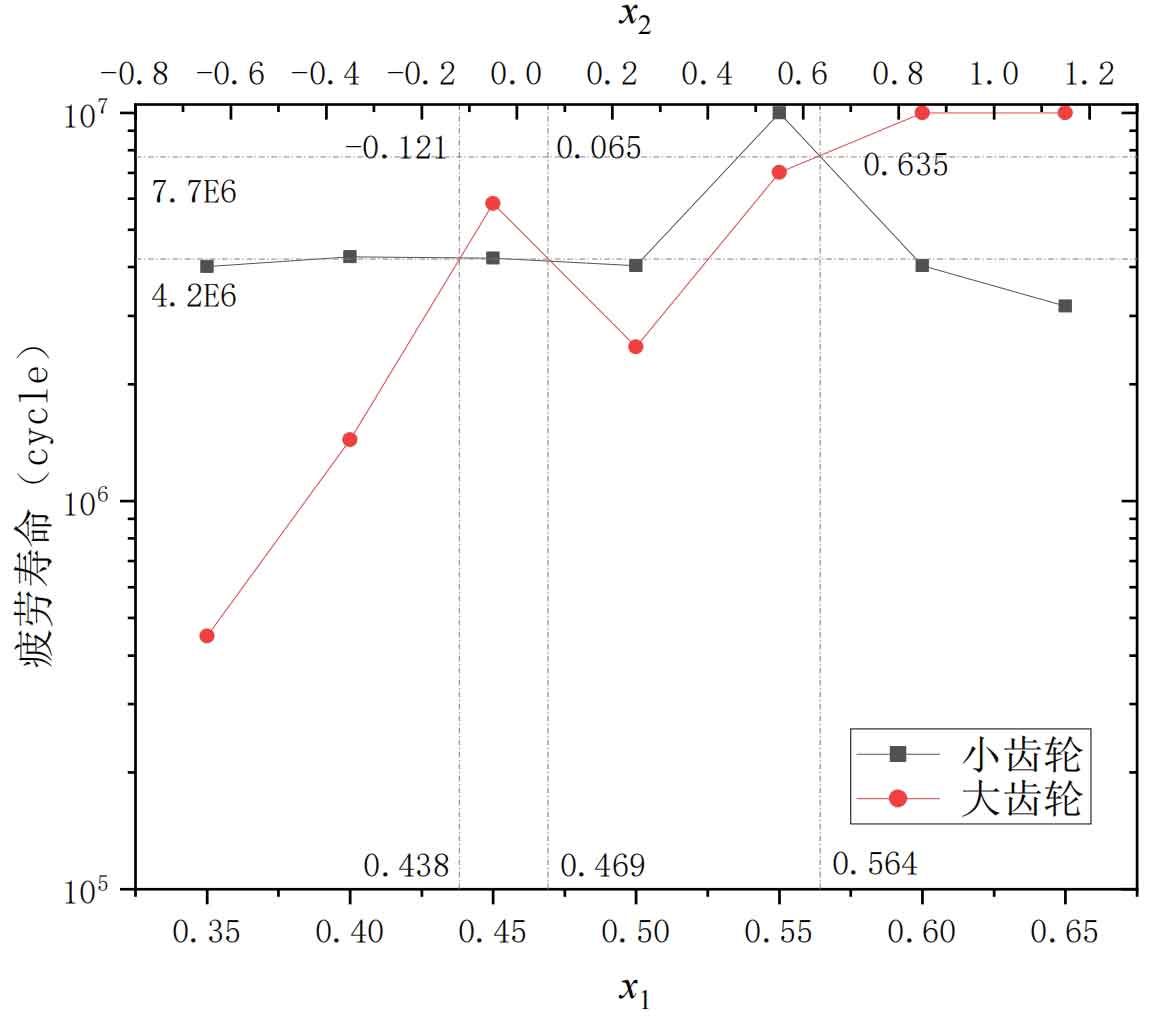
From Figure 2, it can be seen that according to the meaning of the intersection of the bending fatigue life lines of the large and small gears, an array of displacement systems with roughly the same bending fatigue life of the large and small gears can be obtained. The magnitude of its displacement coefficient and corresponding bending fatigue life can be obtained by marking the gray dots on the graph with corresponding horizontal and vertical coordinates, and the specific values are marked on the graph.
3. Verification of accuracy of line chart method
In order to validate the line chart method in this chapter, it is necessary to calculate the root stress and predict the bending fatigue life of the selected helical gear pair with the selected modification coefficient. In section 4.3.3, the accuracy of the finite element simulation calculation of tooth root stress using the single tooth meshing finite element model of helical gears has been verified, and the results have shown that the model can accurately calculate tooth root stress. Therefore, the same method as in section 4.3.3 is adopted in this chapter, with a modification coefficient of 𝑥 1=0.438 𝑥 2=− 0.121 Perform root stress simulation and bending fatigue life analysis on two sets of helical gears with 𝑥 1=0.469 𝑥 2=0.065. The simulation results of the root stress of the helical gear pair with a modification coefficient of 𝑥 1=0.438 𝑥 2=− 0.121 are shown in Figure 3.
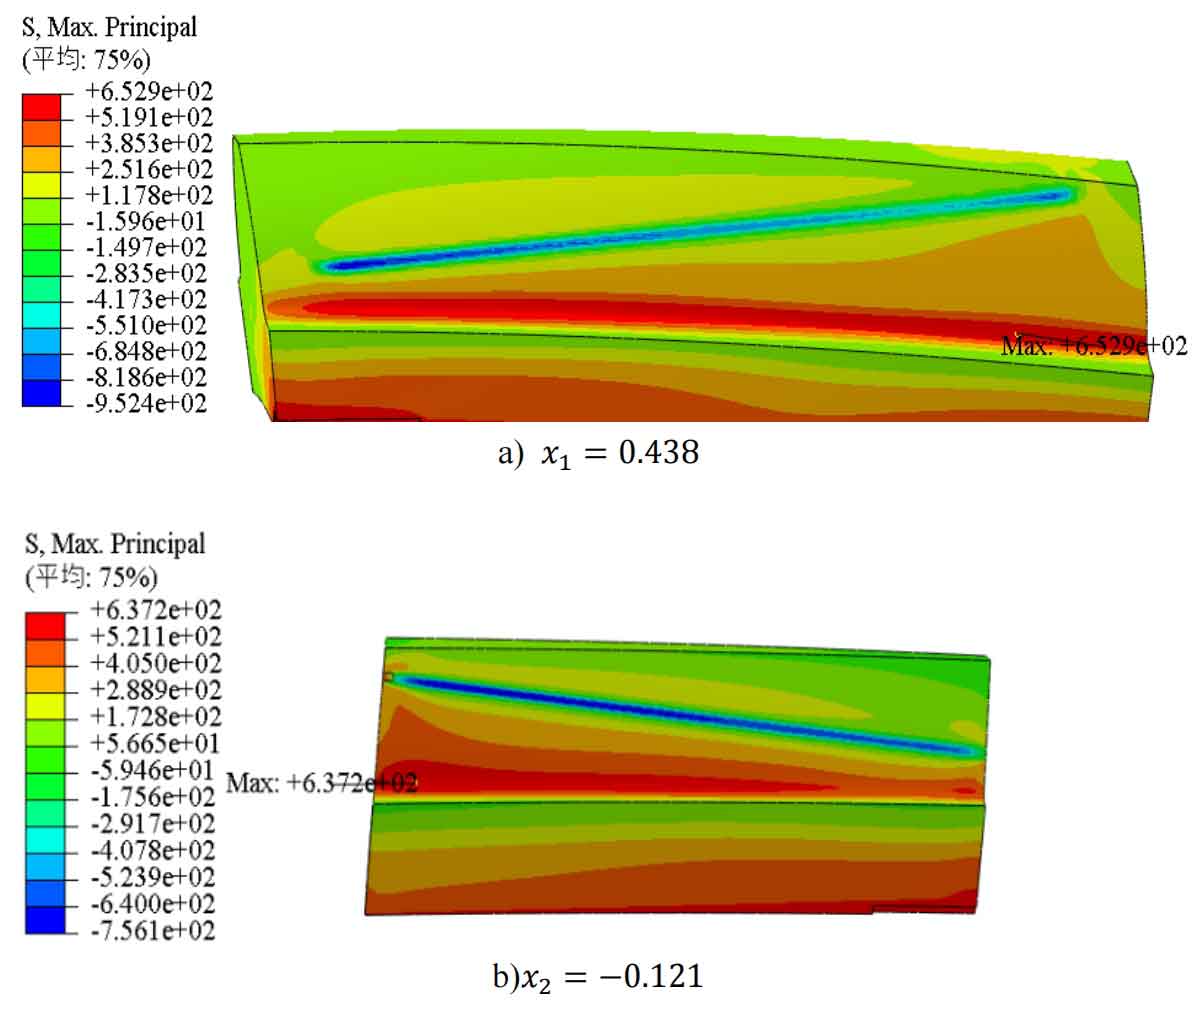
To more intuitively judge the accuracy of the line graph, the prediction error of tooth root stress was calculated, and the results are shown in Table 3.
| Predicted value (MPa) | Simulation value (MPa) | Error | |
| Pinion gear | 647 | 652.9 | 0.91% |
| Wheel gear | 647 | 637.2 | -1.51% |
It can be seen that for the helical gear with a modification coefficient 𝑥 1=0.438 𝑥 2=− 0.121, the root stress obtained from the finite element static analysis of the single tooth meshing of the small gear is 652.9 MPa, which is larger than the root stress obtained by the line graph method of 647 MPa, with an error of only 0.91%; The tooth root stress obtained from the finite element static analysis of the single tooth meshing of the large gear is 637.2MPa, which is smaller than the tooth root stress obtained by the line graph method of 647MPa, with an error of only -1.51%.
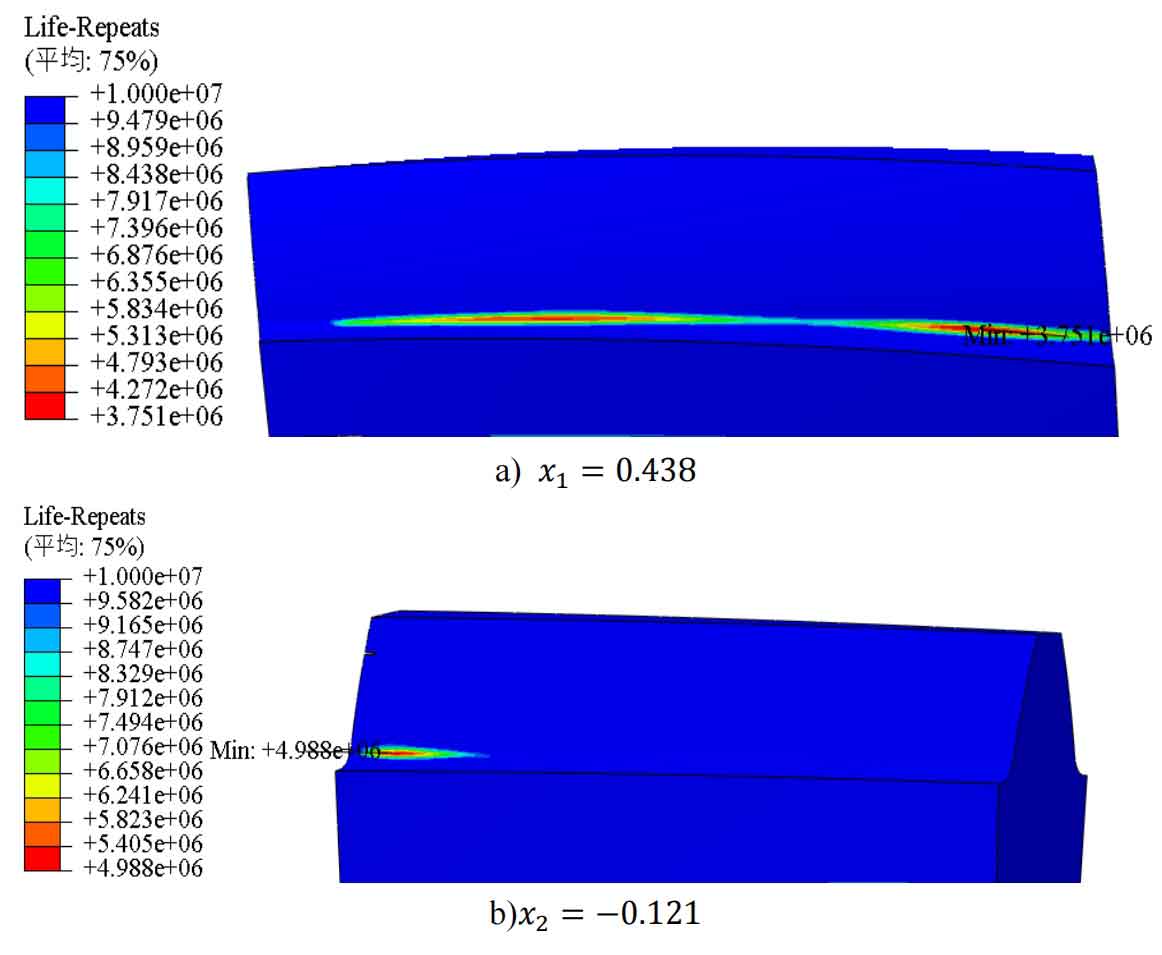
The fatigue analysis results of the helical gear pair with a modification coefficient of 𝑥 1=0.438 𝑥 2=− 0.121 are shown in Figure 4. To more intuitively judge the accuracy of the line graph, the prediction error is calculated, and the results are shown in Table 4.
| Predicted values (Cycles) | Analysis value (Cycles) | Error | |
| Pinion gear | 4.2e6 | 3.751e6 | -10.69% |
| Wheel gear | 4.2e6 | 4.988e6 | 18.76% |
As shown in Table 4, for this pair of helical gears with modification coefficients, the bending fatigue life of the small gear obtained by fatigue analysis using FE Safe software is 3.751e6 Cycles, which is smaller than the bending fatigue life obtained by the line graph method of 4.2e6 Cycles, with an error of -10.69%; The bending fatigue life of the large gear is 4.988e6 Cycles, which is greater than the bending fatigue life of 4.2e6 Cycles obtained by the line graph method, with an error of 18.76%.
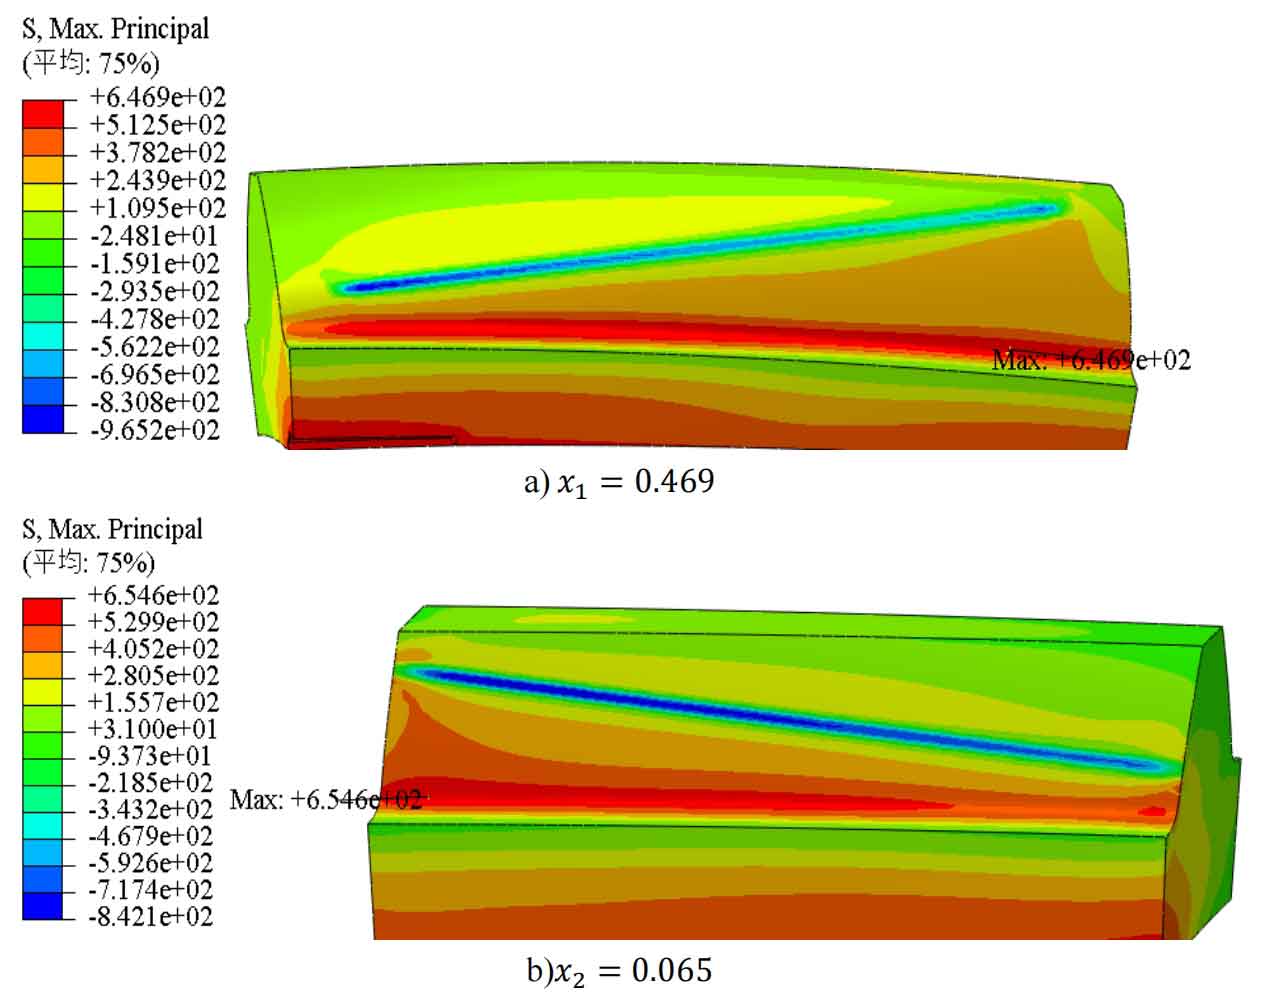
The stress simulation results of a helical gear pair with a modification coefficient of 𝑥 1=0.469 𝑥 2=0.065 are shown in Figure 5. To more intuitively judge the accuracy of the line graph, the prediction error is calculated, and the results are shown in Table 5.
| Predicted value (MPa) | Simulation value (MPa) | Error | |
| Pinion gear | 647 | 646.9 | -0.02% |
| Wheel gear | 647 | 654.6 | 1.17% |
It can be seen that for this pair of helical gears with modification coefficients, the root stress obtained from the finite element static analysis of the single tooth meshing of the small gear is 646.9 MPa, which is 0.1 MPa less than the root stress obtained by the line graph method of 647 MPa, with an error of only -0.02%; The tooth root stress obtained from the finite element static analysis of single tooth meshing of large gears is 654.6MPa, which is lower than the tooth root stress value obtained by the line graph method of 647MPa, with an error of only 1.17%. By combining the finite element analysis results of the root stress of two sets of helical gears with different modification coefficients and the prediction results using the line graph method, it can be concluded that the line graph method used in this chapter can accurately predict the root stress of helical gear pairs with different modification coefficients.
The fatigue analysis results of a helical gear pair with a modification coefficient of 𝑥 1=0.469 𝑥 2=0.065 are shown in Figure 6.
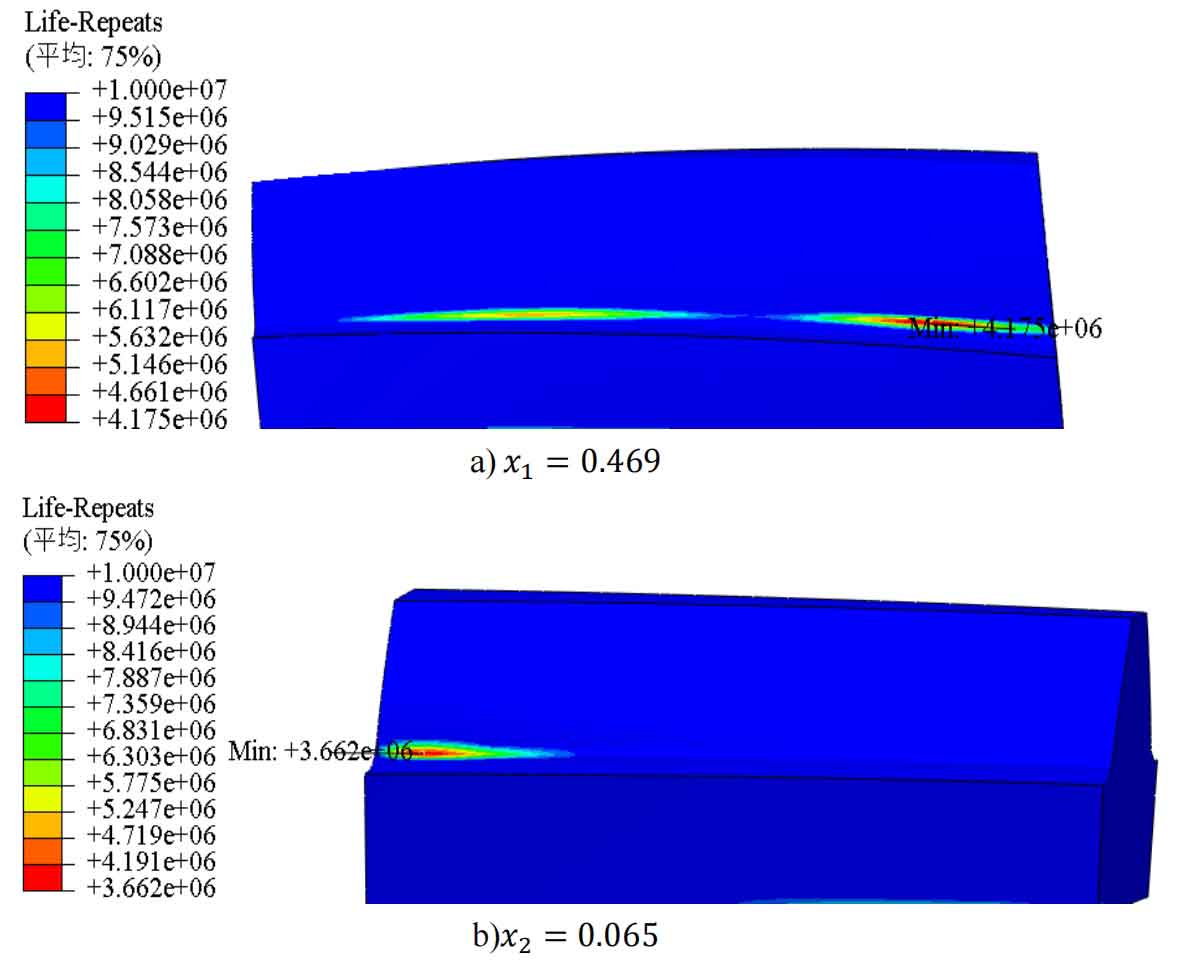
To more intuitively assess the accuracy of the line chart, the prediction error was calculated, and the results are shown in Table 6.
| Predicted values (Cycles) | Analysis value (Cycles) | Error | |
| Pinion gear | 4.2e6 | 4.175e6 | -0.59% |
| Wheel gear | 4.2e6 | 3.662e6 | -12.8% |
From Table 6 and Figure 6, it can be seen that for this pair of helical gears with modification coefficients, the bending fatigue life of the small gear obtained by fatigue analysis using FE Safe software is 3.751e6 Cycles, which is smaller than the bending fatigue life obtained by the line graph method of 4.2e6 Cycles, and the error is -10.69%; The bending fatigue life of the large gear is 4.988e6 Cycles, which is greater than the bending fatigue life of 4.2e6 Cycles obtained by the line graph method, with an error of 18.76%. Based on the finite element fatigue analysis results of two sets of helical gears with different modification coefficients and the prediction of bending fatigue life using the line graph method, it can be concluded that the line graph method used in this chapter can accurately predict the bending fatigue life of gear pairs with different modification coefficients.
4. Optimization design of bending fatigue life for transmission helical gears
According to the principle of equal strength in mechanical design, select the optimal combination of deformation coefficients for the transmission helical gears of subway vehicles. By using the line chart method to analyze Figure 1, the selection of the modification coefficient for the helical gear pair with the same and minimum root stresses of the large and small gears can be obtained. 𝑥 1=0.559 𝑥 2=0.603, and the maximum root stress of the helical gear pair is predicted to be 601MPa. According to the principle of equal lifespan, select the optimal combination of deformation coefficients for the transmission helical gears of subway vehicles. By using the line chart method to analyze Figure 2, the selection of the modification coefficient for the helical gear pair with the closest and maximum bending fatigue life of the large and small gears can also be obtained. 𝑥 1=0.564 𝑥 2=0.635. At this time, the comprehensive bending fatigue life of the helical gear pair is predicted to be 7.7e6 Cycles. Using the same method, single tooth meshing models were established for helical gear pairs with deformation coefficients of 𝑥 1=0.559 𝑥 2=0.603 and 𝑥 1=0.564 𝑥 2=0.635, respectively. Static analysis was conducted and imported into FE Safe for fatigue analysis. The optimized fatigue performance of the helical gear was obtained based on two different principles: equal strength principle and equal life principle, and compared with the fatigue performance of the prototype helical gear, The results are shown in Table 7.
| Fatigue life of small gears (Cycles) | Fatigue life of large gears (Cycles) | Comprehensive fatigue life (Cycles) | |
| Prototype gear pair 𝑥 1=0.488 𝑥 2=0.257 | 4.039e6 | 2.492e6 | 2.492e6 |
| Equal strength principle 𝑥 1=0.559 𝑥 2=0.603 | 10e7 | 8.199e6 | 8.199e6 |
| Principle of equal lifespan 𝑥 1=0.564 𝑥 2=0.635 | 7.624e6 | 10e7 | 7.624e6 |
From the table, it can be seen that the fatigue performance improvement of the helical gear pair optimized by the line graph method based on the principle of equal strength is higher than that of the helical gear pair optimized based on the principle of equal life. This may be related to the lower accuracy and prediction accuracy of the fatigue life line graph compared to the tooth root stress line graph. The comprehensive fatigue life of the helical gear pair optimized according to the principle of equal strength is 8.199e6 Cycles, and the comprehensive fatigue life of the helical gear pair optimized according to the principle of equal life is 7.624e6 Cycles. Both methods can significantly improve the fatigue performance of the prototype helical gear pair, with a fatigue life of 3.29 times and 3.06 times that of the prototype helical gear pair, respectively. When using the line graph method to optimize the modification coefficient of helical gears, priority should be given to the root stress line graph and optimization should be carried out according to the principle of equal strength.
