
0 Introduction
Gears are commonly used in aerospace, rail transit, automotive, agriculture, mining, and many other industries. Fatigue failure of gears can have serious consequences in practical engineering applications. Therefore, it is advisable to establish a suitable It is of great significance to use a wide range of easy-to-calculate cylindrical gear bending fatigue life prediction models. In recent years, many gear damage accumulation models and life prediction methods have been proposed by scholars at home and abroad. On the basis of introducing the energy criterion and determining the damage parameters, an improved nonlinear fatigue life prediction model was established to correct the interaction factors by using the load cycle ratio and real-time fatigue damage, respectively. Based on the concept of minimum order statistics, a probabilistic life prediction model for gears is established. According to the characteristics of residual strength attenuation, a residual strength prediction model with unknown parameters determined by stress-life curves is established. The fatigue life of the rod is predicted using the nominal stress method, which is closer to reality. A method for predicting the transmission life of jaw crusher gears based on damage defects was proposed. Through the study of the path, direction and velocity of root crack propagation, the prediction method of crack propagation life was discussed. A fatigue life prediction method for gears based on the concept of power density was proposed. Taking the gearbox pair of wind turbine as the research image, a damage accumulation model based on continuous damage mechanics and considering the influence of initial residual stress is proposed. Using the nominal stress method and the Miner cumulative damage theory, the contact fatigue life of the gear was calculated according to the modified material P-S-N curve. Patil et al. proposed a crack propagation trajectory generation method based on the three-dimensional boundary element method. Čular et al. proposed a predictive analysis model for the bending fatigue life of carburized gears based on the strain-life method. Vuckovic et al. proposed a computational model for bending fatigue failure prediction of case-hardened spur cylindrical gears. To sum up, scholars at home and abroad have carried out a large number of research works on the prediction methods of cylindrical gear bending fatigue life. Some research has been carried out on the fatigue life prediction method with energy as the damage variable, but most of them are based on standard cylindrical specimens, and the fatigue life prediction of gear bending based on energy theory has yet to be carried out. Therefore, in this paper, the gear bending fatigue test and the finite element model simulation results are used to obtain the tooth root energy accumulation curve, and a cylindrical gear bending fatigue life prediction model is proposed. The results of this study can provide a certain reference for further prediction of gear bending fatigue life based on energy theory.
1 Gear bending fatigue test
In order to study the bending fatigue life of gears, it is necessary to perform a bending fatigue test on the gears. At present, the methods for carrying out gear bending fatigue test are mainly divided into working gear bending fatigue test and non-working gear bending Flexural fatigue test. The bending fatigue test of the working gear is carried out by installing the gear on the testing machine, and the gear is running according to the speed and load in the actual work. The bending fatigue test of non-operating gears can be performed in static The bending fatigue life of the gear is measured below, and the gear pair meshing is simulated by applying a load to the gear teeth, which has the advantages of small test consumption, low cost, short time required, easy operation and high utilization rate compared with the operation test.
1.1 Single tooth bending fatigue test
The test equipment is PLG-200 high-frequency bending fatigue testing machine. The gear parameters are shown in Table 1.
Table 1 Gear parameters
| 齿数 | 法向模数mn /mm | 齿宽/mm |
| 22 | 5 | 10 |
The subway gear is the research object, which has the same characteristics as the specimen gear in this paper. In this test, the gear specimen is determined by the lifting method The fatigue life of the gear specimen is 500 at the level of N=107. 40 MPa, gear fatigue is mostly high cycle fatigue. Considering the performance of the test equipment, the fatigue life of the gear specimen is studied in this paper, taking N≤107. Before the test starts, the surface of the gear specimen is polished, and the polished gear specimen is shown in Figure 1. The test root stress was selected as the grade III root stress determined in literature 15-27, which was 544. 76 MPa, the loading load of the testing machine can be based on
Eq. (1) and Eq. (2), i.e
where YFE is the tooth profile coefficient; YSE is the stress correction coefficient of the test load, and YδrelT is the sensitivity coefficient of the relative tooth root fillet. YRrelT is the relative root surface condition coefficient; YX is the size factor for calculating the bending strength; YST is the stress correction coefficient of the gear; b is the tooth width; m is the gear modulus; σF is the fluctuating cyclic root stress when the cyclic characteristic coefficient is equal to zero; σ´F is the actual root stress; rF is the cyclic characteristic coefficient; σb is the tensile strength of the gear material. Table 2 lists the parameter values.
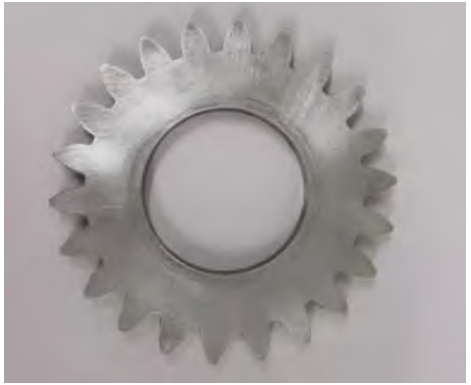
Fig.1. Gear specimens
Table 2 Root stress parameters
| 系数 | YSE | YFE | YδrelT | YRrelT | YX | YST |
| 数值 | 1.765 | 2.25 | 1 | 1.063 | 1 | 2 |
The loading frequency of the testing machine is about 150 Hz, when the vibration frequency drops by 8%, the test is paused, and the number of cycles at this time is recorded as the crack initiation life Ni, and the cracks along the end face of the gear and along the tooth width direction are observed, and the cracks are passed by hand The crack length is measured with a scale microscope, which is denoted as AI and A*I, respectively. The fatigue testing machine is set to displacement protection and the test is continued until the teeth break. At this stage, the crack propagates slowly along the end face, along the teeth
Crack propagation in a wide direction. The number of cycles recorded at fracture is the fatigue life of the specimen N. The propagation life Ns during crack propagation is calculated by equation (3).

A total of 3 groups were conducted, and the test data are shown in Table 3.
Table 3 Crack propagation test data
| 试验 编号 | 萌生寿命 Ni /104 次 | 端面裂纹 长度ai /mm | 齿宽裂纹长 度a* i /mm | 扩展寿命 Ns /104 次 | 疲劳寿命 N/104 次 |
| 1 | 280.62 | 0.73 | 0.49 | 23.29 | 303.91 |
| 2 | 310.70 | 0.91 | 0.58 | 16.79 | 327.49 |
| 3 | 263.39 | 0.82 | 0.56 | 19.27 | 282.66 |
According to the test data, the initiation life of the specimen accounts for 92% of the fatigue life of the specimen. 33% or more; The extended life accounts for only a small part of the fatigue life, at 7% of the fatigue life. 66% or less. When the frequency of the testing machine decreased to 10% of the original frequency, cracks appeared visible to the naked eye at the tooth roots of the three groups of specimens, and the length of the cracks along the end face was greater than the length along the tooth width, the crack size along the end face of the tooth root was less than 1 mm, and the crack length along the tooth width was less than 0. 6 mm。
1.2 Specimen fracture analysis
The fracture grayscale diagram of the gear specimen is shown in Figure 2. As can be seen from Figure 2, the section is relatively smooth and wavy lines appear in the red dotted line frame, which is consistent with the characteristics of the fatigue fault initiation zone, and the width of the area is about For 1. 2 mm; In the yellow dotted frame, the fracture surface is grainy and rough, which is consistent with the characteristics of fatigue fracture transient fracture zone.
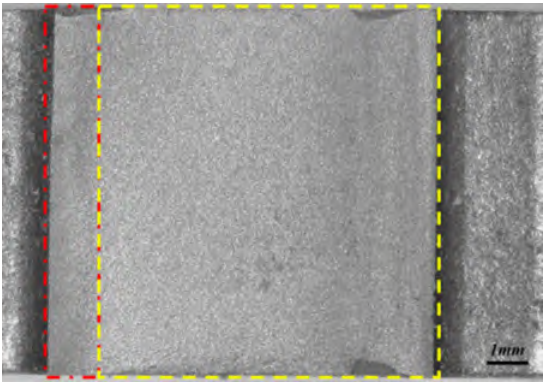
Fig.2. Grayscale diagram of specimen fracture
Tooth fracture is caused by tensile stress on one side of the loaded tooth root, which leads to the initiation of open cracks at the tooth root, which eventually leads to tooth breakage.
1.3 Finite Element Analysis
In order to meet the actual working conditions of the single-tooth bending fatigue test, considering the balance between the calculation cost and the calculation accuracy, only the single tooth on the cylindrical gear is meshed to reduce the calculation scale. The number of grids is 82 213,The total number of nodes is 119 208, using tetrahedral volume units(C3D10). The static analysis of the single-tooth finite element model was carried out, and the single-tooth model was fixed, and the loading area was consistent with that of the single-tooth flexural fatigue test. Through the static finite element analysis of a single tooth, the stress distribution diagram at the root of the tooth can be simulated when the testing machine is loaded. The stress distribution contour at the tooth root is shown in Figure 3, and the stress distribution contour at the cross-section of the tooth root is shown in Figure 4.
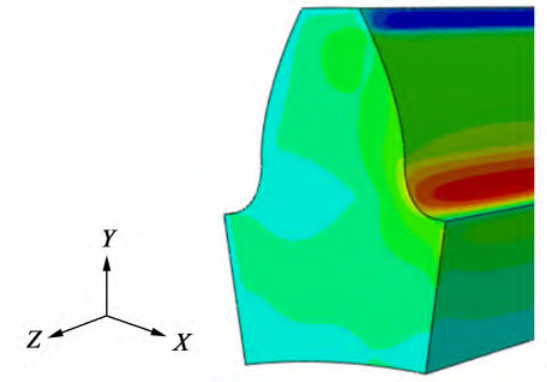
Fig.3. Stress distribution contour at tooth root
Preset Crack (1×0. 5) The stress distribution contour diagram at the tooth root is shown in Figure 5, and the stress distribution contour diagram of the cross-section of the tooth root of the preset crack is shown in Fig. 6.
Through finite element analysis, it can be seen that in the early stage of crack propagation, the stress at the tip of the crack at the root is larger, and the size is about twice the maximum stress on the surface of the root.
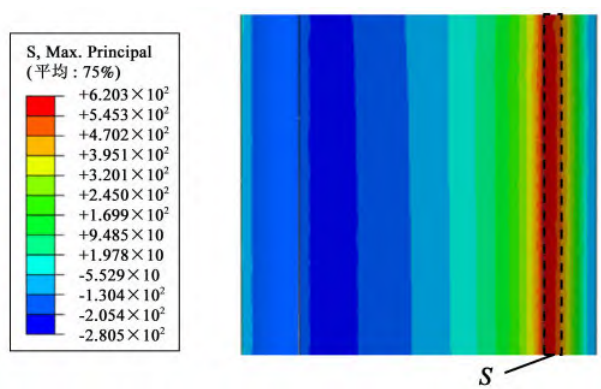
Fig.4. Stress distribution contour of tooth root cross-section
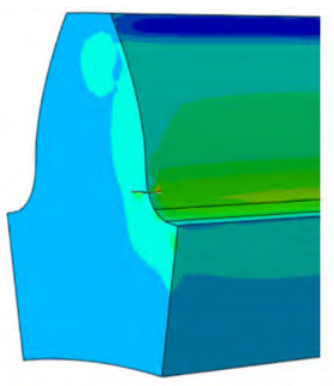
Fig.5. Stress distribution contour at the root of the preset crack tooth
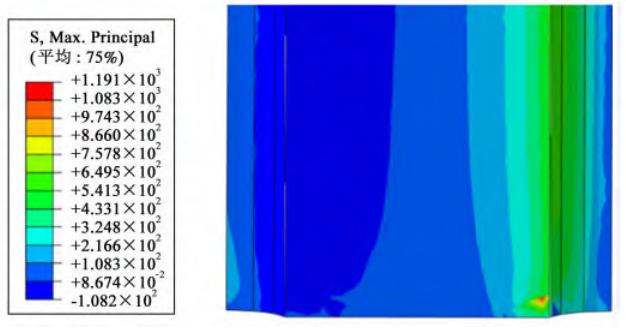
Fig.6. Stress distribution contour of the cross-sectional root of the preset crack
Small cracks (1×0. 5) There is little influence on the stress at the root of the tooth, only the large stress exists at the crack tip area, and the stress value value at the rest of the surface layer of the tooth root is very different from that of the finite element model without cracks. Large cracks (exceeding the above dimensions) are affected by the cross-sectional area of the crack, which has a greater impact on the stress at the root of the tooth, and there are difficulties in calculating the energy, but the fatigue life corresponding to the large crack propagation stage is often less than 10%. Therefore, this paper only predicts the initiation life of the gear and takes this as the fatigue life of the gear. The stress on the end face of the gear is evenly distributed along the Z-axis and varies along the X-axis. Therefore, when calculating the mean stress amplitude of the energy accumulation zone, the stress trend of different nodes along the X-axis direction of the gear end face is mainly studied. By comparing with the results of the gear bending fatigue test, the position of the node with the largest principal stress in the static simulation of Abaqus finite element software is consistent with the position of the initial crack initiation in the bending fatigue test, which proves that it is limited Meta-simulation methods can accurately calculate the stress field distribution of gears36-37.
2 Energy accumulation curve vs. growth rate curve
2.1 Gear bending fatigue test under single-stage load
According to previous studies, the corresponding root stress of this type of gear is 639 at the fatigue life of 105 times. 60 MPa。 In this paper, the bending fatigue test of gears under single-stage load is carried out in the range of high cycle fatigue.Thus, the strain curves at the tooth root under different stress levels are obtained. The tests on the gear specimens were carried out at five root stress levels. The stress levels and loading loads are shown in Table 4.
Table 4 Testing machine load and corresponding stress
| 试验机加载载荷/kN | 应力水平/MPa |
| 79.18 | 510.00 |
| 84.12 | 541,25 |
| 89.08 | 572.50 |
| 94.04 | 603.75 |
| 99.02 | 635.00 |
Before starting, the specimen is sanded with sandpaper, and according to the previous test, the strain gauge is pasted as close to the surface of the tooth profile as possible on the crack propagation path, as shown in Figure 7. The strain gauge is a 1AA type high-precision resistive strain gauge, and the size of the strain gauge sensitive gate is
6 mm×3. 9 mm。 The strain gauges are connected to the signal acquisition instrument by means of an enameled wire, the model of which is the MDR80 data acquisition instrument with a measurement frequency of 2 000 Hz. The testing machine is loaded at a frequency of about 150 Hz, and when the testing machine frequency drops to 92% of the original frequency, the test is stopped, and The number of cycles is recorded as the flexural fatigue life of the specimen.
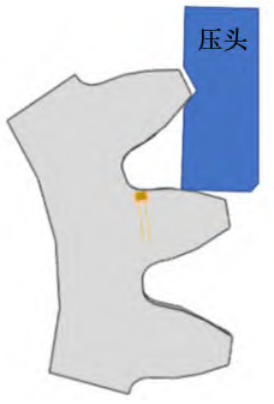
Fig.7. Schematic diagram of strain gauge pasting
The collected strain signal is filtered and extracted by peak value, 572. The strain-load cycle curve at the root at the 50 MPa root stress level is shown in Figure 8.

Fig.8. Strain-load cycle number curve
2.2 Energy accumulation curve
From the first law of thermodynamics, the increment δU of the internal energy per unit volume of an object should be equal to the sum of the heat energy δQ given by the outside world and the work done by the outside world δW, i.e
δU = δQ + δW (4)
In the case of heat exchange between the system and the outside world, when the testing machine loads the specimen, part of the mechanical energy is dissipated in the form of heat, and the other part of the energy is stored in the specimen in the form of internal energy
W = U + Q (5)
For high cycle fatigue, the main deformation of the specimen is the macroscopic elastic deformation because the applied cyclic stress level is lower than the macroscopic yield stress. At the microscopic scale, due to the inhomogeneity of the grains, the incompatibility of the grain boundaries, and the potential defects such as porosity and inclusion, the material has an obvious stress concentration effect, which will produce irreversible microplastic deformation locally and change the microstructure inside the crystal. The energy tendency that causes the injury is essentially the same as the internal energy tendency acting on the gear. Thus, the energy that causes the damage can be expressed in terms of the internal energy acting on the gear. For isotropic materials, the work required for the deformation of infinitesimal microelement dV is
dU = f (ε1, ε2, ε3 )dV (6),
where ε1, ε2, and ε3 are the main strains. At different constant stress levels, multiple specimens are fatiguedLabor test to predict the cumulative fracture energy and the corresponding fatigue life. The large tensile stress close to the tooth surface leads to the generation of open cracks at the tooth root, so the energy Ed in the crack initiation area at the tooth root is consumed by a single load during the test
Ed = σm SΔli (7)
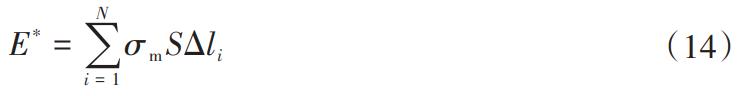
where S is the area of the dashed frame area in Figure 4; σm is the mean value of regional stress amplitude; Δli is the displacement of this region at the ith cycle. The energy consumed in the crack initiation area of the specimen from the start of the test to the nth loading is
E =∑i = 1nσm SΔli (8)
The energy accumulation curves of the specimens under five loads are shown in Figure 9.
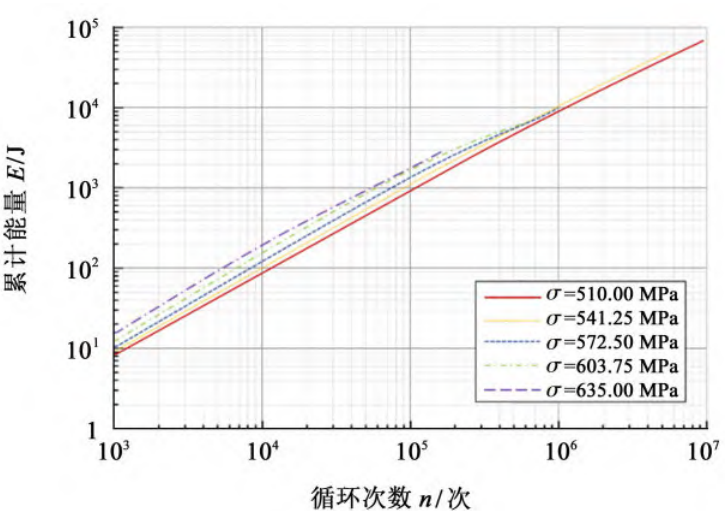
Fig.9 Energy accumulation curve
2.3 Energy growth rate curve
During the experiment, the cumulative energy growth rate vE was
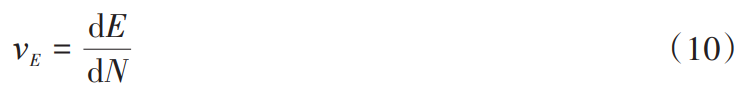
The cumulative energy growth rate vE under the five root stress levels is shown in Figure 10.
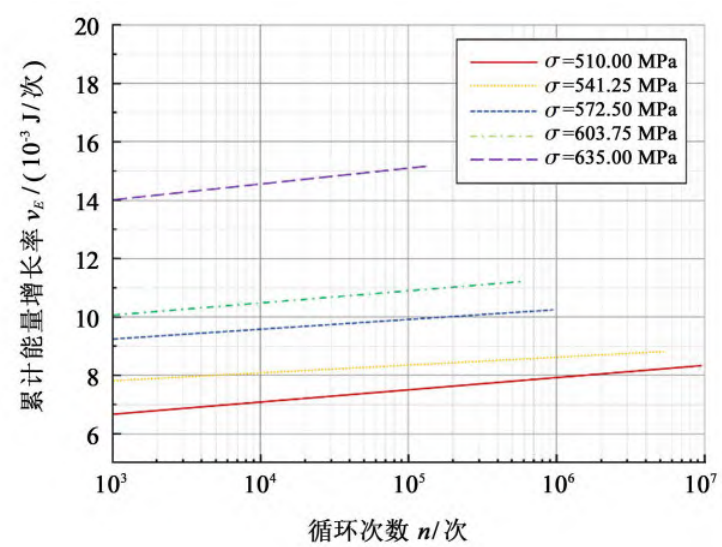
Fig.10 Cumulative energy growth rate curve
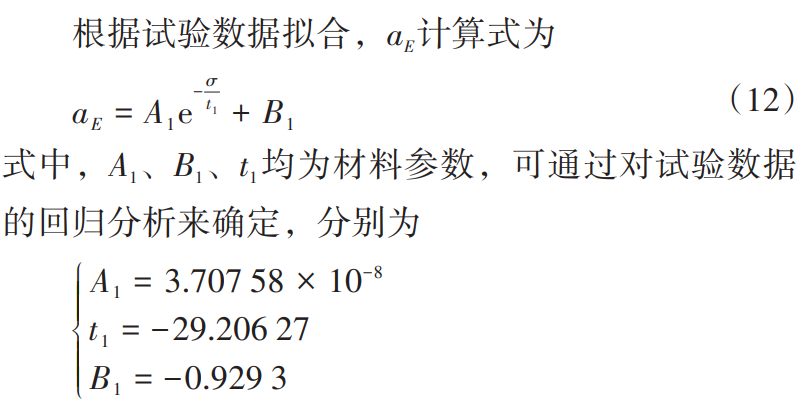
The cumulative energy growth acceleration rate aE is
The acceleration rate of accumulated energy growth aE of tooth roots under different root stress levels is shown in Figure 11.
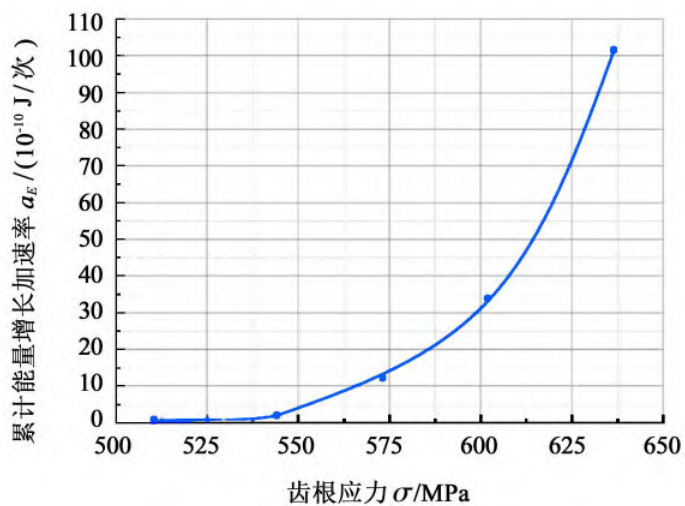
Fig.11 Cumulative energy growth acceleration rate curve
3 Life Prediction Models and Validation
3.1 Gear bending fatigue life prediction model
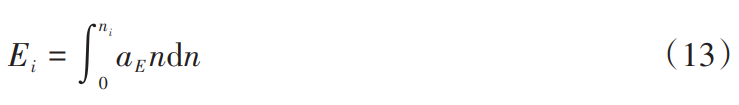
During the test, the energy consumed in the crack initiation area of the gear specimen is accelerated, and the cumulative energy acceleration rate aE is a constant value during this acceleration process. Therefore, the cumulative energy Ei of ni cycles is
Once the total accumulated energy reaches the threshold amount, the continuous accumulation of microplastics will lead to the initiation and propagation of macroscopic fatigue cracks, and fatigue fracture may occur very quickly. When the number of cycles reaches the fatigue life of the specimen, fatigue fracture occurs in the specimen. The cumulative energy of fracture E* is
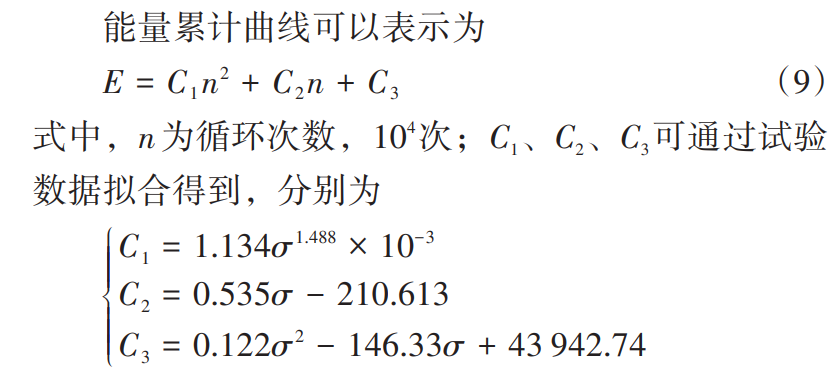
The cumulative energy curves at break at different root stress levels are shown in Figure 12. As can be seen from Figure 12, the cumulative fracture energy of the material becomes smaller and smaller as the root stress increases. The curve can be expressed as:
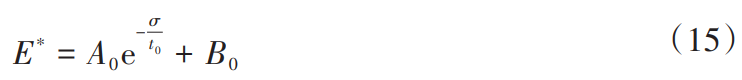
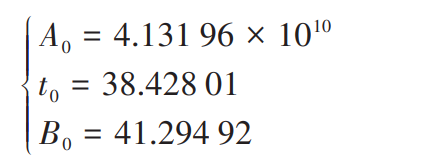
where A0 and B0 are material parameters; t0 is the attenuation coefficient of fracture energy. A0, B0, t0 can be determined by regression analysis of the trial data, respectively:
According to the Palmgren-Miner linear cumulative damage theory and the cumulative energy assumption at break for fatigue failure, a nonlinear energy cumulative damage model was established. The cumulative damage of the component after ni cycles under the action of the root stress level σm is
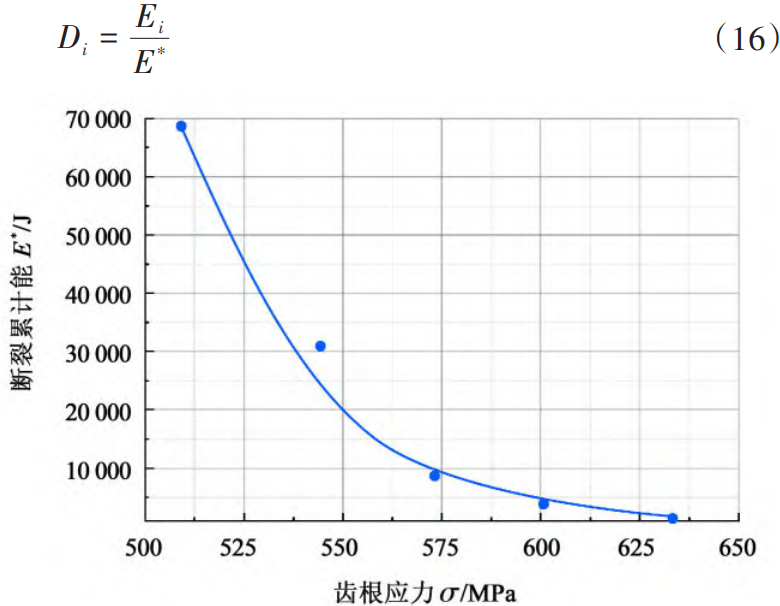
Fig.12. Cumulative energy curve at break
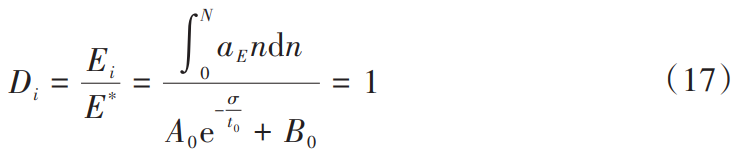
When it is considered that the cumulative damage D reaches the critical value of 1, that is, when the cumulative energy E reaches the cumulative energy of fatigue fracture E*, irreversible fatigue failure occurs of the specimen, and the number of cycles n is the fatigue life of the specimen N. Therefore, the fatigue life N of the specimen under a single-stage load can be calculated by the following formula
3.2 Model accuracy verification
In order to verify the validity and applicability of the proposed model, the test life of gear bending fatigue and the predicted life of gear bending fatigue were compared, and the results are shown in Figure 13. As can be seen from Figure 13, the predicted life of energy-based gear bending fatigue is lower than that of the test life, and the prediction accuracy is low. Overall, the energy-based gear bending fatigue prediction life is within 3 times the test life, which can be used for cylindrical gear bending fatigue life prediction. As the stress applied on the gear increases, the bending fatigue prediction life of the gear also decreases, which is consistent with the actual operating conditions.
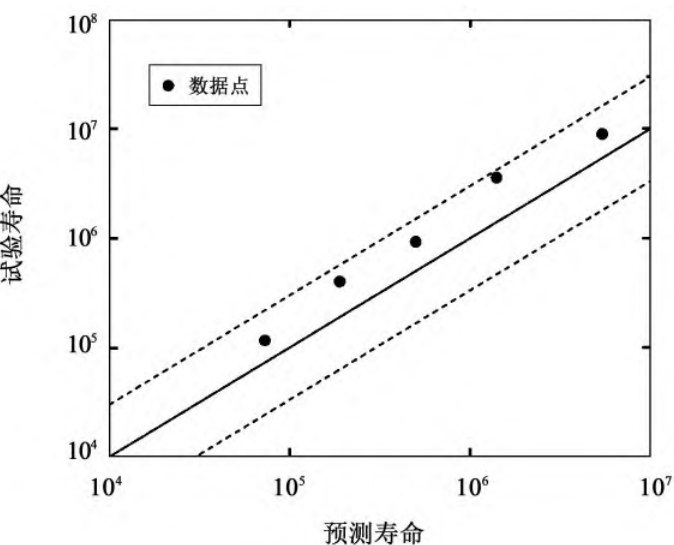
Fig.13 Comparison of fatigue life prediction results with test results
4 Conclusion
In order to solve the problem of bending fatigue life prediction of cylindrical gears, a prediction model of bending fatigue life of cylindrical gears based on Palmgren-Miner linear cumulative damage theory and energy accumulation curve was proposed. Through the gear bending fatigue test data and prediction data under different stress amplitudes The effectiveness and applicability of the model are verified. The conclusions are as follows:
1) The results of gear bending fatigue test under single-stage load show that the large tensile stress close to the tooth surface leads to the formation of open cracks at the tooth root, and the fatigue life corresponding to the large crack propagation stage is often less than 10%. cause Therefore, it is possible to predict only the initiation life of the gear and use it as the fatigue life of the gear.
2) The test data and prediction data of gear bending fatigue under different stress amplitudes were verified and compared, and the test results were within the range of 3 times of the prediction results of the model, which proved that the model could be used to predict the bending fatigue life of carburizing Cr-Ni cylindrical gears.
3) When applying the proposed model, the relationship between stress, accumulated energy at fatigue fracture and fatigue life of gear bending should be determined experimentally.