

Figure 1 shows the measurement curve of tooth profile deviation of aa-1 gear after fatigue pitting. The measurement results show that the maximum total tooth profile deviation is 20.7 μ m and the maximum tooth profile shape deviation is 18.3 μ M. By observing the photos, it is found that there is obvious fatigue pitting near the pitch line and slight scuffing near the top of the tooth. The main reason is that the gear measuring center adopts the probe type measuring method, and the measuring accuracy or the swept tooth surface features are determined by the size of the probe used. At the same time, there is the limitation of the measuring location, which makes the measurement of the tooth profile more accurate The numerical value is slightly less than the physical characteristics of the tooth surface from the visual effect. From the distribution position of the pitting characteristics of the pitting belt on the gear surface, it can be found that the pitting characteristics near the two ends of the gear are significantly higher than the pitting characteristics at the center of the gear surface in both depth and width domains. The main reason may be that the occurrence of the pitting characteristics on the gear surface causes the uneven distribution effect of the meshing force along the tooth width direction, that is, the occurrence of the meshing warping and crisscross The load near the end of the gear increases or decreases suddenly. With the operation and accumulation of the number of cycles, the fatigue pitting characteristics in a large area of the tooth surface at the end of the gear are generated.
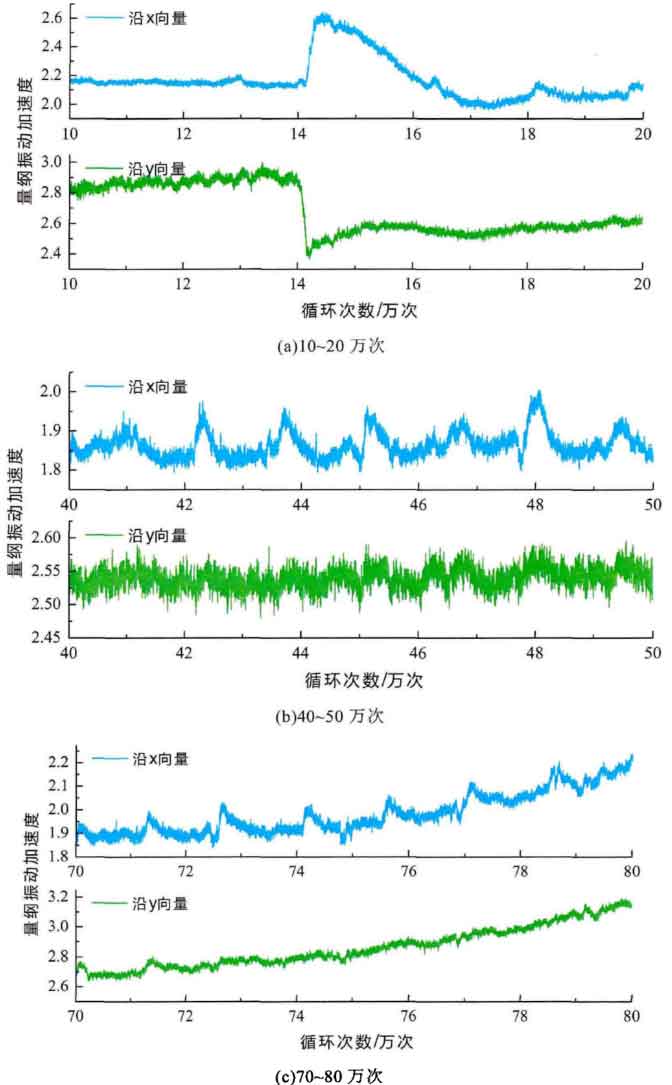
The dynamic response analysis of the measurement system signal is still carried out in the three stages of the last cycle. The time domain signal of vibration acceleration in each stage is shown in Figure 2. It can be seen from the vibration acceleration curve in Figure 2 that the macroscopic performance characteristics of the time domain signals in the three selected stages are not the same. For example, in the 100-200 000 cycles selected in Figure 2 (a), the vibration acceleration amplitude along the two vectors presents a steady change between the 100-140 000 cycles in the early stage. In the 140-160 000 cycles, the vibration acceleration amplitude along the X vector rises sharply and then slows down The amplitude response of the vibration acceleration along the two vectors returns to a relatively stable change within 160000-200000 times. Fig. 2 (b) the amplitude of vibration acceleration has obvious periodic peak effect along the X vector, while the periodic peak effect along the Y vector is not obvious, which may be mainly due to the continuous periodic generation or expansion of the pitting on the tooth surface and the periodic peak effect of the time domain signal caused by the peak wear in the interval caused by the pitting. The conjecture and explanation of the above signals can also be further verified by the periodic change of acceleration time domain signal in Fig. 2 (c). Due to the continuous highlighting of the pitting characteristics of the tooth surface, the amplitude of vibration acceleration at the collected test points presents a gradually rising state, and the signal has not recovered to a stable vibration state for a long time. The above analysis results show that the occurrence or expansion of the fatigue pitting characteristics of the tooth surface can not be compensated by the good lubrication effect of the tooth surface and the deformation of the elastic support such as the shaft and the bearing, so that the vibration response of the system is reduced and the stable operation state is maintained. It further shows that the fatigue pitting characteristics can amplify the vibration response characteristics of the system and aggravate the generation and expansion of the fatigue pitting characteristics of the tooth surface.
The statistical calculation results of time domain signals along different vectors in each stage. The average temperature values of the three stages in the table are basically the same, indicating that the whole gearbox system is in the state of heat balance and energy exchange. According to the calculated values of the statistical indexes, the indexes along the X vector are basically the same, while the indexes along the Y vector increase slightly with the increase of the number of cycles. Among them, the skewness index G10 shows positive skewness, and the kurtosis index is more than 0 in the early operation, and the value distribution is more concentrated. In the later operation, the value is less than 0, and the value distribution is more dispersed. It can be clearly seen from Fig. 2 (c) that the reason for the dispersion of the value distribution is that the amplitude of vibration acceleration presents periodic rise.