
The analysis of transmission error in helical gear pairs is a cornerstone for understanding and mitigating gear whine in automotive transmissions. This internal excitation, defined as the deviation between the theoretical and actual angular position of the driven gear, directly dictates the vibratory and acoustic signature of the gearbox. While design parameters and tooth micro-geometry modifications are primary levers for controlling transmission error, the influence of installation errors—deviations from the ideal spatial alignment of the gear axes—is often a critical, non-ideal factor in real-world applications. These errors, stemming from manufacturing tolerances in gearbox housings and bearing clearances, alter the meshing conditions, potentially exacerbating transmission error fluctuations and consequently, noise and vibration levels. This article presents a comprehensive finite element analysis to systematically quantify the impact of various installation error types—center distance error, axis intersection angle error (shaft angle error), and axis stagger angle error (parallel offset error)—on the quasi-static transmission error of a helical gear pair. The objective is to establish a clear hierarchy of influence among these error types, providing a foundational reference for gear system tolerance design and whine optimization strategies in heavy-duty vehicle transmissions.
Helical gears are favored in automotive transmissions over their spur counterparts due to their smoother and quieter operation, attributed to a gradual engagement process along a helical tooth line. This results in higher contact ratios and reduced dynamic loading.
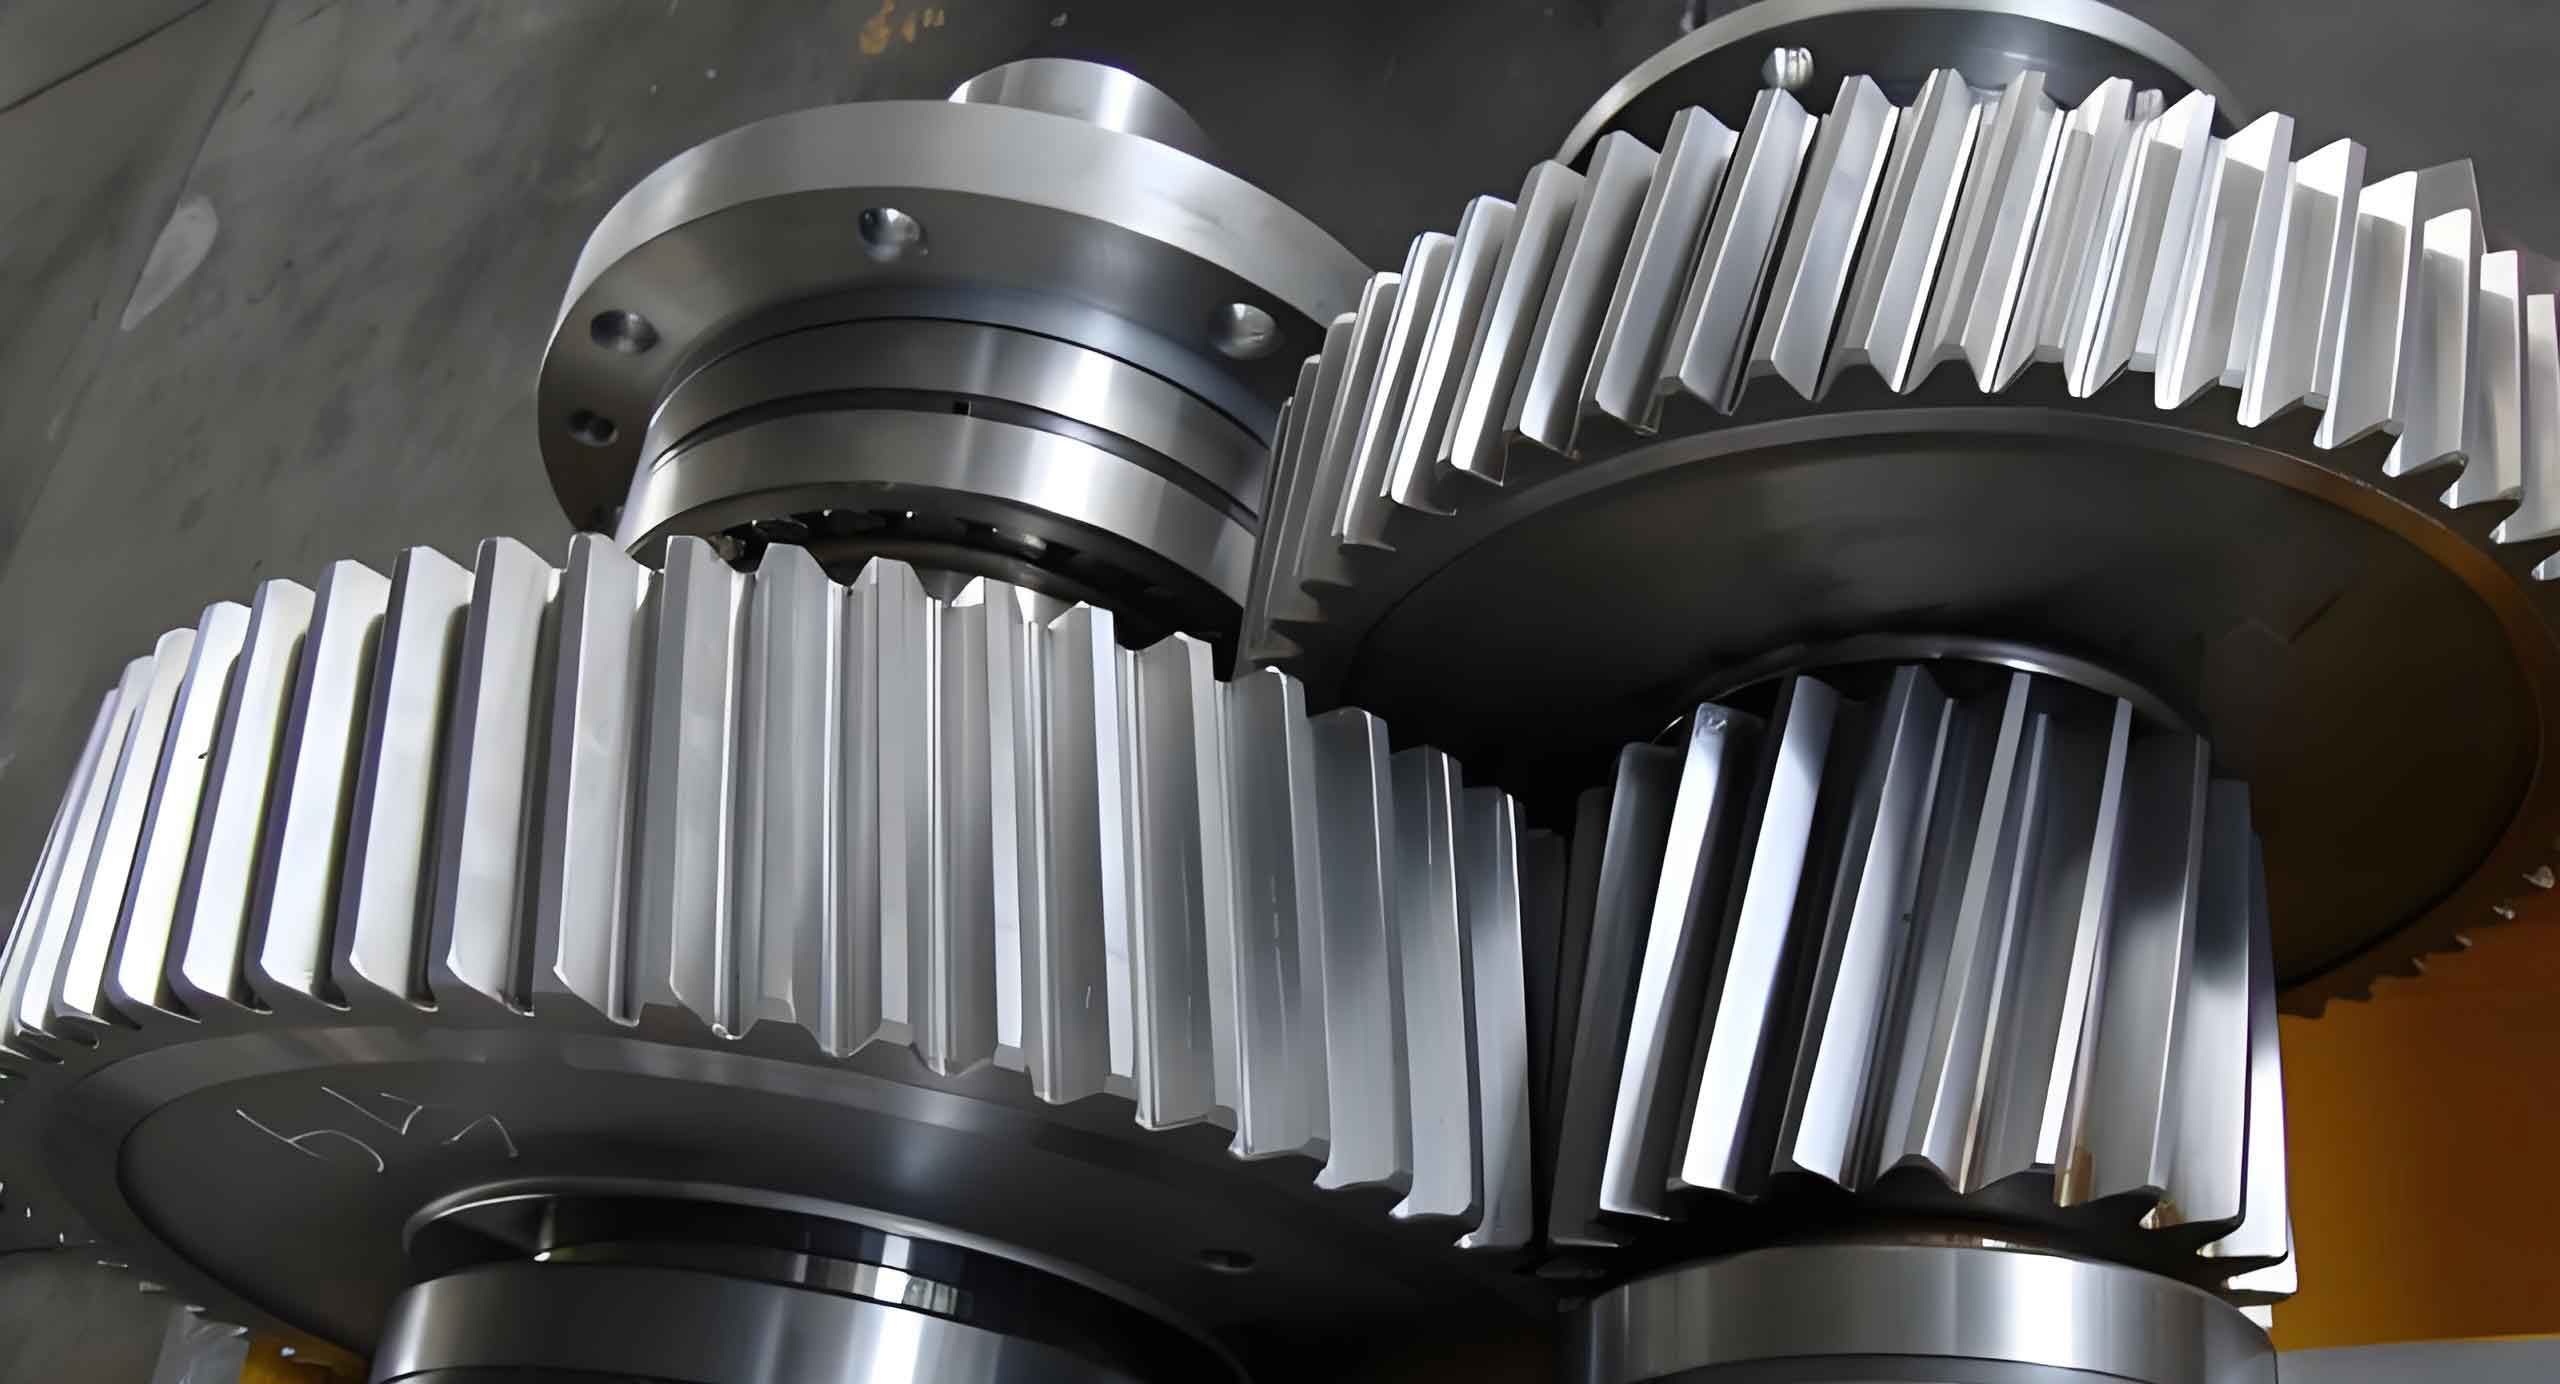
However, this very characteristic makes the performance of helical gears more sensitive to misalignments along and across the axis of rotation. The fundamental parameters governing the geometry and meshing of a helical gear pair are critical for any analytical or numerical study. The macro-geometric parameters for the subject helical gear pair from a heavy-duty commercial vehicle transmission are summarized in Table 1.
| Macro-geometric Parameter | Pinion (Driver) | Gear (Driven) |
|---|---|---|
| Number of Teeth, \(z\) | 34 | 41 |
| Normal Module, \(m_n\) (mm) | 3.55 | 3.55 |
| Normal Pressure Angle, \(\alpha_n\) (deg) | 19 | 19 |
| Helix Angle, \(\beta\) (deg) | 30.7 (Right-hand) | 30.7 (Left-hand) |
| Pitch Diameter, \(d\) (mm) | 140.373 | 169.273 |
| Base Circle Diameter, \(d_b\) (mm) | 130.313 | 157.142 |
| Center Distance, \(a\) (mm) | 155 | |
| Face Width, \(B\) (mm) | 43.5 | 35.5 |
Installation errors in parallel axis helical gear pairs can be fundamentally categorized into three distinct types, each with a unique geometric implication for the meshing condition. These errors are typically defined relative to the ideal axis configuration. A schematic representation aids in understanding their nature, as described below and summarized in Table 2.
- Center Distance Error (\(\Delta a\)): This is a linear offset error along the line connecting the gear centers in the plane containing both axes. It modifies the nominal distance between the axes but does not inherently change the parallelism of the axes. The contact pattern may shift along the tooth profile, but the fundamental line contact nature of helical gear engagement is preserved, albeit under altered pressure angles and potential edge contact scenarios under load.
- Axis Intersection (Shaft) Angle Error (\(\Delta \Sigma\)): This angular error occurs within the plane containing the ideal axes of the two gears (the common plane). It represents a deviation from true parallelism where the projected axes intersect at an angle. This error introduces a deliberate or unintended skew, significantly affecting load distribution across the face width and often localizing contact.
- Axis Stagger (Parallel Offset) Error (\(\Delta E\)): This is a linear offset error perpendicular to the common plane containing the ideal axes. Conceptually, it can be visualized as the two axes remaining parallel but being displaced from each other in a direction perpendicular to their common plane. This error is particularly detrimental as it violates the fundamental requirement for parallel-axis gearing, leading to severe edge contact and a drastic shift from line to point contact, heavily influencing transmission error.
| Error Type | Symbol | Geometric Nature | Primary Effect on Contact |
|---|---|---|---|
| Center Distance | \(\Delta a\) | Linear offset in the common plane | Shifts contact path, alters pressure angle |
| Axis Intersection Angle | \(\Delta \Sigma\) | Angular deviation in the common plane | Causes bias load, face width load imbalance |
| Axis Stagger Angle | \(\Delta E\) | Linear offset perpendicular to common plane | Induces severe edge/point contact, misalignment |
Transmission Error (\(TE\)) is the primary metric for evaluating kinematic precision. It is defined mathematically for a gear pair as:
$$ TE(\phi_1) = \left( \phi_2 – \phi_2^0 \right) – \frac{z_1}{z_2} \left( \phi_1 – \phi_1^0 \right) $$
where \(\phi_1\) and \(\phi_2\) are the actual rotational angles of the pinion and gear, \(\phi_1^0\) and \(\phi_2^0\) are their initial reference angles, and \(z_1\), \(z_2\) are the number of teeth. In practice, the time-domain signal \(TE(t)\) is analyzed, and its peak-to-peak value (\(TE_{pp}\)) is a key indicator of excitation magnitude. For unmodified, high-precision helical gears, \(TE\) is typically small, but installation errors can amplify its fluctuations, making its accurate prediction via finite element analysis crucial.
The foundation of this study is a high-fidelity finite element model constructed to simulate the loaded contact of the helical gear pair. The process begins with precise solid modeling. The involute tooth profile for helical gears is generated based on the parametric equation derived from the base circle roll:
$$ x(u, \theta) = r_b \cos\theta + r_b u \sin\theta $$
$$ y(u, \theta) = r_b \sin\theta – r_b u \cos\theta $$
$$ z(u, \theta) = p \cdot u $$
where \(r_b\) is the base radius, \(\theta\) is the roll angle, \(u\) is a profile parameter, and \(p\) is the helix lead parameter. These equations were implemented to create accurate tooth surfaces, which were then patterned and trimmed to form the solid models of the pinion and gear, followed by virtual assembly at the nominal center distance.
To balance computational efficiency with accuracy, a sub-modeling approach was adopted. Instead of modeling the full ring of teeth, only eight teeth from both the pinion and gear, centered on the initial contact zone, were extracted for analysis. This is justified as only 3-4 tooth pairs are in contact simultaneously for this helical gear pair. A convergence study was performed to determine the optimal mesh density. The final mesh, generated using a dedicated preprocessor, features refined element sizing at critical regions: a fine mesh of 0.1 mm at the tooth root fillets to capture bending stress gradients, a moderate mesh of 0.3 mm along the active tooth profile to resolve contact pressures accurately, and a coarser mesh of 1.0 mm along the face width. The resultant high-quality hex-dominant mesh (C3D8R elements) for a single tooth is dense enough for stress analysis while maintaining manageable solve times. The material assigned is a case-hardening alloy steel (e.g., 20CrNiMo equivalent) with an Elastic Modulus \(E = 207\) GPa, Poisson’s ratio \(\nu = 0.3\), and density \(\rho = 7800\) kg/m³.
| Mesh Region | Element Size (mm) | Element Type | Convergence Criterion |
|---|---|---|---|
| Tooth Root Fillet | 0.1 | C3D8R (8-node linear brick, reduced integration) | Mesh-independent Von Mises stress (variation < 5%) |
| Active Tooth Profile/Flank | 0.3 | ||
| Tooth Face Width & Core | 1.0 |
The contact simulation was set up in a general-purpose finite element solver using an implicit dynamic procedure to handle the non-linear contact conditions effectively. A “hard” contact formulation was enforced in the normal direction, preventing penetration, while a frictionless tangential behavior was assumed, considering well-lubricated conditions. Kinematic coupling constraints (rigid body elements) were applied to tie the inner bore surfaces of both gears to their respective central reference points, RP-Pinion and RP-Gear. The analysis consisted of two steps: a transient ramp step to smoothly apply the pinion drive velocity (\(\omega_1 = 20\) rad/s) and the gear resisting torque (\(T_{load}\)), followed by a steady-state analysis step where both loading conditions were held constant. Since transmission error in this quasi-static analysis is largely independent of speed, a constant moderate speed was chosen for numerical stability. Loads were applied at the reference points: a rotational velocity to RP-Pinion and a moment (torque) to RP-Gear.
Prior to investigating installation errors, the baseline finite element model required validation against established analytical theory. The maximum contact stress at the pitch point under pure rolling conditions serves as an excellent benchmark. According to ISO 6336 standards and Hertzian theory for line contact, the contact stress \(\sigma_H\) for helical gears can be calculated as:
$$ \sigma_H = Z_E Z_H Z_{\epsilon} Z_{\beta} \sqrt{ \frac{F_t}{b d_1} \cdot \frac{u + 1}{u} } = Z_E Z_H Z_{\epsilon} Z_{\beta} \sqrt{ \frac{2 T_1}{b d_1^2} \cdot \frac{u + 1}{u} } $$
where:
- \(Z_E = \sqrt{ \frac{1}{\pi \left( \frac{1-\nu_1^2}{E_1} + \frac{1-\nu_2^2}{E_2} \right) } }\) is the elasticity factor.
- \(Z_H = \sqrt{ \frac{2 \cos\beta_b}{\cos^2\alpha_t \tan\alpha_t’} }\) is the zone factor.
- \(Z_{\epsilon}\) is the contact ratio factor (dependent on transverse \(\epsilon_{\alpha}\) and overlap \(\epsilon_{\beta}\) ratios).
- \(Z_{\beta} = \sqrt{\cos\beta}\) is the helix angle factor.
- \(F_t = 2T_1/d_1\) is the nominal tangential load.
- \(T_1\) is the pinion torque.
- \(b\) is the face width (smaller of the two).
- \(d_1\) is the pinion pitch diameter.
- \(u = z_2/z_1\) is the gear ratio.
The application factor \(K_A\), dynamic factor \(K_V\), face load factor \(K_{H\beta}\), and transverse load factor \(K_{H\alpha}\) were incorporated into a general load factor \(K = K_A K_V K_{H\beta} K_{H\alpha}\) for the theoretical calculation, with values selected as 1.25, 1.0, 1.0, and 1.4 respectively for this heavy-duty application. The validation was performed across a load range of 200 Nm to 1000 Nm. The finite element results for maximum flank pressure in the stable meshing region showed excellent agreement with Hertzian theory, with a maximum deviation of 14.8% at the lowest load (200 Nm) and an error of only 8.0% at the rated load of 1000 Nm. This level of correlation validates the fidelity of the contact modeling approach, including mesh density and material definitions, for subsequent transmission error analysis.
| Load Torque, \(T_{load}\) (Nm) | Hertzian Stress, \(\sigma_H\) (MPa) | FE Max. Stress (MPa) | Deviation (%) |
|---|---|---|---|
| 200 | 467 | 405 | -13.3 |
| 300 | 572 | 535 | -6.5 |
| 400 | 661 | 635 | -3.9 |
| 500 | 739 | 726 | -1.8 |
| 600 | 809 | 800 | -1.1 |
| 700 | 875 | 865 | -1.1 |
| 800 | 935 | 905 | -3.2 |
| 900 | 992 | 935 | -5.7 |
| 1000 | 1046 | 962 | -8.0 |
With the model validated, the analysis focused on transmission error. For the baseline case (no installation error), the transmission error was computed over several mesh cycles under steady-state conditions for load torques from 500 to 1000 Nm. The \(TE(t)\) curves exhibited a characteristic periodic pattern corresponding to the 3-4 tooth pair alternating contact of the helical gears. As expected, the mean level and the amplitude of the \(TE\) fluctuation increased with applied load due to greater tooth deflection. The peak-to-peak value \(TE_{pp}\) served as the key performance indicator for subsequent comparative studies.
The core investigation involved introducing the three types of installation errors independently into the finite element model. Each error was simulated at discrete levels of 5, 10, 15, and 20 μm (for \(\Delta a\) and \(\Delta E\)) or μrad/equivalently projected linear error at gear faces for \(\Delta \Sigma\)). The driven gear’s reference point (RP-Gear) was spatially adjusted relative to the pinion’s reference point to induce the required misalignment, while maintaining the coupling of loads and boundary conditions. A constant load torque of 1000 Nm was used for all misalignment cases to isolate the effect of the geometric error.
1. Effect of Center Distance Error (\(\Delta a\)): Introducing a center distance error shifts the line of action but maintains a form of line contact. The simulated \(TE\) curves for different \(\Delta a\) values showed that while the basic waveform shape was similar to the baseline, both the absolute magnitude and the peak-to-peak fluctuation increased progressively with larger \(\Delta a\). A positive error (increased center distance) generally reduces the pressure angle and can lead to a shift of contact towards the tooth tip or root depending on the direction, altering the effective composite tooth stiffness and hence the \(TE\).
2. Effect of Axis Intersection (Shaft) Angle Error (\(\Delta \Sigma\)): This error breaks the parallelism within the common plane, causing the contact pattern to bias towards one end of the face width. The finite element results demonstrated a more pronounced impact on \(TE\) compared to center distance error. The \(TE\) waveform became asymmetrical, and its peak-to-peak value increased significantly as \(\Delta \Sigma\) grew. This is due to the severe load concentration at one edge of the gear teeth, creating a highly non-uniform deflection pattern along the contact lines of the helical gears, which directly translates into larger kinematic error.
3. Effect of Axis Stagger (Parallel Offset) Error (\(\Delta E\)): This error is geometrically the most severe, as it forces the axes out of their parallel relationship in a direction where the gear geometry provides no compensation. The contact degenerates from a full line to a localized point or very short line at the edge of the teeth. The finite element analysis revealed the most dramatic impact on transmission error. The \(TE\) curves exhibited large, abrupt fluctuations, and the \(TE_{pp}\) values surged dramatically with increasing \(\Delta E\). The misalignment induced by this error creates a large component of “off-line-of-action” loading, causing significant twisting and uneven deflection, which is directly reflected as high-magnitude transmission error.
To objectively compare the influence of the three error types, the peak-to-peak transmission error (\(TE_{pp}\)) was extracted from each simulation and plotted against the magnitude of the imposed error. The results are summarized in Table 5 and the trend is clear. The axis stagger angle error (\(\Delta E\)) has the most profound and severe impact on \(TE_{pp}\), causing the steepest increase. The axis intersection angle error (\(\Delta \Sigma\)) also shows a strong, nearly linear degrading influence. In contrast, the center distance error (\(\Delta a\)) exhibits the mildest effect on \(TE_{pp}\) over the investigated range. While still detrimental, its contribution to excitation increase is substantially lower than that of the two parallelism errors for equivalent error magnitudes.
| Error Magnitude | \(TE_{pp}\) for \(\Delta a\) (μm) | \(TE_{pp}\) for \(\Delta \Sigma\) (equiv. μm) | \(TE_{pp}\) for \(\Delta E\) (μm) | Notes |
|---|---|---|---|---|
| 0 (Baseline) | 12.5 | 12.5 | 12.5 | Reference value |
| 5 | 13.1 | 15.8 | 24.7 | \(\Delta E\) shows ~2x increase over baseline at 5μm |
| 10 | 13.7 | 19.3 | 38.5 | \(\Delta E\) impact is dominant and non-linear |
| 15 | 14.4 | 22.9 | 54.9 | \(\Delta \Sigma\) shows strong linear trend |
| 20 | 15.2 | 26.8 | 73.1 | \(\Delta a\) has the gentlest slope of increase |
The analysis can be formalized by considering the sensitivity of \(TE_{pp}\) to each error. A simplified linearized sensitivity coefficient \(S\) can be defined for the range studied:
$$ S_{err} = \frac{\Delta TE_{pp}}{\Delta err} $$
Based on the data from 0 to 20 μm error magnitude:
$$ S_{\Delta a} \approx \frac{15.2 – 12.5}{20} = 0.135 \ \mu m/ \mu m $$
$$ S_{\Delta \Sigma} \approx \frac{26.8 – 12.5}{20} = 0.715 \ \mu m/ \mu m $$
$$ S_{\Delta E} \approx \frac{73.1 – 12.5}{20} = 3.03 \ \mu m/ \mu m $$
This quantifies the hierarchy: The transmission error of this helical gear pair is approximately 5.3 times more sensitive to axis intersection angle error (\(\Delta \Sigma\)) and 22.4 times more sensitive to axis stagger error (\(\Delta E\)) than it is to center distance error (\(\Delta a\)) for equivalent error magnitudes in the micrometer range. This highlights the critical importance of controlling parallelism errors (both in-plane and out-of-plane) during the installation of helical gears to manage gear whine excitation.
In conclusion, this detailed finite element investigation systematically elucidates the distinct impacts of three fundamental installation errors on the transmission error of a heavy-duty vehicle helical gear pair. The model, validated against Hertzian contact theory, proved to be a reliable tool for this parametric study. The key finding is a clear hierarchy of influence: axis stagger (parallel offset) error exerts the most detrimental effect on transmission error peak-to-peak value, followed by axis intersection (shaft angle) error, while center distance error presents the least sensitivity within the practical error range considered. This implies that for gear whine control, manufacturing and assembly tolerances related to gear housing bore parallelism (controlling both \(\Delta \Sigma\) and \(\Delta E\)) are far more critical than those for the nominal center distance. Future work could involve studying the combined effects of multiple errors, incorporating dynamic effects, and exploring optimal micro-geometry modifications tailored to compensate for expected installation error ranges in helical gear systems.