
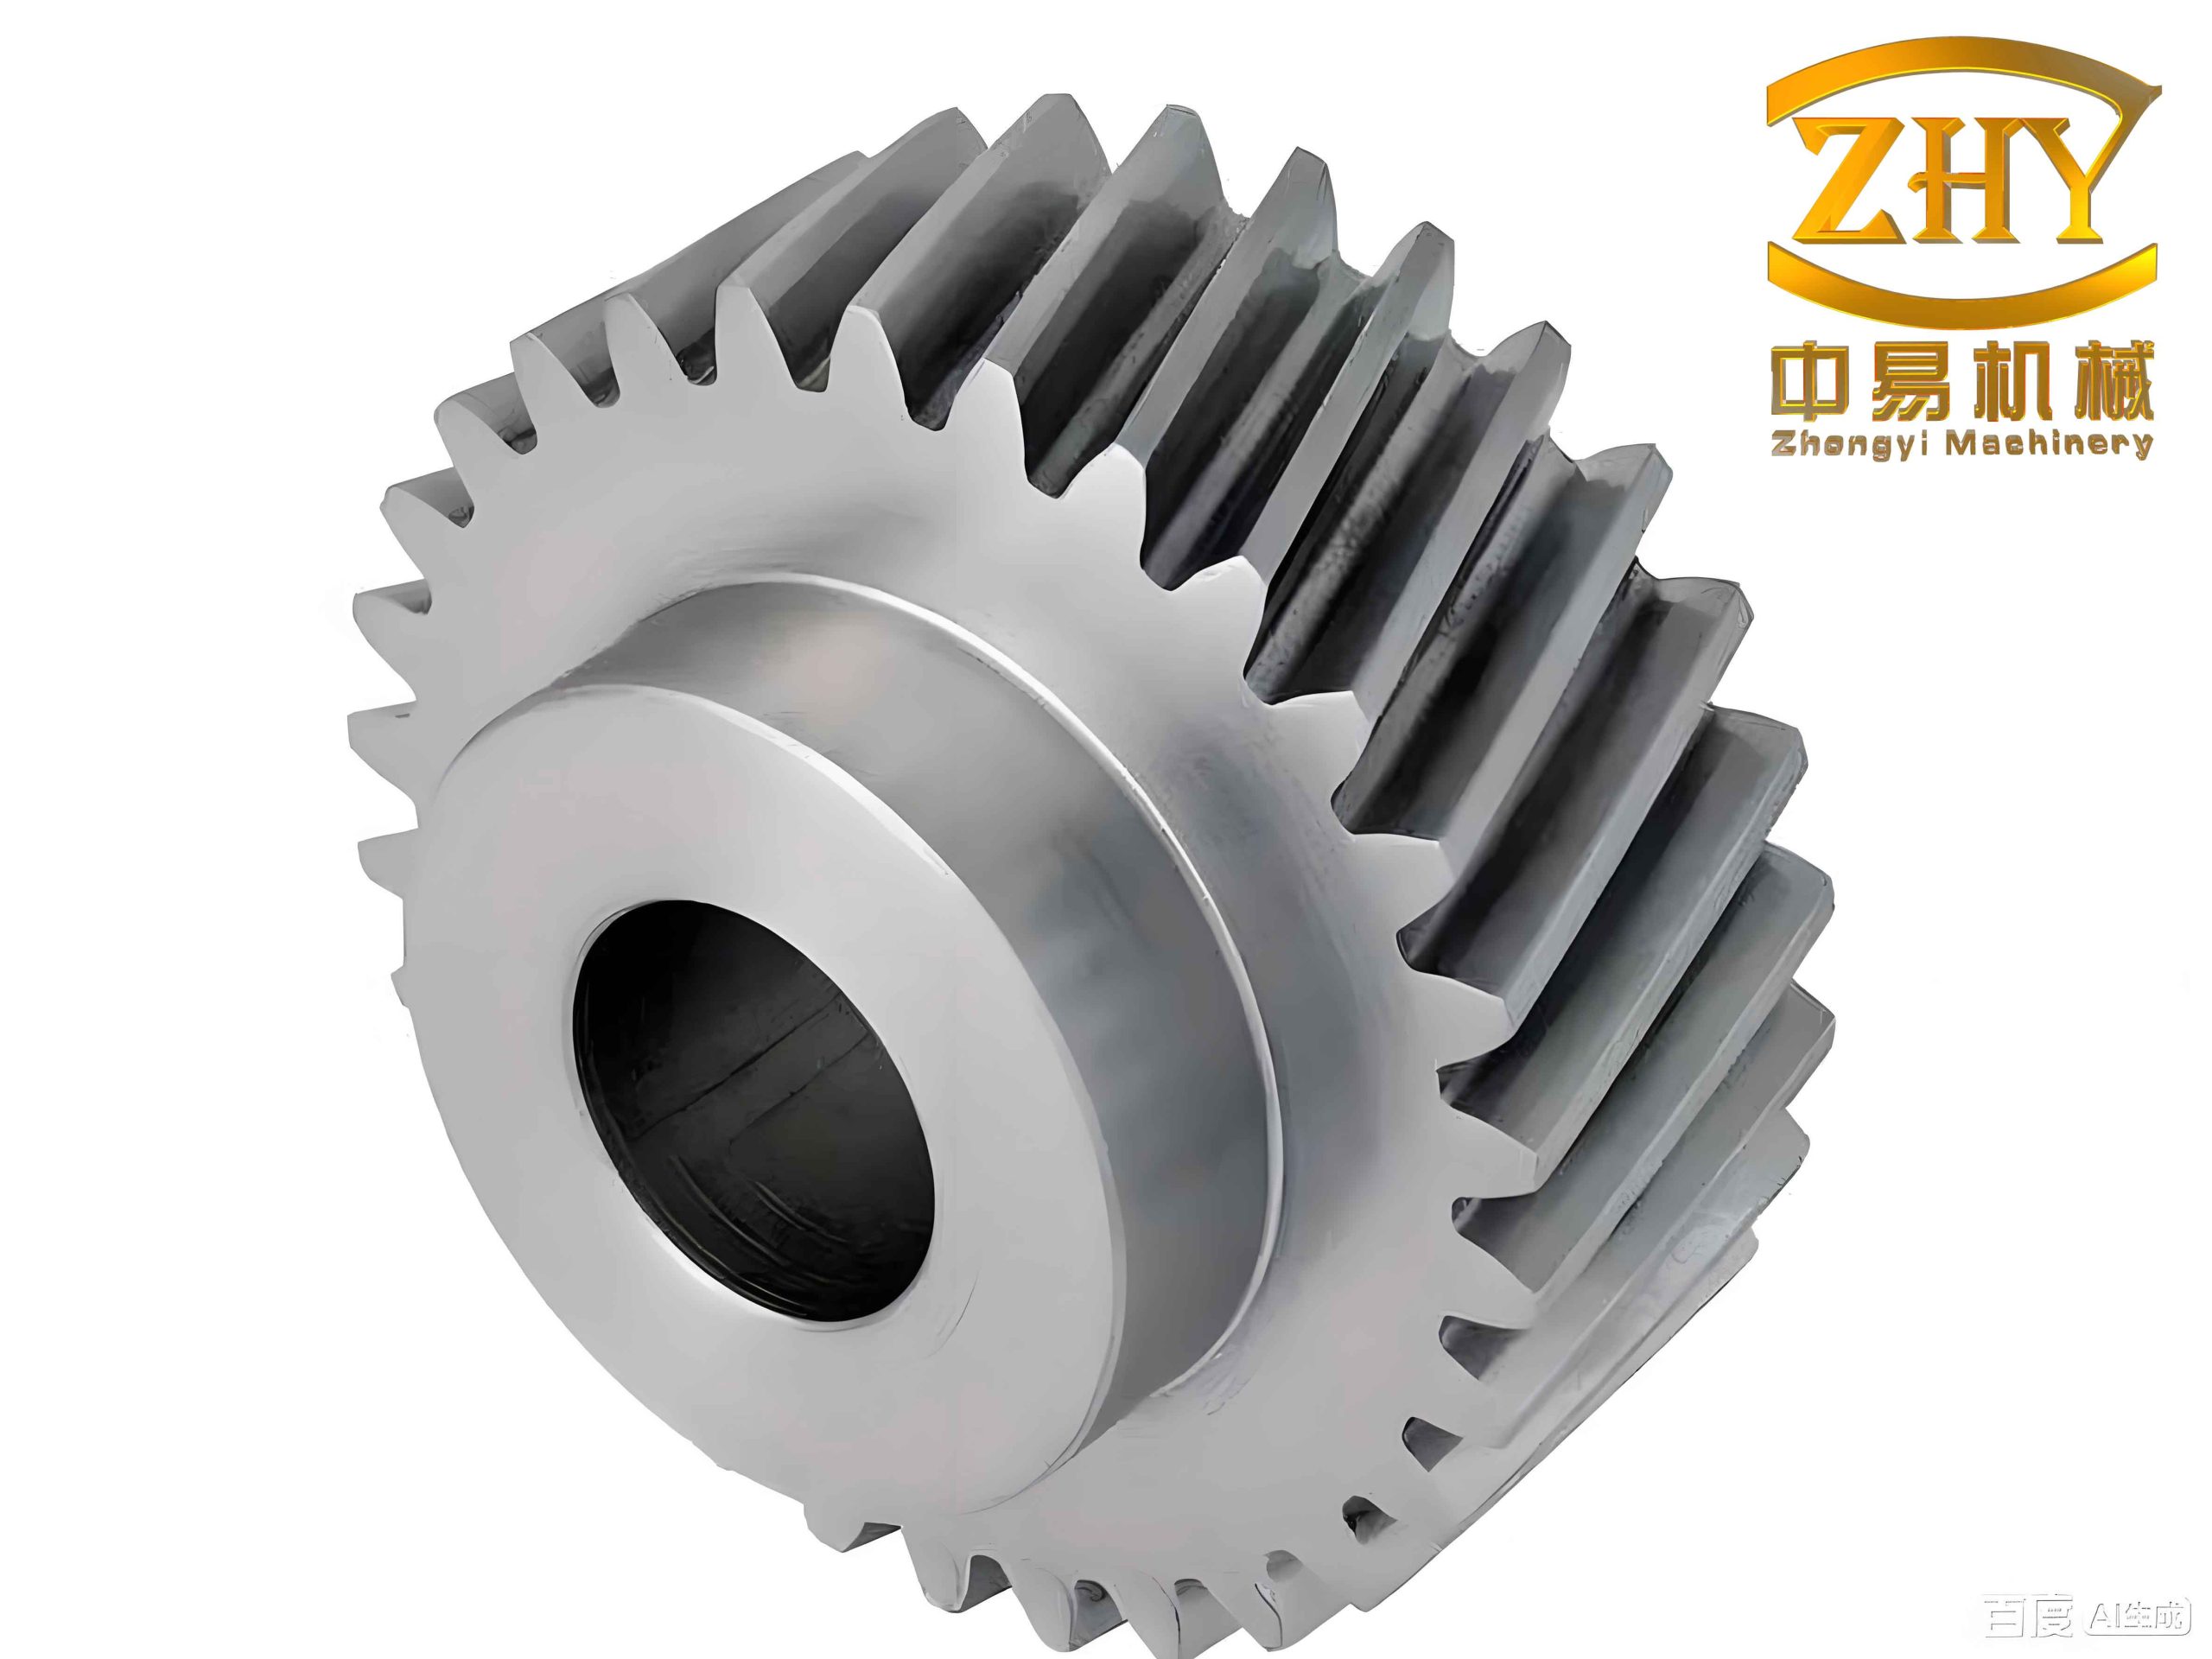
In my research, I investigated the carburizing and quenching behavior of a complex helical gear used in electric-vehicle transmission systems. I focused on a helical gear made from 20CrMnTiH steel because this material is widely used for transmission components that require a hard, wear-resistant surface and a tough, ductile core. I treated the helical gear as a full three-dimensional body because the tooth count and the arrangement of lightening holes do not permit a simplified periodic sector model. The central problem I addressed was the coupled evolution of temperature, carbon diffusion, phase transformation, stress, strain, hardness, and distortion during carburizing and quenching. I combined finite-element simulation with experimental characterization to verify the model, and I then used the verified model to study how process parameters influence the final performance of the helical gear. Finally, I optimized the carburizing and quenching process by orthogonal experiments and a back-propagation neural network. Throughout this work, I repeatedly verified that the deformation of the helical gear is not controlled by a single factor but by a strongly coupled thermal-metallurgical-mechanical response.
1. Research Background and Engineering Significance
I began from the observation that electric vehicles require transmission systems with high speed, high torque density, low noise, and long fatigue life. A helical gear is one of the most important components in such a transmission because it transmits torque smoothly and distributes load over multiple teeth. However, the same helical gear must survive severe contact fatigue, bending fatigue, wear, and impact loading. Carburizing and quenching remain among the most effective industrial routes for improving the surface hardness, wear resistance, and core toughness of a helical gear. In my study, the helical gear was designed to achieve a case depth, surface hardness, core hardness, and distortion level that satisfy the production requirements summarized in Table 1.
| Performance item | Requirement |
|---|---|
| Effective case depth | 0.40–0.85 mm |
| Surface hardness | 680–850 HV1 |
| Core hardness | 320–480 HV1 |
| Ground surface hardness | ≥650 HV1 |
I recognized that the main technical difficulty is not simply obtaining a carburized layer. The difficult issue is controlling the distortion of the helical gear while maintaining the required hardness and case depth. During carburizing, carbon diffuses into the surface and changes the local hardenability. During quenching, the helical gear experiences rapid cooling, non-uniform heat extraction, martensitic transformation, and volume changes. These phenomena generate thermal stress, transformation stress, and transformation plasticity. The resulting distortion of the helical gear can exceed the grinding allowance or cause unacceptable transmission error. Therefore, I treated the helical gear as a coupled multi-field problem rather than as a simple heat-treatment schedule.
I also considered the industrial reality that trial-and-error process development for a large helical gear is expensive and slow. A full experimental matrix involving carburizing temperature, boost time, diffusion time, and cooling rate would require many furnace cycles. For this reason, I used a verified numerical model to expand the experimental data set. The simulation allowed me to evaluate many combinations of process parameters and to identify the dominant factors affecting the helical gear. I then used optimization methods to reduce distortion and helical line total deviation while keeping hardness and case depth within specification.
2. Factors Influencing Distortion of the Helical Gear
I classified the factors that influence distortion of the helical gear into material factors, process factors, and structural or fixture factors. The material factors include chemical composition, hardenability, original microstructure, banded structure, grain size, and segregation. The process factors include carburizing temperature, carbon potential, boost time, diffusion time, quenching temperature, cooling rate, quenching medium, agitation, and tempering. The structural factors include tooth geometry, web thickness, hole pattern, section transitions, and the mass distribution of the helical gear. The fixture factors include loading position, support conditions, stacking, and constraints. I summarized the main categories in Table 2.
| Category | Typical factors | Effect on the helical gear |
|---|---|---|
| Material | C, Mn, Cr, Ti, Si, P, S; hardenability; grain size; banded structure | Changes Ms temperature, volume change, and local transformation kinetics |
| Carburizing | Temperature, carbon potential, boost time, diffusion time | Controls carbon profile, case depth, and surface hardenability |
| Quenching | Cooling rate, oil temperature, agitation, heat-transfer coefficient | Controls thermal gradients and martensite formation sequence |
| Geometry | Tooth count, helix angle, web, holes, section thickness | Creates non-uniform cooling and stiffness distribution |
| Fixture and loading | Support points, stacking, constraints, gravity direction | Introduces external constraint stresses during heating and cooling |
I found that the material composition of 20CrMnTiH steel has a strong influence on the response of the helical gear. The carbon content controls the martensite start temperature and the hardness after quenching. Chromium and manganese increase hardenability, while titanium refines the austenite grain size by forming stable carbonitrides. Silicon contributes to solid-solution strengthening but can also affect transformation kinetics. Phosphorus and sulfur are kept low to avoid embrittlement and inclusion-related cracking. The chemical composition I used is given in Table 3.
| Element | C | Cr | Mn | Ti | Si | P | S | Fe |
|---|---|---|---|---|---|---|---|---|
| wt.% | 0.184 | 1.21 | 0.993 | 0.054 | 0.224 | 0.012 | 0.008 | Balance |
I also observed that the initial microstructure of the helical gear before carburizing consisted of ferrite and pearlite. The ferrite and pearlite were arranged in a weakly banded pattern. This banded structure can cause local differences in carbon diffusion and hardenability. When the helical gear is quenched, the banded regions may transform at different times or to different products, producing local stress concentrations. In my model, I therefore retained the material response as a function of local carbon content, temperature, and phase state rather than assuming a homogeneous transformation.
3. Finite-Element Model of the Helical Gear
I constructed the finite-element model in several stages. First, I generated the three-dimensional geometry of the helical gear. Then I imported the geometry into a preprocessor and created a hexahedral mesh. Next, I assigned material properties, boundary conditions, and load steps that represent carburizing, diffusion, cooling, and quenching. Finally, I solved the coupled thermal-diffusion-metallurgical-mechanical equations with COSMAP. I used the full helical gear model because the tooth count is odd and the holes are arranged with even symmetry, so a half-tooth or sector model would not accurately represent the interaction between the teeth, web, and holes.
| Item | Value |
|---|---|
| Tooth count | 65 |
| Lightening holes | 8 |
| Model type | Full three-dimensional helical gear |
| Element type | Hexahedral |
| Element size near tooth profile | Approximately 0.75 mm |
| Number of elements | 115,430 |
| Number of nodes | 144,726 |
I performed a mesh sensitivity check using a cubic reference domain. I compared carbon concentration profiles obtained with element sizes of 1.5 mm, 1.0 mm, and 0.67 mm. The results showed that 1.5 mm produced noticeable error, while 1.0 mm and 0.67 mm gave nearly identical profiles. Therefore, I selected a local mesh size of approximately 0.75 mm near the tooth profile of the helical gear. This choice provided good accuracy while keeping the computational cost reasonable.
I applied three types of boundary conditions to the helical gear model: thermal boundary conditions, carbon diffusion boundary conditions, and mechanical constraints. The thermal boundary condition allowed heat exchange between the helical gear surface and the furnace or quenchant. The carbon boundary condition allowed carbon flux between the atmosphere and the surface. The mechanical constraints prevented rigid-body motion but allowed thermal expansion and phase transformation strain to develop naturally. I did not over-constrain the helical gear because artificial constraints can suppress or exaggerate distortion.
3.1 Thermal Field
I modeled the temperature field using the transient heat-conduction equation. The local temperature of the helical gear depends on heat conduction, internal heat generation from phase transformation, and heat exchange with the environment. The governing equation I used is
$$
\rho(T,C)c_p(T,C)\frac{\partial T}{\partial t}
=
\nabla \cdot \left[k(T,C)\nabla T\right]
+
q_{\mathrm{lat}}
+
q_{\mathrm{def}}
$$
where \(T\) is temperature, \(\rho\) is density, \(c_p\) is specific heat, \(k\) is thermal conductivity, \(q_{\mathrm{lat}}\) is latent heat from phase transformation, and \(q_{\mathrm{def}}\) is heat generated by deformation. The thermal boundary condition on the surface of the helical gear is
$$
-k\frac{\partial T}{\partial n}
=
h_T\left(T-T_\infty\right)
$$
where \(h_T\) is the heat-transfer coefficient and \(T_\infty\) is the ambient or quenchant temperature. I used a temperature-dependent heat-transfer coefficient to represent oil quenching. This coefficient first increases as the vapor film collapses, reaches a peak during nucleate boiling, and then decreases as the surface cools.
3.2 Carbon Diffusion Field
I modeled carbon diffusion in the helical gear using Fick’s second law. The local carbon concentration changes with diffusion and with the boundary flux from the carburizing atmosphere. The equation I used is
$$
\frac{\partial C}{\partial t}
=
\nabla \cdot \left[D_C(T,C)\nabla C\right]
$$
where \(C\) is carbon concentration and \(D_C\) is the carbon diffusion coefficient. I described the temperature dependence of the diffusion coefficient with an Arrhenius-type relation:
$$
D_C(T,C)
=
D_0 \exp\left(-\frac{Q_C}{RT}\right)
$$
Here \(D_0\) is the pre-exponential factor, \(Q_C\) is the activation energy, and \(R\) is the gas constant. The surface carbon flux is controlled by the difference between the atmosphere carbon potential and the surface carbon concentration:
$$
-D_C\frac{\partial C}{\partial n}
=
\beta_C\left(C_g-C_s\right)
$$
where \(\beta_C\) is the surface reaction coefficient, \(C_g\) is the carbon potential of the atmosphere, and \(C_s\) is the carbon concentration at the surface of the helical gear. I used a high carbon potential during the boost stage and a lower carbon potential during the diffusion stage. This schedule allowed a gradual carbon profile and avoided excessive retained austenite or carbide networks at the surface of the helical gear.
3.3 Phase Transformation Field
I represented the microstructure of the helical gear as a mixture of austenite, ferrite, pearlite, bainite, and martensite. The phase fractions must satisfy
$$
\sum_{I=1}^{N}\xi_I = 1
$$
and the local value of any mixture property \(X\) is
$$
X = \sum_{I=1}^{N}X_I\xi_I
$$
where \(\xi_I\) is the volume fraction of phase \(I\) and \(X_I\) is the property of that phase. For martensitic transformation, I used a Koistinen–Marburger-type relation:
$$
\xi_M = 1-\exp\left[-\alpha\left(M_s-T\right)\right]
$$
where \(\xi_M\) is the martensite volume fraction, \(\alpha\) is a material constant, \(M_s\) is the martensite start temperature, and \(T\) is the current temperature. The martensite start temperature depends on carbon and alloy content. I used a relation of the form
$$
M_s
=
561
–
474C
–
33Mn
–
17Cr
–
17Ni
–
21Mo
$$
For diffusion-controlled transformations such as bainite formation, I used a Johnson–Mehl–Avrami–Kolmogorov-type equation:
$$
\xi_B
=
1-\exp\left[-\left(\frac{t}{\tau(T)}\right)^n\right]
$$
where \(\xi_B\) is the bainite fraction, \(t\) is time, \(\tau(T)\) is a temperature-dependent time constant, and \(n\) is the Avrami exponent. I allowed the transformation kinetics to depend on local carbon content and stress because both factors shift the transformation start and completion temperatures in the helical gear.
3.4 Stress and Strain Field
I decomposed the total strain in the helical gear into elastic, plastic, thermal, transformation, and transformation-plasticity contributions:
$$
\varepsilon_{ij}
=
\varepsilon_{ij}^{e}
+
\varepsilon_{ij}^{p}
+
\varepsilon_{ij}^{th}
+
\varepsilon_{ij}^{tr}
+
\varepsilon_{ij}^{tp}
$$
The elastic strain is related to stress by Hooke’s law:
$$
\sigma_{ij}
=
C_{ijkl}^{e}\varepsilon_{kl}^{e}
$$
The thermal strain is
$$
\varepsilon_{ij}^{th}
=
\alpha(T,C)\left(T-T_0\right)\delta_{ij}
$$
where \(\alpha\) is the thermal expansion coefficient and \(T_0\) is the reference temperature. The transformation strain caused by the volume difference between phases is
$$
\varepsilon_{ij}^{tr}
=
\sum_{I=1}^{N}\beta_I\xi_I\delta_{ij}
$$
where \(\beta_I\) is the transformation expansion coefficient of phase \(I\). The transformation plasticity strain is
$$
\varepsilon_{ij}^{tp}
=
\sum_{I=1}^{N}k_I\xi_I\left(1-\xi_I\right)s_{ij}
$$
where \(k_I\) is the transformation plasticity coefficient and \(s_{ij}\) is the deviatoric stress. I considered transformation plasticity essential because it strongly affects the final distortion of the helical gear during quenching. Plastic yielding was described by a temperature- and phase-dependent yield function:
$$
f\left(\sigma_{ij},\kappa,T,\xi_I,C\right)=0
$$
and the plastic strain increment followed the associated flow rule:
$$
\varepsilon_{ij}^{p}
=
\lambda\frac{\partial f}{\partial \sigma_{ij}}
$$
This coupled formulation allowed me to capture the interaction between thermal contraction, martensite expansion, plasticity, and the final shape of the helical gear.
3.5 Hardness Prediction
I estimated the hardness of the helical gear from the local phase mixture and carbon content. A general form of the hardness rule is
$$
H
=
\sum_{I=1}^{N}H_I\xi_I
+
\Delta H_C
+
\Delta H_{\sigma}
$$
where \(H_I\) is the hardness of phase \(I\), \(\Delta H_C\) is the hardness contribution from carbon in solid solution, and \(\Delta H_{\sigma}\) is a correction for residual stress and substructure. I calibrated this rule against measured microhardness data. The predicted hardness was then used to determine the effective case depth, which I defined as the depth at which the hardness falls to 550 HV1. For the helical gear, this depth is a critical quality characteristic because it controls load-bearing capacity and fatigue resistance.
4. Experimental Verification of the Model
I designed an experimental program to verify the finite-element model. The helical gear was carburized and quenched in a continuous carburizing furnace. I measured the carbon profile by the layer-removal method, observed the microstructure by optical microscopy and scanning electron microscopy, measured the microhardness profile, and measured the distortion and helical line total deviation. I then compared the experimental results with the simulated results.
| Stage | Condition | Duration | Carbon potential |
|---|---|---|---|
| Heating | Heating to 1168.15 K | 81 min | 1.00% |
| Boost | 1168.15 K | 162 min | 1.00% |
| Diffusion | 1158.15 K | 45 min | 0.86% |
| Pre-quench hold | 1108.15 K | 54 min | 0.76% |
| Quenching | Oil quench to room temperature | Varies | — |
I found that the carbon concentration decreased from the surface toward the core of the helical gear. The maximum surface carbon concentration was approximately 0.756 wt.%, and the carbon concentration approached the base value of about 0.21 wt.% at a depth of approximately 1.2 mm. The effective case depth was approximately 0.75 mm. The measured and simulated carbon profiles agreed well, which confirmed that my diffusion model and boundary conditions were reasonable.
| Quantity | Measured | Simulated | Deviation |
|---|---|---|---|
| Surface carbon content | 0.756 wt.% | Approximately 0.76 wt.% | Small |
| Effective case depth | Approximately 0.75 mm | Approximately 0.75 mm | Small |
| Maximum surface hardness | Approximately 778 HV1 | 741–745.5 HV1 | <5% |
| Core hardness | Approximately 355 HV1 | Within predicted range | Reasonable |
| Helical line total deviation \(F_\beta\) | 5.1–36.9 µm | 6.3–24.3 µm | Comparable trend |
I observed that the carburized layer of the helical gear consisted mainly of fine acicular martensite with a small amount of retained austenite. The measured martensite content was very high, and the retained austenite content was low. The core region contained low-carbon lath martensite and a small amount of lower bainite. This microstructure distribution is consistent with the carbon profile and the cooling rate in different regions of the helical gear. The fine martensite in the case indicates that the austenite grain size was well controlled, which is beneficial for strength and fatigue resistance.
I also examined the hardness profile from the surface to the core of the helical gear. The hardness decreased gradually with depth. The highest hardness appeared at the surface, and the hardness dropped rapidly between approximately 0.4 mm and 1.2 mm. At depths greater than approximately 1.2 mm, the hardness decreased more slowly and eventually approached the core hardness. The effective case depth based on the 550 HV1 criterion was approximately 0.75 mm, which agrees with the measured carbon profile and the simulated phase distribution.
I measured the distortion of the helical gear at four tooth positions and compared the results with the simulation. The maximum distortion in the simulation occurred near the top end face, while the minimum distortion occurred near the mid-radius region. The helical line total deviation \(F_\beta\) was used as an engineering distortion index. I found that the simulated \(F_\beta\) values followed the same trend as the measured values. The average measured and simulated values were both approximately 15 µm, which confirmed that the model can predict the distortion tendency of the helical gear.
I attributed the non-uniform distortion of the helical gear to non-uniform cooling. During oil quenching, the vapor film at different surfaces of the helical gear ruptures at different times. The outer end face cools faster than the inner regions, and the tooth flank cools differently from the web. The resulting temperature difference produces non-uniform thermal stress, which is followed by non-uniform martensitic transformation and transformation stress. The combination of these stresses produces the final distortion pattern. This explains why the helical gear does not simply shrink or expand uniformly during quenching.
5. Parametric Study of Carburizing and Quenching
After validating the model, I used it to study the influence of carburizing temperature, boost time, diffusion time, and cooling rate on the performance of the helical gear. I evaluated carbon profile, case depth, martensite fraction, retained austenite fraction, surface hardness, distortion, and helical line total deviation \(F_\beta\). This parametric study provided the data set required for process optimization.
5.1 Influence of Holding Time
I varied the boost time and diffusion time of the carburizing stage. The boost time was set to 132 min, 162 min, and 212 min, while the diffusion time was set to 30 min, 45 min, and 60 min. I found that longer holding times increased the depth of carbon diffusion into the helical gear. The case depth ranged from approximately 0.63 mm to 0.82 mm. The boost time had a slightly stronger effect on case depth than the diffusion time. A longer boost time increased the surface carbon supply, while a longer diffusion time flattened the carbon profile. Table 7 summarizes the results.
| Boost time (min) | Diffusion time (min) | Case depth (mm) | Martensite (wt.%) | Hardness (HV1) | Distortion (µm) | \(F_\beta\) (µm) |
|---|---|---|---|---|---|---|
| 132 | 30 | 0.63 | 98.515 | 741.4 | 45.58 | 13.23 |
| 132 | 45 | 0.67 | 98.580 | 742.0 | 44.78 | 14.56 |
| 132 | 60 | 0.70 | 98.625 | 741.0 | 49.26 | 15.30 |
| 162 | 30 | 0.69 | 98.767 | 742.0 | 49.24 | 14.91 |
| 162 | 45 | 0.72 | 98.783 | 743.0 | 47.40 | 14.70 |
| 162 | 60 | 0.73 | 98.812 | 741.9 | 45.03 | 13.97 |
| 212 | 30 | 0.78 | 98.884 | 743.0 | 46.50 | 13.91 |
| 212 | 45 | 0.80 | 98.904 | 744.6 | 45.00 | 13.13 |
| 212 | 60 | 0.82 | 98.927 | 745.5 | 43.30 | 12.10 |
I observed that the martensite content increased slightly as the holding time increased, while the retained austenite content decreased. The change in surface hardness was small because the martensite content was already high in all cases. The maximum difference in martensite content between the shortest and longest holding schedules was only about 0.41 wt.%. Therefore, I concluded that holding time primarily controls case depth and carbon profile rather than the final surface hardness of the helical gear. However, holding time still influences distortion because a deeper carburized layer changes the volume expansion and transformation stress during quenching.
5.2 Influence of Carburizing Temperature
I studied carburizing temperatures of 885 °C, 895 °C, 900 °C, 910 °C, and 920 °C. Increasing the carburizing temperature increased the carbon diffusion coefficient and produced a smoother carbon profile. The case depth increased from approximately 0.72 mm at 885 °C to approximately 0.77 mm at 920 °C. However, the martensite fraction and surface hardness were nearly unchanged. This result indicates that temperature mainly affects carbon transport and case depth, while the final martensite fraction is controlled more strongly by the cooling rate and the local carbon content. Table 8 shows the results.
| Carburizing temperature (°C) | Case depth (mm) | Martensite (wt.%) | Hardness (HV1) | Distortion (µm) | \(F_\beta\) (µm) |
|---|---|---|---|---|---|
| 885 | 0.72 | 98.763 | Approximately 743 | 42.46 | 11.51 |
| 895 | 0.73 | 98.763 | Approximately 743 | 47.40 | 14.70 |
| 900 | 0.73 | 98.763 | Approximately 743 | 43.63 | 12.57 |
| 910 | 0.74 | 98.763 | Approximately 743 | 39.17 | 10.18 |
| 920 | 0.77 | 98.815 | Approximately 743 | 45.62 | 13.68 |
I found that the distortion of the helical gear did not change monotonically with carburizing temperature. The minimum distortion and minimum helical line total deviation occurred at 910 °C in this set of simulations. I attributed this behavior to the combined effect of carbon profile, austenite grain size, and thermal gradient. A higher carburizing temperature increases carbon diffusion and may coarsen the austenite grain size, but it also changes the temperature distribution before quenching. The interaction of these factors produces a non-monotonic distortion response. This is an important finding because it shows that simply lowering the carburizing temperature does not necessarily minimize distortion of the helical gear.
5.3 Influence of Cooling Rate
I controlled the cooling rate by changing the surface heat-transfer coefficient during oil quenching. I used five heat-transfer coefficient curves, labeled H1, H2, H3, H4, and H5. H2 and H3 represented slower cooling than H1, while H4 and H5 represented faster cooling than H1. I found that the cooling rate had a much stronger effect on distortion and phase transformation than the carburizing temperature or holding time. Table 9 summarizes the results.
| Cooling condition | Martensite (wt.%) | Retained austenite (wt.%) | Hardness (HV1) | Distortion (µm) | \(F_\beta\) (µm) |
|---|---|---|---|---|---|
| H1 | 98.763 | 1.237 | 743.0 | 47.40 | 14.70 |
| H2 | 96.737 | 3.263 | 736.5 | 74.30 | 54.00 |
| H3 | 97.734 | 2.266 | 728.9 | 69.12 | 58.91 |
| H4 | 98.886 | 1.114 | 745.7 | 42.24 | 8.66 |
| H5 | 98.756 | 1.244 | 743.0 | 53.88 | 23.70 |
I observed that slower cooling, represented by H2 and H3, produced lower martensite fractions and higher retained austenite fractions. These conditions also produced larger distortion and much larger helical line total deviation. Faster cooling, represented by H4 and H5, produced high martensite fractions and high hardness. However, the fastest cooling did not always produce the minimum distortion. The minimum distortion and minimum \(F_\beta\) occurred under H4. I explained this by the balance between thermal stress and transformation stress. When the cooling rate is very high, thermal gradients are large, but martensitic transformation occurs more uniformly and at a lower temperature. When the cooling rate is too low, transformation occurs over a wider temperature range and the helical gear experiences prolonged stress accumulation. The H4 condition provided the best compromise for the helical gear.
I also found that the cooling rate affects not only the magnitude of distortion but also the distortion pattern along the helix. For slower cooling, the distortion varied more strongly from one end of the helical gear to the other. For faster cooling, the distortion pattern became more uniform. This indicates that the heat-transfer coefficient must be controlled carefully to achieve both high hardness and low distortion in the helical gear.
6. Orthogonal-Experiment Optimization
I used an orthogonal experiment to optimize the carburizing and quenching process of the helical gear. The four factors were carburizing temperature, boost time, diffusion time, and cooling rate. Each factor was assigned three levels. The response variables were the maximum distortion and the helical line total deviation \(F_\beta\). I selected the levels based on the parametric study and on practical process limits. Table 10 shows the factor levels.
| Level | Boost time (min) | Diffusion time (min) | Carburizing temperature (°C) | Cooling condition |
|---|---|---|---|---|
| 1 | 132 | 30 | 885 | H1 |
| 2 | 162 | 45 | 895 | H4 |
| 3 | 192 | 60 | 910 | H5 |
I used an \(L_9(3^4)\) orthogonal array and simulated the nine process combinations. The results are shown in Table 11. All nine conditions produced acceptable hardness and case depth, but the distortion and \(F_\beta\) values differed significantly. This confirmed that the cooling rate and thermal history are the dominant factors controlling the final geometry of the helical gear.
| Run | Carburizing temperature (°C) | Boost time (min) | Diffusion time (min) | Cooling condition | Distortion (µm) | \(F_\beta\) (µm) |
|---|---|---|---|---|---|---|
| 1 | 885 | 132 | 30 | H1 | 42.21 | 14.85 |
| 2 | 895 | 132 | 45 | H4 | 40.71 | 8.26 |
| 3 | 910 | 132 | 60 | H5 | 49.15 | 23.12 |
| 4 | 910 | 162 | 30 | H4 | 39.45 | 8.17 |
| 5 | 885 | 162 | 45 | H5 | 50.78 | 26.62 |
| 6 | 895 | 162 | 60 | H1 | 45.03 | 13.97 |
| 7 | 895 | 212 | 30 | H5 | 53.61 | 26.25 |
| 8 | 910 | 212 | 45 | H1 | 41.87 | 13.77 |
| 9 | 885 | 212 | 60 | H4 | 39.11 | 9.23 |
I performed a range analysis on the orthogonal results. For each factor and level, I calculated the average response \(K_{ij}\). The range \(R_j\) was calculated as
$$
R_j
=
\max_i\left(K_{ij}\right)
–
\min_i\left(K_{ij}\right)
$$
A larger \(R_j\) indicates a stronger influence of that factor on the response. I applied this analysis separately to the distortion and to the helical line total deviation \(F_\beta\). The results are summarized in Table 12.
| Response | Factor | Level 1 average | Level 2 average | Level 3 average | Range \(R\) | Importance |
|---|---|---|---|---|---|---|
| \(F_\beta\) | Carburizing temperature | 16.90 | 16.16 | 15.02 | 1.88 | 2 |
| Boost time | 15.41 | 16.25 | 16.42 | 1.10 | 3 | |
| Diffusion time | 16.42 | 16.22 | 15.44 | 0.98 | 4 | |
| Cooling condition | 14.20 | 8.55 | 25.33 | 17.77 | 1 | |
| Distortion | Carburizing temperature | 44.03 | 46.45 | 43.49 | 2.96 | 2 |
| Boost time | 44.02 | 45.09 | 44.86 | 1.06 | 3 | |
| Diffusion time | 45.09 | 44.45 | 44.43 | 0.66 | 4 | |
| Cooling condition | 43.03 | 39.76 | 51.18 | 11.42 | 1 |
I found that the influence order was the same for both responses: cooling rate > carburizing temperature > boost time > diffusion time. The optimal combination from the orthogonal analysis was carburizing temperature 910 °C, boost time 132 min, diffusion time 60 min, and cooling condition H4. This combination minimized both distortion and \(F_\beta\) among the orthogonal levels. I concluded that cooling rate must be controlled first when optimizing the carburizing and quenching process of the helical gear. Carburizing temperature is the second most important factor, while diffusion time has the smallest effect among the four factors studied.
7. BP Neural Network Optimization
I also developed a back-propagation neural network to optimize the carburizing and quenching process of the helical gear. The neural network provides a nonlinear mapping between process parameters and performance indices. I used four input neurons: carburizing temperature, boost time, diffusion time, and cooling condition. I used one hidden layer with fifteen neurons. I used two output neurons: distortion and helical line total deviation \(F_\beta\). The network topology is therefore \(4 \times 15 \times 2\).
| Item | Setting |
|---|---|
| Input neurons | 4 |
| Hidden layers | 1 |
| Hidden neurons | 15 |
| Output neurons | 2 |
| Training function | trainlm |
| Hidden transfer function | tansig |
| Output transfer function | purelin |
| Training samples | 29 |
| Testing samples | 7 |
| Target error | \(1 \times 10^{-4}\) |
| Learning rate | \(9 \times 10^{-2}\) |
I normalized all input and output data before training. The normalization equation I used was
$$
x’_i
=
\frac{x_i-x_{\min}}{x_{\max}-x_{\min}}
$$
The hidden-layer output was calculated as
$$
h_j
=
f_1\left(\sum_{i=1}^{4}w_{ij}^{(1)}x’_i+b_j^{(1)}\right)
$$
and the output-layer response was calculated as
$$
y_k
=
f_2\left(\sum_{j=1}^{15}w_{jk}^{(2)}h_j+b_k^{(2)}\right)
$$
I trained the network by minimizing the mean squared error:
$$
E
=
\frac{1}{2}\sum_{k=1}^{2}\left(y_k-\hat{y}_k\right)^2
$$
The weights were updated according to
$$
w_{ij}^{(\mathrm{new})}
=
w_{ij}^{(\mathrm{old})}
–
\eta\frac{\partial E}{\partial w_{ij}}
$$
After training, I tested the network with the reserved test samples. The relative error was calculated as
$$
\delta_y
=
\frac{\left|y_{\mathrm{pred}}-y_{\mathrm{ref}}\right|}{y_{\mathrm{ref}}}
\times 100\%
$$
I found that the average relative error for distortion was approximately 4.1%, and the average relative error for helical line total deviation \(F_\beta\) was approximately 3.8%. Both values were below 5%, which indicated that the neural network had good generalization ability and could accurately predict the performance of the helical gear. Table 14 summarizes the prediction errors.
| Sample | Relative error for distortion (%) | Relative error for \(F_\beta\) (%) |
|---|---|---|
| 1 | 4.6 | 4.2 |
| 2 | 3.5 | 3.1 |
| 3 | 4.4 | 3.9 |
| 4 | 3.9 | 4.0 |
| 5 | 4.2 | 3.6 |
| 6 | 3.8 | 3.5 |
| 7 | 4.3 | 4.3 |
Using the trained neural network, I searched the process space for the combination that minimized distortion and \(F_\beta\) while maintaining acceptable hardness and case depth. The optimal process predicted by the neural network was carburizing temperature 915 °C, boost time 150 min, diffusion time 40 min, and cooling condition H4. I then simulated this optimized process with COSMAP to verify the neural-network prediction. Table 15 compares the neural-network prediction with the finite-element simulation.
| Response | BP neural network prediction | COSMAP simulation | Relative error |
|---|---|---|---|
| Distortion (µm) | 36.72 | 38.91 | Approximately 5% |
| Helical line total deviation \(F_\beta\) (µm) | 7.89 | 8.13 | Approximately 3% |
I found that the optimized process reduced both distortion and \(F_\beta\) compared with the original process. The neural-network prediction and the finite-element simulation agreed within 5%. This validated the neural-network optimization approach. I concluded that the BP neural network is a useful tool for optimizing the carburizing and quenching process of the helical gear, especially when the process space is large and experimental trials are expensive.
8. Integrated Discussion
I integrated the experimental validation, parametric study, orthogonal optimization, and neural-network optimization to form a complete process-design workflow for the helical gear. The workflow begins with material characterization and heat-transfer data. It then uses a coupled finite-element model to predict carbon diffusion, phase transformation, hardness, stress, and distortion. The model is validated against measured carbon profiles, microstructure, hardness, and distortion. Once validated, the model is used to generate a data set for process optimization. Orthogonal experiments identify the dominant factors, and the neural network provides a nonlinear optimization tool for finding the best process combination.
I found that the distortion of the helical gear is controlled by a competition between thermal stress and transformation stress. Thermal stress arises from temperature gradients during cooling. Transformation stress arises from the volume expansion associated with martensite formation. Transformation plasticity can either intensify or relieve distortion depending on the local stress state and the sequence of phase transformation. Because the helical gear has a complex shape, these stresses vary along the tooth, web, and holes. The result is a three-dimensional distortion pattern that cannot be predicted by a simple one-dimensional model.
I also found that the cooling rate is the most important process variable for controlling distortion of the helical gear. This is consistent with the physical understanding that quenching controls both the thermal gradient and the martensitic transformation. The carburizing temperature and holding time control the carbon profile and case depth, which in turn affect the local Ms temperature and the volume change during quenching. However, their influence on distortion is secondary compared with the cooling rate. The diffusion time has the smallest influence among the factors studied because it mainly flattens the carbon profile rather than changing the total carbon supply.
I observed that the optimal process for the helical gear is not necessarily the process with the fastest cooling or the highest carbon potential. An extremely fast cooling rate can produce high hardness but may also increase thermal stress and distortion. A moderate fast cooling condition, such as H4, can produce high martensite content and high hardness while minimizing distortion. Similarly, a moderate carburizing temperature can provide sufficient case depth without excessive grain growth. This highlights the importance of multi-objective optimization for the helical gear.
9. Practical Implications for Helical Gear Manufacturing
I believe the results of my study have several practical implications for the manufacturing of helical gears. First, the coupled finite-element model can be used to reduce the number of physical trials required to develop a carburizing and quenching process. Second, the heat-transfer coefficient should be treated as a key control variable in oil quenching. Third, the carbon profile should be designed together with the cooling schedule because the two factors jointly determine the hardness and distortion of the helical gear. Fourth, the BP neural network can be used as a fast prediction tool for process engineers.
I also recommend that the initial microstructure of the helical gear be controlled before carburizing. A banded ferrite-pearlite structure can cause non-uniform carbon diffusion and non-uniform transformation. If the banding is severe, the helical gear may develop local hardness variations and stress concentrations. Normalizing or improving the forging and rolling schedule can reduce banding and improve the consistency of the final heat-treated helical gear.
I further recommend that the fixture and loading method be considered in future work. Although I did not study fixture effects in detail, the mechanical constraints and stacking pattern can influence heat transfer and distortion. A fixture that allows uniform oil flow around the helical gear is preferable. The position of the helical gear in the furnace and quench tank should also be controlled to avoid asymmetric cooling.
10. Conclusions
I drew the following conclusions from my numerical and experimental study of the helical gear:
- I established a coupled thermal-diffusion-metallurgical-mechanical finite-element model for a complex helical gear made of 20CrMnTiH steel. The model predicted carbon concentration, phase fractions, hardness, and distortion with good agreement against experimental measurements.
- I found that the carburized layer of the helical gear consisted mainly of fine acicular martensite and a small amount of retained austenite. The core contained low-carbon lath martensite and a small amount of lower bainite. The surface carbon content reached approximately 0.756 wt.%, and the effective case depth was approximately 0.75 mm.
- I measured a maximum surface hardness of approximately 778 HV1, and the simulated surface hardness was within 5% of the measured value. The hardness decreased from the surface to the core, and the 550 HV1 depth corresponded to the effective case depth.
- I found that the distortion of the helical gear was non-uniform because of non-uniform cooling, non-uniform phase transformation, and the complex geometry of the helical gear. The thermal gradient and transformation strain both contributed to the final distortion.
- I showed that carburizing temperature and holding time control the carbon profile and case depth. The boost time had a slightly stronger effect on case depth than the diffusion time. Increasing the holding time increased the martensite content and hardness slightly but did not change the surface hardness significantly.
- I found that the cooling rate had the strongest influence on distortion and helical line total deviation \(F_\beta\). A moderate fast cooling condition, H4, produced the minimum distortion and minimum \(F_\beta\) while maintaining high hardness and martensite content.
- I used an orthogonal experiment to rank the process factors. The influence order was cooling rate > carburizing temperature > boost time > diffusion time. The optimal combination from the orthogonal analysis was carburizing temperature 910 °C, boost time 132 min, diffusion time 60 min, and cooling condition H4.
- I constructed a \(4 \times 15 \times 2\) BP neural network for process optimization. The network achieved average relative errors below 5% for both distortion and \(F_\beta\). The optimized process predicted by the network was carburizing temperature 915 °C, boost time 150 min, diffusion time 40 min, and cooling condition H4. The finite-element simulation verified this prediction within 5%.
- I concluded that the combination of finite-element simulation, experimental validation, orthogonal analysis, and BP neural network optimization provides a reliable and efficient method for controlling the carburizing and quenching process of a helical gear.
Overall, my study demonstrates that the distortion of a helical gear during carburizing and quenching can be predicted and reduced through careful multi-field modeling and process optimization. The helical gear remains a challenging component because its geometry, load path, and thermal history are complex, but the approach I developed provides a practical route for improving dimensional accuracy and service performance. I expect that the method can be extended to other helical gear sizes, other alloy steels, and other quenching media, provided that the material properties and heat-transfer boundary conditions are calibrated properly.