
The basic parameters of gear pair 2 are selected to calculate and analyze the time-varying meshing stiffness with friction effect. Firstly, the influence of friction on the load components along the x-axis and y-axis is studied according to the formula. In order to facilitate data comparison, the load dimension is unified. The curve of load components along the tooth profile is shown in Figure 1.
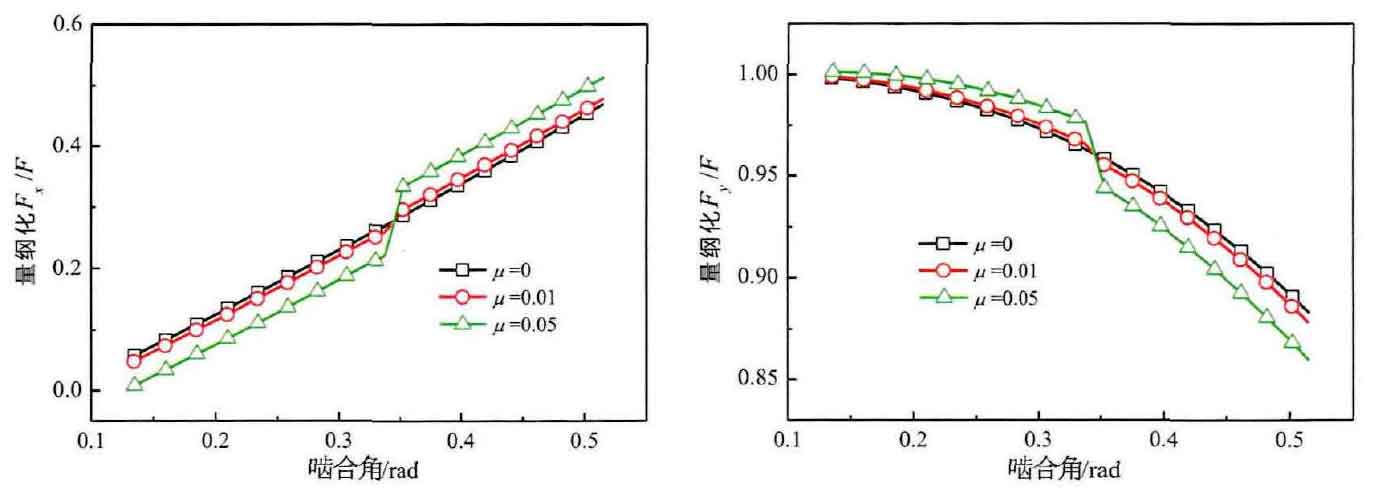
The dimensionalized load curve in Figure 1 (a) shows that under the action of friction, the load component along the x-axis from the tooth root to the pitch line is slightly less than that without friction, while the load component from the pitch line to the tooth top is slightly greater than that without friction, and with the increase of friction coefficient, the difference between the load component and that without friction is larger, and the difference at different meshing points is not equal. Fig. 1 (b) the load component curve along the y-axis is just opposite to that along the x-axis, that is, the frictional load is greater than the non frictional load from the tooth root to the pitch line, and the frictional load is less than the non frictional load from the pitch line to the tooth top. However, with the increase of friction coefficient, the difference of load components is the same along the c axis (the difference increases and is not equal).

According to the load change action formula affected by friction, the compression stiffness Ka, shear stiffness KT and bending stiffness KB shown in the formula are simulated and calculated. The calculation results are shown in Figure 2. Figure 2 (a) shows that the compression stiffness from the root to the pitch line is less than that without friction, while the compression stiffness from the pitch line to the top is greater than that without friction, and the stiffness curve changes obviously with the increase of friction coefficient. The shear stiffness curve in Fig. 2 (b) shows that the compression stiffness from the tooth root to the pitch line is slightly greater than that without friction, while the compression stiffness from the pitch line to the tooth top is slightly less than that without friction. From the visual effect, the effect of friction on the shear stiffness is less than that on the compression stiffness. In Fig. 2 (c), the change trend of bending stiffness curve under friction is similar to that of shear stiffness curve, and the difference between bending stiffness curve and shear stiffness curve increases with the increase of friction coefficient. The above results show that the effect of friction on single stiffness is not the same as increasing or decreasing, but has different effects.
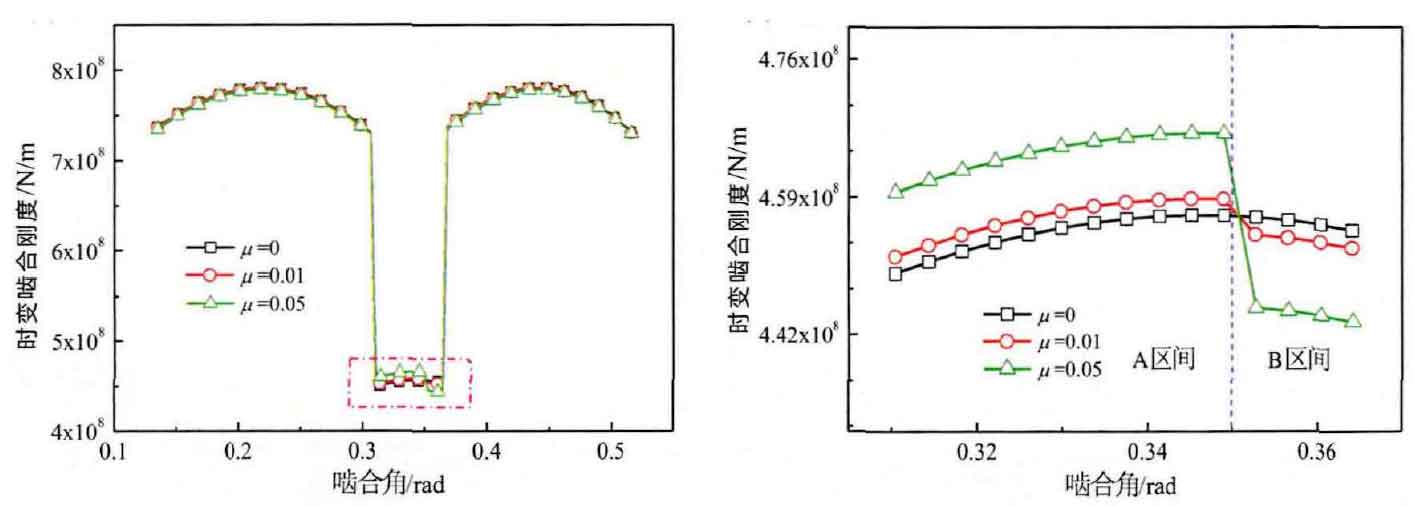
Combined with contact stiffness and gear matrix stiffness, the comprehensive time-varying meshing stiffness under friction is further analyzed. In Fig. 3 (a), the time-varying meshing stiffness curve of Gear Considering the effect of friction is plotted. The graph shows that in the meshing zone of double pairs of teeth, the stiffness curve under the selected friction coefficient simulation has little change compared with the stiffness curve without friction effect. In terms of visual effect, the change of friction coefficient has little effect on the stiffness value of the meshing zone of double pairs of teeth, while in the meshing zone of single pair of teeth The results show that the friction has a slight effect on the stiffness, and the stiffness value jumps before and after the node position. In order to analyze the stiffness jump here clearly and intuitively, the stiffness curve here is enlarged, as shown in Fig. 3 (b). It can be seen from the figure that with the pitch line as the boundary, the front and rear stiffness values decrease, and with the increase of the friction coefficient, the greater the deviation of the stiffness value from the non friction effect.
The interval before and after the change of stiffness is defined as interval a and interval B (Fig. 3 (b)), and the average stiffness of the stiffness curve in the two intervals is taken for quantitative stiffness deviation research. The results show that when the friction coefficient is 0.01, the difference percentages of the two interval average stiffness values compared with the non friction action are 0.4% and 0.4% respectively, while when the friction coefficient is 0.05, the difference percentages compared with the non friction action are 2.2% and 2.4% respectively. The difference percentage also shows that the stiffness value changes more with the increase of friction coefficient. At the same time, it also shows that the fluctuation of gear time-varying meshing stiffness curve can be reduced under the condition of full lubrication between gear pairs, especially in the single pair meshing interval, and the dynamic and other mechanical properties of gear device can be improved.