
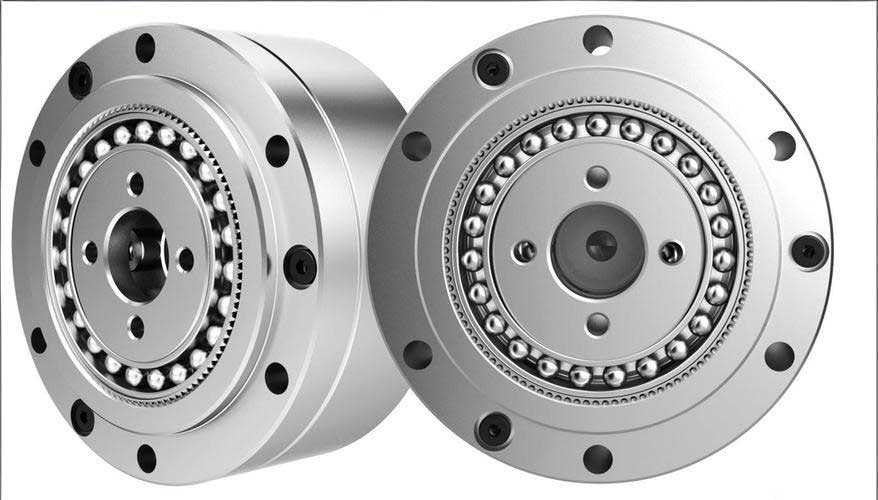
In the realm of precision mechanical systems, harmonic drive gears have emerged as a critical component due to their high torque capacity, compact design, and exceptional accuracy. As an engineer specializing in reliability analysis, I have observed that traditional design methods often fall short in addressing the inherent uncertainties in mechanical systems. This article delves into the application of fuzzy reliability design to harmonic drive gears, aiming to bridge the gap between deterministic safety factors and probabilistic approaches. By integrating fuzzy set theory with conventional reliability principles, we can better capture the vagueness and randomness in parameters such as material strength, operational loads, and environmental conditions. The goal is to provide a robust framework that enhances the safety and longevity of harmonic drive gears in demanding applications like robotics, aerospace, and industrial machinery. Throughout this discussion, I will emphasize the importance of considering both fuzziness and randomness, using mathematical models, tables, and real-world examples to illustrate key concepts.
To begin, let us explore the fundamental principles of fuzzy reliability design. In conventional reliability engineering, variables are treated as random quantities with defined probability distributions. However, in practice, the transition from a “safe” state to a “failed” state is often gradual rather than abrupt—a phenomenon best described by fuzzy logic. For harmonic drive gears, this fuzziness arises from factors like manufacturing tolerances, material degradation, and subjective interpretation of failure criteria. Fuzzy reliability design incorporates this by using membership functions to quantify the degree to which a system belongs to a safe or failed set. The core idea is to model the safety margin as a fuzzy event, allowing for a more nuanced assessment of reliability. This approach is particularly relevant for harmonic drive gears, where components such as the flexspline, circular spline, and wave generator interact in complex ways under variable loads.
The mathematical foundation of fuzzy reliability design hinges on the membership function. For harmonic drive gears, we often adopt a linear membership function to represent the fuzzy safety state. Let \( Z \) denote the safety margin, defined as the difference between strength \( r \) and stress \( s \). The membership function \( \mu(Z) \) is given by:
$$ \mu(Z) = \begin{cases}
1 & \text{if } Z \geq 0 \\
\frac{Z + a}{a} & \text{if } -a < Z < 0 \\
0 & \text{if } Z \leq -a
\end{cases} $$
Here, \( a > 0 \) is a parameter that characterizes the fuzziness, often determined empirically based on engineering judgment or historical data. In the context of harmonic drive gears, \( a \) reflects the ambiguity in defining failure thresholds—for instance, when wear on gear teeth becomes unacceptable. By adjusting \( a \), we can tailor the model to specific applications, such as high-precision robotic arms or heavy-duty industrial reducers. This flexibility is a key advantage of fuzzy reliability design over traditional methods.
Next, we derive the fuzzy reliability formula. Assuming that both strength \( r \) and stress \( s \) are normally distributed random variables with means \( \mu_r \) and \( \mu_s \), and standard deviations \( \sigma_r \) and \( \sigma_s \), respectively, the safety margin \( Z = r – s \) also follows a normal distribution. Its mean and standard deviation are:
$$ \mu_Z = \mu_r – \mu_s, \quad \sigma_Z = \sqrt{\sigma_r^2 + \sigma_s^2} $$
The probability density function of \( Z \) is:
$$ f(Z) = \frac{1}{\sqrt{2\pi} \sigma_Z} \exp\left[ -\frac{(Z – \mu_Z)^2}{2\sigma_Z^2} \right] $$
The fuzzy reliability \( R \)—representing the probability that the harmonic drive gear operates in a safe fuzzy state—is computed as:
$$ R = P(Z \geq \tilde{0}) = \int_0^\infty f(Z) \, dZ + \int_{-a}^0 \mu(Z) f(Z) \, dZ $$
Substituting the membership function and integrating yields:
$$ R = \frac{1}{a} \left\{ \left[ (a + \mu_Z) \Phi\left( \frac{a + \mu_Z}{\sigma_Z} \right) – \mu_Z \Phi\left( \frac{\mu_Z}{\sigma_Z} \right) \right] + \frac{\sigma_Z}{\sqrt{2\pi}} \left[ \exp\left( -\frac{(a + \mu_Z)^2}{2\sigma_Z^2} \right) – \exp\left( -\frac{\mu_Z^2}{2\sigma_Z^2} \right) \right] \right\} $$
where \( \Phi(\cdot) \) is the standard normal cumulative distribution function. This formula combines conventional reliability (the first term) with a fuzzy correction (the second term), highlighting how fuzziness enhances the reliability estimate. For harmonic drive gears, this means that under identical conditions, fuzzy reliability tends to be higher than conventional reliability, as it accounts for the gradual nature of failure.
To apply fuzzy reliability design to harmonic drive gears, we must first analyze their strength criteria. Harmonic drive gears can fail due to various mechanisms, but three primary modes govern their design: tooth surface wear, flexspline fatigue, and wave generator bearing life. Each mode involves distinct stress and strength parameters, which we model as random variables with associated uncertainties. Below, I present a detailed breakdown of these criteria, using tables to summarize key parameters and formulas to compute means and standard deviations.
Starting with tooth surface wear, harmonic drive gears experience near-surface contact between the flexspline and circular spline, making wear a critical concern. The contact pressure \( p \) is used to control wear, and its mean value \( \mu_p \) is calculated as:
$$ \mu_p = \frac{8000 \, \mu_K \, \mu_T}{\mu_\epsilon \, \mu_{\chi_d} \, \mu_{C_h} \, m \, d^2 \, z} $$
where \( \mu_T \) is the mean torque (in N·m), \( \mu_K \) is the mean load factor, \( \mu_\epsilon \) is the mean percentage of meshing teeth, \( \mu_{\chi_d} \) is the mean face width coefficient, \( \mu_{C_h} \) is the mean maximum meshing depth coefficient, \( m \) is the module, \( d \) is the pitch diameter, and \( z \) is the number of teeth. The standard deviation \( \sigma_p \) can be derived from the coefficients of variation of these parameters. Assuming independence, we have:
$$ \sigma_p = \mu_p \sqrt{C_K^2 + C_\epsilon^2 + C_{\chi_d}^2 + C_{C_h}^2} $$
where \( C_x = \sigma_x / \mu_x \) is the coefficient of variation for each parameter. The allowable contact pressure \( [p] \) is also a random variable with mean \( \mu_{[p]} \) and standard deviation \( \sigma_{[p]} \). Thus, the safety margin for wear is \( Z_w = [p] – p \), with mean and standard deviation:
$$ \mu_{Z_w} = \mu_{[p]} – \mu_p, \quad \sigma_{Z_w} = \sqrt{\sigma_{[p]}^2 + \sigma_p^2} $$
Table 1 summarizes typical parameters for tooth surface wear analysis in harmonic drive gears, based on engineering handbooks and empirical data.
| Parameter | Symbol | Mean (\( \mu \)) | Standard Deviation (\( \sigma \)) | Coefficient of Variation (\( C \)) |
|---|---|---|---|---|
| Torque | \( T \) | 400 N·m | 20 N·m | 0.05 |
| Load Factor | \( K \) | 1.525 | 0.075 | 0.049 |
| Meshing Percentage | \( \epsilon \) | 0.43 | 0.033 | 0.077 |
| Face Width Coefficient | \( \chi_d \) | 0.15 | 0.0167 | 0.111 |
| Max Meshing Depth Coefficient | \( C_h \) | 1.5 | 0.033 | 0.022 |
| Allowable Pressure | \( [p] \) | 30 MPa | 3.33 MPa | 0.11 |
Moving to flexspline fatigue, harmonic drive gears often employ cylindrical, cup-shaped, or sealed flexsplines that undergo cyclic stresses. The safety factor \( S \) under combined stresses is computed as:
$$ \mu_S = \frac{\mu_{s_\sigma} \, \mu_{s_\tau}}{\sqrt{\mu_{s_\sigma}^2 + 0.7 \, \mu_{s_\tau}^2}} $$
where \( \mu_{s_\sigma} \) and \( \mu_{s_\tau} \) are the mean safety factors for normal and shear stresses, respectively. These depend on material properties and stress concentrations unique to harmonic drive gears. The allowable safety factor \( [S] \) has mean \( \mu_{[S]} \) and standard deviation \( \sigma_{[S]} \), leading to a safety margin \( Z_f = [S] – S \) with:
$$ \mu_{Z_f} = \mu_{[S]} – \mu_S, \quad \sigma_{Z_f} = \sqrt{\sigma_{[S]}^2 + \sigma_S^2} $$
Here, \( \sigma_S \) is derived from the variability in stress and strength parameters. Table 2 provides example values for fatigue analysis in harmonic drive gears, emphasizing the randomness in material endurance limits and operational loads.
| Parameter | Symbol | Mean (\( \mu \)) | Standard Deviation (\( \sigma \)) | Source |
|---|---|---|---|---|
| Normal Stress Safety Factor | \( s_\sigma \) | 2.5 | 0.25 | Material testing |
| Shear Stress Safety Factor | \( s_\tau \) | 3.0 | 0.3 | Material testing |
| Allowable Safety Factor | \( [S] \) | 1.8 | 0.18 | Design standards |
For the wave generator bearing life, harmonic drive gears rely on flexible rolling bearings that dictate overall longevity. The mean bearing life \( \mu_{L_h} \) in hours is given by:
$$ \mu_{L_h} = \frac{10^6}{60 \, n} \left( \frac{\mu_C}{\mu_P} \right)^\epsilon $$
where \( n \) is the rotational speed (in rpm), \( \mu_C \) is the mean dynamic load rating (in N), \( \mu_P \) is the mean equivalent load (in N), and \( \epsilon \) is an exponent typically set to 3 for ball bearings. The standard deviation \( \sigma_{L_h} \) depends on variations in load and material fatigue. The allowable life \( [L] \) has mean \( \mu_{[L]} \) and standard deviation \( \sigma_{[L]} \), so the safety margin \( Z_b = [L] – L_h \) has:
$$ \mu_{Z_b} = \mu_{[L]} – \mu_{L_h}, \quad \sigma_{Z_b} = \sqrt{\sigma_{[L]}^2 + \sigma_{L_h}^2} $$
Table 3 outlines parameters for bearing life assessment in harmonic drive gears, reflecting uncertainties from lubrication, alignment, and load fluctuations.
| Parameter | Symbol | Mean (\( \mu \)) | Standard Deviation (\( \sigma \)) | Notes |
|---|---|---|---|---|
| Dynamic Load Rating | \( C \) | 5000 N | 500 N | From bearing catalog |
| Equivalent Load | \( P \) | 1000 N | 100 N | Operational data |
| Allowable Life | \( [L] \) | 10,000 hours | 1000 hours | Design requirement |
| Rotational Speed | \( n \) | 1500 rpm | 75 rpm | Fixed for this case |
With these models established, we can now compute fuzzy reliability for each failure mode. The process involves substituting the mean and standard deviation of the safety margin into the fuzzy reliability formula. To illustrate, let us consider a detailed case study focused on tooth surface wear, as this is often the limiting factor for harmonic drive gears in high-torque applications. Assume a harmonic drive gear with parameters from Table 1: mean torque \( \mu_T = 400 \, \text{N·m} \), module \( m = 0.5 \, \text{mm} \), pitch diameter \( d = 121 \, \text{mm} \), and teeth number \( z = 242 \). Using the formula for mean contact pressure:
$$ \mu_p = \frac{8000 \times 1.525 \times 400}{0.43 \times 0.15 \times 1.5 \times 0.5 \times (121)^2 \times 242} \approx 28.47 \, \text{MPa} $$
The coefficient of variation for \( p \) is computed as:
$$ C_p = \sqrt{0.049^2 + 0.077^2 + 0.111^2 + 0.022^2} \approx 0.1454 $$
Thus, the standard deviation is \( \sigma_p = 0.1454 \times 28.47 \approx 4.14 \, \text{MPa} \). For the allowable pressure, \( \mu_{[p]} = 30 \, \text{MPa} \) and \( \sigma_{[p]} = 3.33 \, \text{MPa} \). The safety margin has mean and standard deviation:
$$ \mu_{Z_w} = 30 – 28.47 = 1.53 \, \text{MPa}, \quad \sigma_{Z_w} = \sqrt{3.33^2 + 4.14^2} \approx 5.31 \, \text{MPa} $$
Now, applying the fuzzy reliability formula with a fuzziness parameter \( a = 1 \) (selected based on engineering experience for harmonic drive gears), we get:
$$ R_w = \frac{1}{1} \left\{ \left[ (1 + 1.53) \Phi\left( \frac{1 + 1.53}{5.31} \right) – 1.53 \Phi\left( \frac{1.53}{5.31} \right) \right] + \frac{5.31}{\sqrt{2\pi}} \left[ \exp\left( -\frac{(1 + 1.53)^2}{2 \times 5.31^2} \right) – \exp\left( -\frac{1.53^2}{2 \times 5.31^2} \right) \right] \right\} $$
Evaluating this numerically: first, compute the arguments for \( \Phi \): \( (1 + 1.53)/5.31 \approx 0.476 \) and \( 1.53/5.31 \approx 0.288 \). Using standard normal tables, \( \Phi(0.476) \approx 0.683 \) and \( \Phi(0.288) \approx 0.613 \). The exponential terms are approximately \( \exp(-0.476^2/2) \approx 0.886 \) and \( \exp(-0.288^2/2) \approx 0.960 \). Plugging in:
$$ R_w \approx \left[ 2.53 \times 0.683 – 1.53 \times 0.613 \right] + \frac{5.31}{2.5066} \left[ 0.886 – 0.960 \right] \approx (1.728 – 0.938) + 2.119 \times (-0.074) \approx 0.790 – 0.157 \approx 0.633 $$
Thus, the fuzzy reliability for tooth wear is approximately 0.633 or 63.3%. For comparison, conventional reliability (ignoring fuzziness) is simply \( \Phi(\mu_{Z_w} / \sigma_{Z_w}) = \Phi(1.53/5.31) \approx \Phi(0.288) \approx 0.613 \), or 61.3%. This demonstrates that fuzzy reliability is higher, as it accounts for the gradual transition to failure in harmonic drive gears. Similar calculations can be performed for flexspline fatigue and bearing life, but I will focus on wear for brevity.
To generalize, we can derive fuzzy reliability formulas for all three failure modes. Let \( \mu_Z \) and \( \sigma_Z \) represent the mean and standard deviation of the safety margin for any mode. The fuzzy reliability \( R \) is always given by the formula above, with \( a \) tailored to the mode. For harmonic drive gears, typical \( a \) values range from 0.5 to 2, depending on the criticality of the component. For instance, wear might use \( a = 1 \), fatigue \( a = 1.5 \), and bearing life \( a = 0.8 \), reflecting differing levels of uncertainty in failure definitions. This adaptability is a strength of fuzzy reliability design, allowing engineers to incorporate expert knowledge into quantitative analysis.
In practice, implementing fuzzy reliability design for harmonic drive gears requires careful parameter estimation. The means and standard deviations of variables can be obtained from historical data, manufacturer specifications, or testing. When data is limited, the “3-sigma” rule is often applied: if a parameter is known to lie between \( x_{\min} \) and \( x_{\max} \), we set \( \mu_x = (x_{\min} + x_{\max})/2 \) and \( \sigma_x = (x_{\max} – x_{\min})/6 \). This approach is conservative and widely used in reliability engineering for harmonic drive gears. Additionally, Monte Carlo simulations can validate the fuzzy reliability models by generating random samples of stresses and strengths.
The advantages of fuzzy reliability design for harmonic drive gears are manifold. First, it provides a more realistic reliability estimate by acknowledging that failure is not a binary event. This is crucial for safety-critical applications like medical robots or satellite mechanisms, where harmonic drive gears are prevalent. Second, it helps optimize design parameters—for example, by selecting material grades or gear dimensions that maximize fuzzy reliability under cost constraints. Third, it facilitates maintenance scheduling, as fuzzy reliability can predict the gradual degradation of harmonic drive gears over time. However, challenges remain, such as determining appropriate membership functions and fuzziness parameters. Future research could focus on data-driven methods to calibrate these for specific harmonic drive gear configurations.
In conclusion, fuzzy reliability design offers a powerful framework for enhancing the safety and performance of harmonic drive gears. By integrating fuzziness with randomness, we can better model real-world uncertainties and achieve higher reliability estimates than conventional methods. This article has detailed the theoretical basis, mathematical formulations, and practical applications, using tables and formulas to summarize key points. As harmonic drive gears continue to evolve in precision and complexity, embracing advanced reliability approaches will be essential for innovation. I encourage engineers to explore fuzzy reliability design in their projects, leveraging its flexibility to tackle the unique challenges of harmonic drive gears. Through continued refinement and application, we can push the boundaries of what these remarkable devices can achieve.