This article delves into the crucial topic of gear wear detection in automotive spiral bevel gears. The presence of coupled vertical vibration in automotive rear – axle spiral bevel gears makes accurate wear detection a challenging task. A novel approach based on Delaunay triangulation is presented, aiming to address this issue. By comprehensively analyzing the principles, processes, and experimental validations of this method, its superiority over traditional methods is demonstrated. This research provides valuable insights and practical solutions for enhancing the safety and reliability of automotive gear systems.
1. Introduction
Automobiles have become an essential part of modern life. However, with extended usage, the components of a vehicle, especially the gears, are prone to wear. Among them, the spiral bevel gears in the automotive rear – axle are particularly vulnerable due to the coupled vertical vibration during vehicle operation. This wear, if left undetected, can significantly compromise the safety and performance of the vehicle.
Traditional gear wear detection methods, such as those described in [3 – 5], have their limitations. The method in [3] fails to consider the interference of noise, resulting in insufficient detection accuracy. The approach in [4] has issues with the fitting of the wear surface, leading to an incomplete detection effect. The method in [5] overlooks data denoising, which reduces the detection precision. Therefore, there is an urgent need for a more effective gear wear detection method.
2. Delaunay Triangulation for Non – Feature Discrete Data Blocking of Gear Surfaces
2.1 Principle of Delaunay Triangulation
Delaunay triangulation is a powerful technique in computational geometry. In the context of gear surface data processing, it has unique advantages. In a Delaunay triangle network, for any triangle, no other points exist within the circum – circle of the triangle, and the triangles are formed by the nearest points. This property ensures that the triangulation result is consistent regardless of the starting point on the gear surface, which is crucial for accurately describing the gear surface area and improving the detection accuracy of gear wear.
2.2 Construction of the Gear Model and Data Blocking Process
First, a Non – uniform Rational B – Splines (NURBS) surface is used to construct the automotive spiral bevel gear model. The expression for constructing the NURBS surface of the gear using the tensor – product form is as follows: \(A(i, b)=\frac{\sum_{s = 1}^{q}\sum_{k = 0}^{\infty}N_{o, l}(i)N_{k, l}(b)\xi_{o i}B_{s k}}{\sum_{o = 1}^{q}\sum_{i = 0}^{\infty}N_{o, l}(i)N_{k, l}(b)\xi_{s k}}, i, b\in[0,1]\) Where b represents the surface direction, \(A(i,b)\) is the NURBS surface function, q is the number of center points in one direction, m is the number of center points in the b direction, \(B_{s k}\) is the surface center point, \(N_{n, i}\) is the spline basis function in the i direction, \(N_{k, l}\) is the spline basis function in the b direction, and \(\xi_{a k}\) is the weight factor.
After measuring the discrete data on the gear surface through a scanning method, Delaunay triangulation is applied. Let \(\alpha\) denote the scan line, with \(i = 1,2,\cdots,n\), \(\alpha_{i}\) and \(\alpha_{i + 1}\) representing two adjacent scan lines, and \(\alpha_{i}(k)\) (\(k = 1,2,\cdots,y\)) and \(\alpha_{i+1}(K)\) (\(K = 1,2,\cdots,y\)) representing the test points (y is the number of test points).
The process involves connecting the starting and ending points of two adjacent scan lines, as well as the nearest measurement points on the other scan line for each measurement point on one scan line. This divides the space between the two scan lines into several regions. Then, triangular and quadrilateral space regions are detected, and the quadrilateral space regions are triangulated according to the maximum – minimum – angle criterion to complete the Delaunay triangulation, as shown in Figure 1.
| Step | Operation | Illustration |
|---|---|---|
| 1 | Connect starting and ending points of adjacent scan lines | [Insert image of adjacent scan lines with starting and ending points connected] |
| 2 | Connect nearest measurement points | [Insert image with additional connections of nearest measurement points] |
| 3 | Detect and triangulate regions | [Insert image after triangulation] |
2.3 Selection of Starting Triangle and Data Blocking
To complete the non – feature discrete data blocking of the gear surface, a center triangle CenTri is selected on the NURBS tooth surface model. The value of all center triangles is calculated using the formula: \(\begin{aligned}Y = &max\left(\left|\varepsilon_{1}-\varepsilon_{2}\right|,\left|\varepsilon_{2}-\varepsilon_{3}\right|,\left|\varepsilon_{1}-\varepsilon_{3}\right|\right)-\\&min\left(\left|\varepsilon_{1}-\varepsilon_{2}\right|,\left|\varepsilon_{2}-\varepsilon_{3}\right|,\left|\varepsilon_{1}-\varepsilon_{3}\right|\right)\end{aligned}\) Where \(n = 1,2,3\), \(\varepsilon\) is the angle between two triangles, and Y is the value of the center – triangle region.
The center triangle with the smallest region value is selected as the starting triangle. Then, the adjacent triangle with the smallest angle to the starting triangle is chosen as the new center triangle. If a certain condition is met, the starting center triangle is excluded, and the angles between the surrounding triangles and the starting triangle are calculated. The triangle with the smallest angle is selected as the center triangle. This process is repeated until all triangles are traversed, completing the non – feature discrete data blocking of the gear, as shown in Figure 2.
| Triangle Selection | Criterion | Illustration |
|---|---|---|
| Starting triangle | Smallest region value | [Insert image highlighting the starting triangle] |
| Subsequent triangles | Smallest angle with the previous center triangle | [Insert image showing the growth of the triangle selection process] |
3. Gear Wear Detection Using Hermite Interpolation Algorithm
3.1 Steps of the Detection Process
Based on the results of the non – feature discrete data blocking of the gear surface, the Hermite interpolation algorithm, specifically the local mean decomposition (LMD) algorithm, is used to detect gear wear. The detailed steps are as follows:
- Data Transformation: Set the original discrete data as \(c(y)\) and transform the original strong – noise discrete data \(c(y)\) into small – parameter data.
- Denoising: Perform denoising on the small – parameter data obtained in step 1 in the cascaded bistable stochastic resonance (CBSR) system to obtain the denoised discrete data \(c_{n}(y)\).
- Extremum Point Extension: Extend the extreme points \(m_{0}\) of the denoised discrete data to obtain a new sequence c.
- Envelope Generation: Select the maximum or minimum point from one end of the new sequence and generate two envelope lines using the Hermite interpolation algorithm.
- Calculation of Local Mean Function: Calculate the local mean function \(q(y)\) using the formula \(q(y)=\frac{R_{ap}(y)+R_{dax }(y)}{2}\), where \(R_{ap }(y)\) is the upper envelope line and \(R_{down }(y)\) is the lower envelope line.
- Calculation of Envelope Estimation Function: Calculate the envelope estimation function \(s(y)\) using the formula \(s(y)=\frac{\left|R_{ap}(y)-R_{dos }(y)\right|}{2}\).
- Calculation of PF Component Amplitude: Use the LMD analysis method to separate the envelope data from the original tooth surface data and calculate the amplitude of the product function (PF) component. The formula is \(f_{v}(y)=\frac{1}{2\pi}\frac{\left[arccos _{in }(y)\right]}{f(y)}\). If the calculation result of this formula is not within the specified range, it is determined that wear has occurred in that area.
This process is repeated for all triangular meshes of the gear until the entire gear is traversed and detected.
3.2 Significance of Each Step
Each step in the above process plays a crucial role in accurately detecting gear wear. The data transformation and denoising steps help to reduce the impact of noise on the detection results, ensuring the reliability of the data. The extension of extreme points and the generation of envelope lines are important for extracting the characteristics of the gear surface data. The calculation of the local mean function and envelope estimation function provides a basis for further analyzing the data. Finally, the calculation of the PF component amplitude serves as a key indicator for determining the occurrence of gear wear.
4. Experimental Analysis
4.1 Experimental Setup
To verify the effectiveness of the Delaunay – triangulation – based gear wear detection method, a comparative test experiment was conducted. The spiral bevel gears of a Santana 2015 manual – transmission car were selected as the research objects, with 20 identical gears used. The material properties of these gears are shown in Table 1.
| Component | Material | Density (\(kg/m^{3}\)) | Young’s Modulus (GPa) | Poisson’s Ratio |
|---|---|---|---|---|
| Gear | 45Cr | 7850 | 206 | 0.3 |
| Table 1: Material properties of automotive spiral bevel gears |
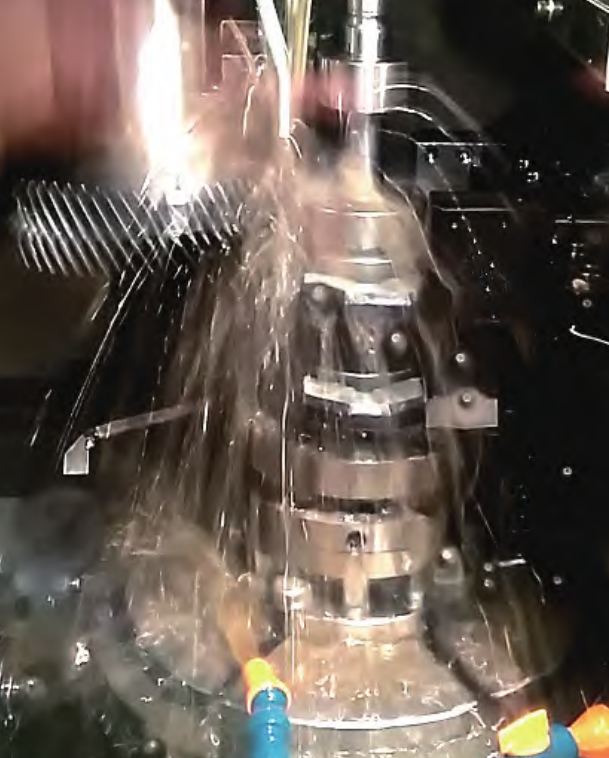
The experimental equipment is shown in Figure 3. The wear situation of the spiral bevel gears is presented in Figure 4, and the Delaunay triangulation results of the worn gears.
4.2 Experimental Process
The experimental process was carefully planned to obtain accurate results:
- Data Collection: Keep the gear wear experimental equipment running continuously for 200 hours. Collect gear wear data at 5 – minute intervals, with 12 sets of data collected per hour.
- Test Indicators: Set the gear wear depth, gear wear rate, and the detection accuracy of the wear – area area as the test indicators for this experiment.
- Selection of Comparative Methods: Select the detection method based on reverse engineering proposed in [4] and the detection method based on improved Mask Scoring R – CNN proposed in [5] as the comparative methods for this experiment.
- Experimental Validation: Conduct experimental verifications using the three different methods according to the set experimental indicators.
4.3 Results and Analysis
4.3.1 Gear Wear Depth
Gear wear mainly occurs between the driving gear and the driven gear. The wear depth of the gear changes with the increase of operating time. The wear – depth results of the driving gear and the driven gear are shown in Figure 6.
| Gear Type | Wear – Depth Comparison | Illustration |
|---|---|---|
| Driving gear | The proposed method’s results are basically consistent with the actual measurement, while methods in and have large differences | [Insert graph of driving gear wear – depth comparison] |
| Driven gear | Similar to the driving gear, the proposed method shows better agreement with the actual values | [Insert graph of driven gear wear |
a wear depth of 0 represents the initial surface state, and the areas with higher gear wear are the tooth tip and the tooth root. By comparing the wear – depth detection results of the three methods with the actual results, it can be seen that the results of the proposed method are in good agreement with the actual measurement, while the wear – depth values of the methods in and deviate significantly from the actual measurement results. This indicates that the proposed method can effectively analyze the gear wear depth.
4.3.2 Gear Wear Rate
The gear wear rate, which represents the amount of gear material worn per unit time, can effectively reflect the wear situation of the gear. The comparison results of the wear rates of the three methods and the actual wear – rate calculation results are shown in Figure 7.
| Method | Wear – Rate Deviation from Actual Value |
|---|---|
| The proposed method | Maximum error does not exceed 0.01μm, consistent with the actual wear rate |
| Method in | Larger deviation from the actual wear rate |
| Method in | Larger deviation from the actual wear rate |
it can be observed that during the study of 20 gears, the wear rate of the proposed method is always consistent with the actual wear rate, with a maximum error of less than 0.01μm. In contrast, the wear rates of the methods in and differ significantly from the actual wear rate. Therefore, the proposed method can obtain more accurate gear – wear – rate results and improve the detection effect of gear wear.
4.3.3 Detection Accuracy of Gear Wear – Area Area
To further verify the gear – wear – detection performance of the proposed method, the detection accuracy of the gear wear – area area was used as an indicator for comparison. Each experiment detected the wear – area area of 20 gears, and a total of 10 experiments were conducted. The average detection results of the wear – area area for each experiment are shown .
| Experiment Number | Detection Accuracy of Gear Wear – Area Area /% | ||
|---|---|---|---|
| The Proposed Method | Method in | Method in | |
| 1 | 96.9 | 77.9 | 83.9 |
| 2 | 98.3 | 76.3 | 79.1 |
| 3 | 97.1 | 70.2 | 80.7 |
| 4 | 96.2 | 73.1 | 82.2 |
| 5 | 97.3 | 79.4 | 81.4 |
| 6 | 98.3 | 72.2 | 84.3 |
| 7 | 96.8 | 74.1 | 80.9 |
| 8 | 98.1 | 74.7 | 82.4 |
| 9 | 98.7 | 73.6 | 80.6 |
| 10 | – | – | – |
| Table 2: Detection accuracy of gear wear – area area |
By comparing the detection – accuracy results of the gear wear – area area in Table 2, it can be seen that the detection accuracy of the wear – area area of the proposed method reaches up to 98.7%, while the maximum detection – accuracy values of the two comparative methods are 79.4% and 84.3% respectively. This shows that the proposed method can accurately detect the area of the gear wear area.
5. Conclusion
The detection of gear wear in automotive spiral bevel gears is of great significance for ensuring the safety and stability of vehicle operation. The Delaunay – triangulation – based gear wear detection method proposed in this article effectively addresses the problems of traditional methods. By performing Delaunay triangulation on the adjacent scan lines of the gear surface, non – feature discrete data blocking is achieved. Then, through the Hermite interpolation algorithm, the wear area is detected by calculating the PF component amplitude.
Experimental data shows that the wear – depth and wear – rate results of the proposed method are basically consistent with the actual values, and it can accurately detect the area of the wear area with a maximum detection accuracy of 98.7%. This method provides a new and effective solution for gear wear detection technology in automotive spiral bevel gears, which can contribute to improving the overall performance and safety of automotive transmission systems. Future research can focus on further optimizing the algorithm and expanding its application scope to different types of gears and operating conditions.