
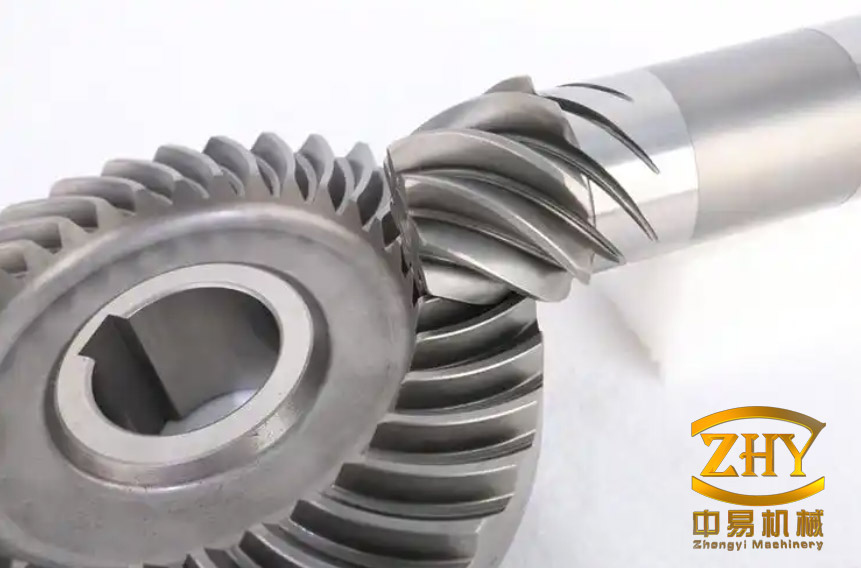
The finishing pass that fixes tooth-flank state
Spiral bevel gears transmit torque between intersecting shafts through teeth whose contact ratio builds up gradually along the face width. That geometry gives them high load capacity, low running noise and smooth transmission, which is why they dominate final drives in automotive axles, aerospace gearboxes and marine propulsion. The manufacturing chain is unforgiving: the teeth are cut on a mechanical or CNC generator, carburized and quenched, and then ground. Grinding is the last operation, so it sets not only the final tooth geometry but also the state of the outermost layer — roughness, residual stress, hardness and microstructure.
In generating grinding, a cup-shaped wheel plays the role of a single tooth of a virtual generating gear (the crown gear). The workpiece rotates in a fixed ratio with the cradle while the wheel advances, so the envelope of the wheel reproduces the conjugate flank. Three parameters are set from the machine program: grinding wheel linear speed vs, generating speed vw (the rate at which the contact sweeps along the tooth), and grinding depth ap. Each of them reaches the surface through a different physical route, and the routes do not agree with each other. That disagreement, rather than any single parameter, is the engineering problem.
Two competing mechanisms behind every parameter choice
Ground topography is the superposition of scratches left by individual grits. The residual height left on the flank depends on how many cutting edges pass a given point per unit time, how long each scratch is, and how thick the undeformed chip is. Increasing vs raises the number of active grits per unit time and the number of repeated passes; increasing vw lengthens each scratch; reducing ap thins the chip. All three therefore lower the residual height, and grit-kinematics simulations reproduce this monotonic behaviour.
Residual stress behaves differently because it results from the competition between mechanical and thermal loading. The grits exert a Hertzian pressure field that plastically stretches the surface layer and leaves compressive stress, typically within 5–15 µm of the surface. Simultaneously, the heat generated in the contact zone expands the surface against a colder substrate, and the subsequent contraction after cooling leaves tensile stress. Phase transformation adds a third contribution whose sign depends on the specific transformation. The final state is the sum of these effects, mediated by the grinding force and the heat flux, which decompose in the conventional way:
$$F_n = F_{nc} + F_{ns}, \qquad F_t = F_{tc} + F_{ts}$$
where the subscripts c and s denote chip formation and sliding. The practical question is therefore not whether a parameter is “good”, but whether it scales force or heat more strongly.
Contact geometry, force and heat flux for a representative gear
For a 33-tooth spiral bevel gear (face width 38 mm, mid-face spiral angle 35°, pitch cone angle 64.13°, outer diameter 217.63 mm, outer cone distance 119.19 mm, working depth 11 mm) ground with a 190.5 mm profile wheel of 20° pressure angle and 80 grit, the contact zone was characterised by treating the instantaneous contact as an ellipse. Its short semi-axis grows with depth: 0.9585 mm at ap = 0.05 mm, 1.0531 mm at 0.13 mm and 1.1517 mm at 0.21 mm. The instantaneous contact line at mid-face of the convex flank measures 41.09 mm; its length varies with cradle angle, rising from the toe to a maximum near mid-face and then falling, which is also why the computed grinding force follows the same bell shape along the tooth.
The computed quantities that feed the thermal–mechanical model show how asymmetric the three parameters really are. Varying wheel speed over 16–24 m/s leaves the tangential force essentially constant (20.05 N to 20.00 N) while raising the heat flux by about 50%, from 8.29 × 10⁶ to 1.24 × 10⁷ W/m². Varying generating speed over 400–1200 mm/min raises both, but heat far more steeply. Varying depth raises force by roughly 27% while the contact width widens enough to keep the heat flux nearly flat.
| Varied parameter | Level | Ft (N) | Contact half-width b (mm) | Heat flux q (W/m²) |
|---|---|---|---|---|
| vs (m/s) | 16 | 20.05 | — | 8.29 × 10⁶ |
| 18 | 20.02 | — | 9.32 × 10⁶ | |
| 20 | 20.01 | 1.0531 | 1.04 × 10⁷ | |
| 22 | 20.00 | — | 1.14 × 10⁷ | |
| 24 | 20.00 | — | 1.24 × 10⁷ | |
| vw (mm/min) | 400 | 12.07 | — | 6.26 × 10⁶ |
| 600 | 16.15 | — | 8.39 × 10⁶ | |
| 800 | 20.01 | — | 1.04 × 10⁷ | |
| 1000 | 24.05 | — | 1.25 × 10⁷ | |
| 1200 | 30.53 | — | 1.59 × 10⁷ | |
| ap (mm) | 0.05 | 17.67 | 0.9585 | 1.01 × 10⁷ |
| 0.09 | 19.01 | 1.0028 | 1.01 × 10⁷ | |
| 0.13 | 20.01 | 1.0531 | 1.04 × 10⁷ | |
| 0.17 | 21.38 | 1.1039 | 1.07 × 10⁷ | |
| 0.21 | 22.46 | 1.1517 | 1.07 × 10⁷ |
Thermal–mechanical simulation: which mechanism wins
The stress field was obtained by indirect coupling in ANSYS Workbench. A single-tooth model was extracted from a parametric solid built from the tooth-surface equations, meshed with local refinement of 0.2 mm on the ground flank, and assigned temperature-dependent properties for 20CrMnTi: Young’s modulus falls from 210 GPa at 20 °C to 191 GPa at 300 °C, Poisson’s ratio stays near 0.30, and conductivity, specific heat and density are 40 W/(m·°C), 460 J/(kg·°C) and 7900 kg/m³. A transient thermal pass applied the moving heat flux in five load steps of 0.0252 s, corresponding to 1° of cradle rotation and a total heating time of 0.126 s, with a convection coefficient of 500 W/(m²·K) on the ground flank and 1100 W/(m²·K) elsewhere at an ambient of 20 °C. The resulting nodal temperatures were then imported as body loads into a static structural pass, together with the computed grinding force on the flank, followed by 10 s of natural cooling with the loads removed.
Extracted at a fixed node on the mid-face (node 47490), the simulated surface stress in the tested window lies between roughly 100 and 350 MPa in tension, with the material initially stress-free. The three parameters shift this value in different directions:
- Wheel speed raises tensile stress. Heat input grows while the force is practically invariant, so the thermal term dominates and the tensile contribution increases with vs.
- Generating speed raises tensile stress most strongly. Both force and heat grow, but the heat flux grows faster, so the thermal term overtakes the mechanical one and the surface becomes progressively more tensile.
- Grinding depth reduces tensile stress. The force rises and the contact widens, spreading the heat over a larger area and keeping the flux nearly constant; mechanical pressing therefore becomes dominant and the tensile contribution falls.
The topography simulation, run with a stochastic wheel model in which grit size and protrusion height follow a normal distribution for an 80-grit wheel over a 1 mm × 1 mm patch, gives the complementary picture: residual height falls as vs and vw rise and as ap falls. Taken together, the two simulations already predict a conflict — the settings that flatten the scratches are the ones that make the stress state more tensile and, as it turns out, the spindle more restless.
Designed experiments on a production gear grinder
The predictions were tested with a central composite design on an H350GH CNC spiral bevel gear grinder, using 20CrMnTi workpieces (33-tooth wheel of a 16–33 pair) and a vitrified-bonded profile wheel of 190.5 mm diameter at 80 grit. Three factors at five coded levels gave 23 runs with three centre points and a repeated axial set: vs = 16–24 m/s, vw = 400–1200 mm/min, ap = 0.05–0.21 mm. The wheel was dressed after each slot to suppress the drift that progressive wear would otherwise introduce, and 23 of the 33 slots were ground, one per parameter set; because the double-flank generating method cuts both flanks simultaneously, the concave flank of one tooth and the convex flank of the next share the same setting.
Three quantities were recorded. Spindle vibration was measured radially on the wheel spindle with a piezoelectric accelerometer and a four-channel USB acquisition unit sampling at 9600 Hz, one file per slot, reduced to the RMS value Grms. Roughness was measured on wire-EDM-sectioned teeth with a white-light interferometer, using the arithmetic mean deviation Ra and averaging the concave and convex flanks of the same setting. Residual stress was measured by X-ray diffraction with the sin²ψ method on a portable analyser specified to ±10 MPa, taking the mean of the mid-height points on both flanks. Over the 23 runs, Ra ranged from 0.286 to 0.586 µm, Grms from 15.6 to 20.1 mm/s², and residual stress from −405 to −622.5 MPa.
An important reference point: unground, heat-treated teeth already carry −626 MPa (concave) and −713 MPa (convex), about −650 MPa on average. Grinding therefore does not create the compressive state; it consumes part of it, in line with the tensile contribution predicted by the simulation. The superposition is not strictly linear — phase transformation in the surface layer and measurement uncertainty both intervene — but the direction and the parameter sensitivity agree.
Regression models and response surfaces
The 23 runs were fitted with the usual second-order response-surface form,
$$Y = \beta_0 + \sum_i \beta_i x_i + \sum_i \beta_{ii} x_i^2 + \sum_{i<j}\beta_{ij} +=""
using vs, vw and ap as the coded inputs. The vibration model retained only linear and interaction terms, since the quadratic terms were not significant; the roughness and stress models retained the full quadratic set.
| Model | F | P | R² | Adjusted R² | Predicted R² | Adequate precision |
|---|---|---|---|---|---|---|
| Grms | 20.26 | < 0.0001 | 0.8837 | 0.8401 | 0.6814 | 15.95 |
| Ra | 11.62 | < 0.0001 | 0.8894 | 0.8128 | 0.6319 | 11.61 |
| Residual stress σ | 14.36 | < 0.0001 | 0.9086 | 0.8453 | 0.6689 | 13.01 |
All three models are significant, and the lack-of-fit tests are non-significant (P = 0.3361, 0.2969 and 0.0841), so the fit is not improved by higher-order terms. Residual diagnostics — normal probability plots, residuals against predicted values, and predicted against measured values — show no trend, no heteroscedasticity and no outliers beyond three standard deviations.
| Term | Grms | Ra | σ |
|---|---|---|---|
| vs | < 0.0001 | 0.0076 | 0.0556 |
| vw | 0.0224 | 0.2222 | < 0.0001 |
| ap | 0.2507 | 0.3890 | 0.1424 |
| vs·vw | 0.0009 | 0.7476 | 0.9058 |
| vs·ap | 0.0107 | 0.7848 | 0.0641 |
| vw·ap | 0.3772 | 0.1998 | 0.0062 |
| vs² | — | < 0.0001 | 0.2082 |
| vw² | — | < 0.0001 | 0.0019 |
| ap² | — | < 0.0001 | 0.1276 |
The three objectives respond in qualitatively different ways. Spindle vibration is dominated by wheel speed: the F value of 88.2 for that single term nearly matches the 20.26 of the whole model. The mechanism is dynamic rather than cutting-related — wheel imbalance from non-uniform grit distribution, porosity and wear is amplified as rotational speed rises, and the effect appears in the interaction with generating speed as well. Generating speed adds a smaller, monotonic contribution, and depth is not significant on its own.
Roughness is the opposite case: the linear terms are weak and all three quadratic terms are highly significant, producing elliptical contours with an interior optimum. The physical reading is that low parameter values leave material incompletely removed — at very small depth the flank near the root is not fully ground because of dressing imperfections — while high values degrade the surface through vibration (wheel speed) or through increased removal rate and force (generating speed). This is where the experiment departs from the monotonic prediction of the grit-kinematics simulation, and the departure is attributable to machine dynamics rather than to the cutting geometry itself.
Residual stress is governed by generating speed, with F = 91.4 for the linear term and additional significance in the vw² and vw·ap terms. Increasing vw consumes compressive stress; increasing ap restores it; vs acts weakly in the tensile direction.
Multi-objective optimization and AHP–TOPSIS selection
The three fitted models become the objective functions of a minimization problem: minimize Grms, minimize Ra, and maximize compressive residual stress (equivalently, minimize its signed value, which is negative). The feasible box is the experimental range, 16 ≤ vs ≤ 24 m/s, 400 ≤ vw ≤ 1200 mm/min and 0.05 ≤ ap ≤ 0.21 mm, with two additional constraints: Ra ≤ 0.6 µm, and an empirical burn limit of the form vs·ap0.75/de0.25 < Cb, calibrated at Cb = 8348 by the observation of slight burn at vs = 22 m/s and ap = 0.21 mm on this wheel and workpiece combination.
The Pareto set was generated with a multi-objective whale optimization algorithm (MOWOA), which models encircling, bubble-net attack and random search, using a population of 150 over 500 iterations, and compared against NSGA-II on the same problem. The comparison used two standard indicators: hypervolume, which measures the volume of objective space dominated by the obtained set, and inverted generational distance, which measures how far the set lies from a reference front. MOWOA reached HV = 0.581 and IGD = 0.042 against 0.555 and 0.060 for NSGA-II — a 4.7% gain in coverage and a 30% reduction in distance to the reference front. Its convergence curve also flattens earlier and at a lower fitness value.
Selecting one point from a Pareto set requires a stated preference. An AHP pairwise comparison gave weights of 0.2976 for roughness, 0.4938 for residual stress and 0.2086 for spindle vibration, consistent at CR = 0.021, reflecting a quality-first policy in which compressive stress matters most because it governs fatigue life. TOPSIS ranking over the filtered set then yields the top solution, which rounds to vs = 21 m/s, vw = 600 mm/min and ap = 0.16 mm. Two other Pareto members are worth noting because they show the shape of the trade-off: a roughness-first weighting selects 20.18 m/s, 705 mm/min and 0.14 mm, while a stress-first weighting selects 19.6 m/s, 456 mm/min and 0.16 mm.
Validation against shop-floor parameters
The selected setting was run on the same machine over three slots and compared with the parameters previously used on the shop floor. The optimized setting deepens the cut and slows the generating motion while slightly raising wheel speed: ap goes from 0.07 to 0.16 mm and vw from 1000 to 600 mm/min.
| Setting | vs (m/s) | vw (mm/min) | ap (mm) | Ra (µm) | σ (MPa) | Grms (mm/s²) |
|---|---|---|---|---|---|---|
| Shop-floor empirical | 20 | 1000 | 0.07 | 0.582 | −476 | 17.5 |
| Optimized | 21 | 600 | 0.16 | 0.471 | −538 | 16.2 |
| Change | — | — | — | −19.07% | +13.02% (more compressive) | −7.43% |
White-light interferometry of the concave flank confirms the mechanism: the optimized surface shows shallower and fewer scratches, consistent with the measured Ra of 0.421 µm against 0.573 µm for the empirical setting in the paired comparison. X-ray measurement of the same flank shows the compressive stress rising from −458 MPa to −566 MPa. The three improvements are not independent — the deeper cut supplies the mechanical pressing that restores compression, and the slower generating motion reduces the heat that would otherwise consume it, while the modest rise in wheel speed improves overlap without pushing imbalance high enough to offset the gain.
What the results imply for process planning
Three conclusions follow that are useful beyond this particular gear. First, the parameters cannot be ranked on a single scale: wheel speed is a vibration variable, generating speed is a thermal variable, and depth is a mechanical variable, so a change intended to improve roughness will move the stress state and the machine dynamics in ways that must be compensated elsewhere. Second, roughness is non-monotonic in all three parameters, which means that pushing a parameter to its cost- or time-favourable extreme is not merely risky but physically wrong — the optimum lies inside the window. Third, the initial stress state of the heat-treated tooth cannot be ignored: grinding here removes roughly 100–250 MPa of pre-existing compression, and any attempt to compare simulation with measurement must account for that baseline rather than reading the simulated tensile value as an absolute.
The limits of the approach are equally clear. The thermal–mechanical model assumes zero initial stress, idealised contact conditions and temperature-independent phase constitution, whereas the real process involves transformation in the surface layer and a strongly non-linear superposition of stresses — which is why the trends match but the absolute values do not. The empirical burn limit is calibrated for one wheel–workpiece pair. And the selected optimum trades productivity for quality, since halving the generating speed lengthens the cycle; for a line constrained by throughput rather than by fatigue life, the roughness-weighted or a time-constrained Pareto member would be the appropriate choice, and the same optimization framework accommodates that by changing the weights rather than the model.