
In this work, I investigated the oil jet lubrication characteristics of high-speed miter gears. Miter gears are widely used in aerospace engines, helicopters, and vehicle transmission systems because they combine high transmission efficiency, structural stability, long service life, and a wide load capacity. However, high-speed miter gears often operate under severe conditions, and inadequate lubrication can cause scuffing, pitting, and wear. Therefore, I analyzed the flow field and temperature field of miter gears under oil jet conditions to improve lubrication and cooling performance. The main research content includes the establishment of a computational fluid dynamics model, contact analysis, oil film spreading behavior, single- and dual-variable effects, temperature field prediction, convective heat transfer analysis, and experimental verification.
1. Computational Fluid Dynamics Model for High-Speed Miter Gears
I first established a three-dimensional model of a pair of high-speed miter gears. The basic parameters are listed in Table 1. The miter gears had a normal module of 3.5 mm, a normal pressure angle of 23°, a helix angle of 27.5°, and a center distance of 170.42 mm. The driving gear had 40 teeth, and the driven gear had 37 teeth.
| Parameter | Value | Parameter | Value |
|---|---|---|---|
| Driving gear teeth | 40 | Transverse pressure angle (°) | 25.573 |
| Driven gear teeth | 37 | Addendum coefficient | 1.297 |
| Normal module (mm) | 3.5 | Material | 18CrNiMo7-6 |
| Normal pressure angle (°) | 23 | Density (kg/m³) | 7870 |
| Helix angle (°) | 27.5 | Specific heat (J/kg·K) | 460 |
| Clearance coefficient | 0.25 | Thermal conductivity (J/m·s·K) | 38 |
| Face width (mm) | 60 | Elastic modulus (Pa) | 2.1×10¹¹ |
| Center distance (mm) | 170.42 | Poisson’s ratio | 0.30 |
To improve the meshing state, I applied drum-shaped modification to the miter gear tooth surfaces. The modification amount was 20 µm. This changed the tooth surface contact from line contact to point contact, which reduced impact and vibration. A representative miter gear assembly is shown below.
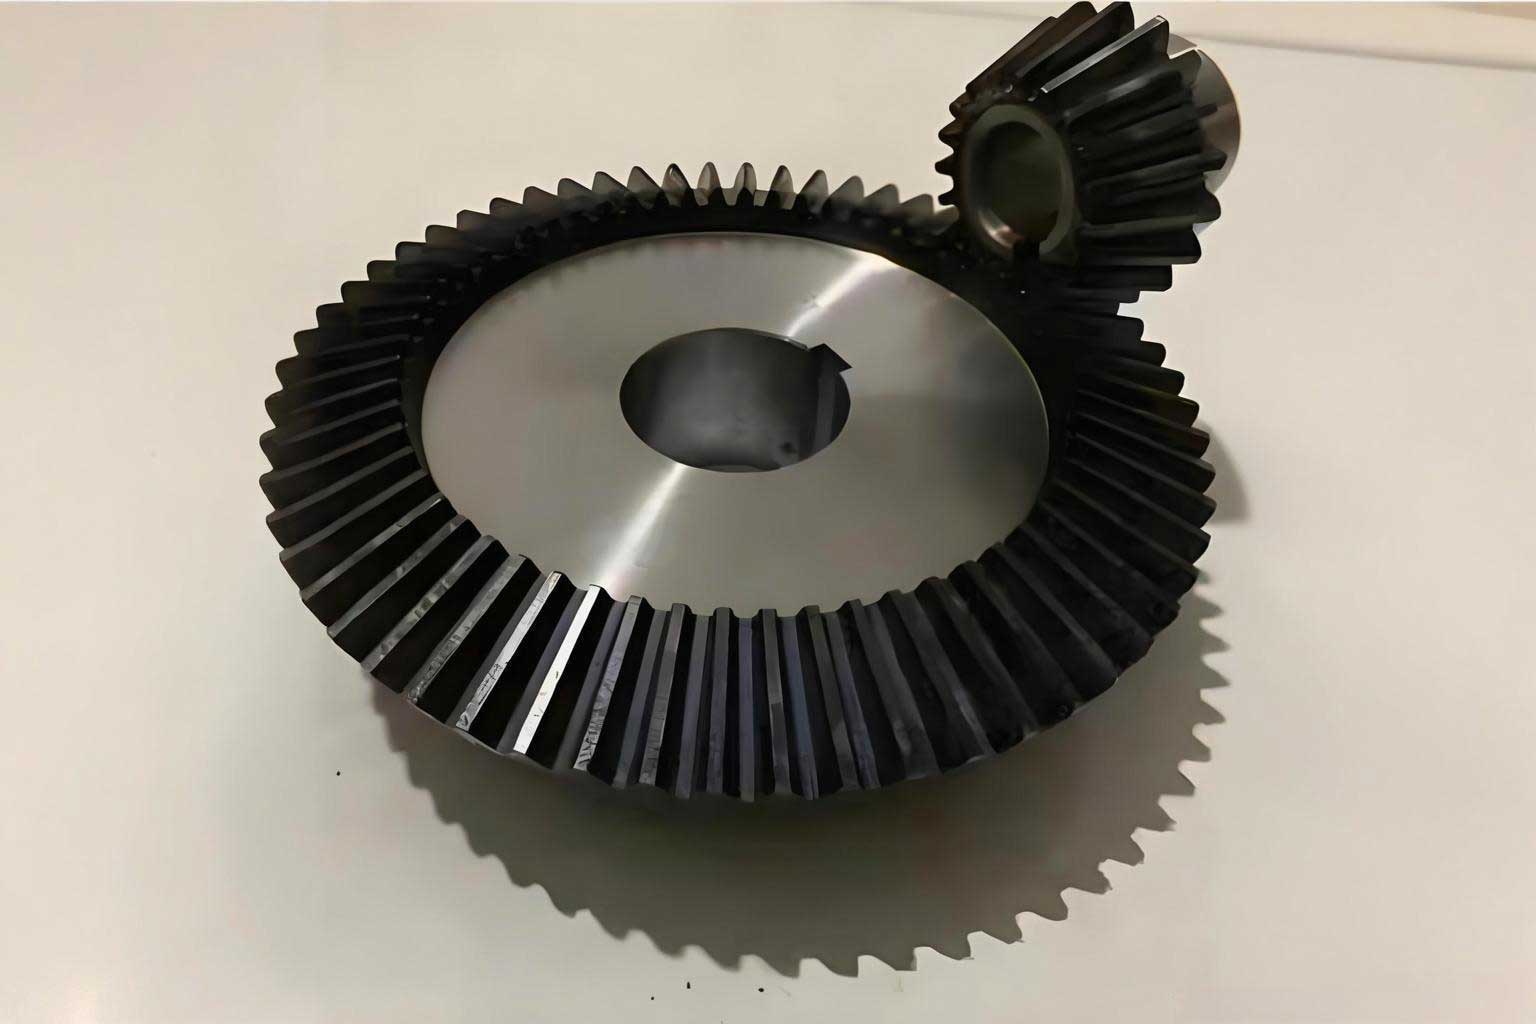
For the contact analysis, I considered the miter gear as two helical gears with equal but opposite helix angles. The time-varying contact line length was calculated as follows. When the transverse contact ratio is greater than the axial contact ratio, the contact line length is given by
$$ l_i =
\begin{cases}
s_i / \sin\beta_b, & 0 \le s_i < p_{bt} \\
B / \cos\beta_b, & p_{bt} \le s_i < p_{bt} + B \tan\beta_b \\
(s_i – B \tan\beta_b) / \sin\beta_b, & p_{bt} + B \tan\beta_b \le s_i < L_0
\end{cases} $$
When the transverse contact ratio is smaller than the axial contact ratio, the contact line length is
$$ l_i =
\begin{cases}
s_i / \sin\beta_b, & 0 \le s_i < p_{bt} \\
p_{bt} / \sin\beta_b, & p_{bt} \le s_i < B \tan\beta_b \\
(s_i – B \tan\beta_b) / \sin\beta_b, & B \tan\beta_b \le s_i < L_0
\end{cases} $$
The total contact line length is
$$ L = \sum_{i=1}^{K} l_i $$
The equivalent radius of curvature in the x-direction is
$$ R_x = \frac{R_{1x} R_{2x}}{R_{1x} + R_{2x}} $$
where the individual radii are
$$ R_{1x} = \frac{R’_{1x}}{\cos\beta_b}, \quad R_{2x} = \frac{R’_{2x}}{\cos\beta_b} $$
The equivalent radius in the y-direction is
$$ R_y = \frac{b^2}{8 C_a \cos\beta_b} $$
The entrainment velocity is calculated from the rolling speeds of the two miter gear surfaces:
$$ U_e = \frac{U_1 + U_2}{2} $$
where
$$ U_1 = \omega_1 R_{1x}, \quad U_2 = \omega_2 R_{2x} $$
The normal contact force on a single tooth pair is
$$ F_{ni} = \gamma F_n $$
where the load distribution ratio is
$$ \gamma = \frac{l_i}{L} $$
The slide-roll ratio is defined as
$$ s = \frac{U_1 – U_2}{U_e} $$
I calculated the contact parameters for five representative meshing points: O1 and O2 on the incoming side, O3 at the pitch point, and O4 and O5 on the outgoing side. The results showed that the contact line length first increased and then decreased, reaching a maximum in the middle of the meshing cycle. The normal contact force followed a similar quadratic trend and reached its maximum near the pitch point. The slide-roll ratio first decreased to a constant value and then increased, indicating that the miter gear surfaces experienced a period of nearly pure rolling near the pitch point.
2. Oil Jet Lubrication Theory and CFD Setup
I used a multiphase flow model to simulate the oil-air mixture during oil jet lubrication. The volume fraction conservation equation is
$$ \sum_{\alpha=1}^{n} r_{\alpha} = 1 $$
For the oil-air two-phase flow, the volume conservation is
$$ r_o + r_a = 1 $$
The continuity equation for each phase is
$$ \frac{\partial}{\partial t} (r_{\alpha} \rho_{\alpha}) + \nabla \cdot (r_{\alpha} \rho_{\alpha} \mathbf{U}_{\alpha}) = \sum_{\beta=1}^{n} \Gamma_{\alpha\beta} + S_{\alpha} $$
The momentum conservation equation is
$$ \frac{\partial}{\partial t} (r_{\alpha} \rho_{\alpha} \mathbf{U}_{\alpha}) + \nabla \cdot (r_{\alpha} \rho_{\alpha} \mathbf{U}_{\alpha} \mathbf{U}_{\alpha}) = -r_{\alpha} \nabla p + \nabla \cdot (r_{\alpha} \mu_{\alpha} (\nabla \mathbf{U}_{\alpha} + (\nabla \mathbf{U}_{\alpha})^T)) + \mathbf{M}_{\alpha} + \sum_{\beta=1}^{n} (\Gamma_{\alpha\beta} \mathbf{U}_{\beta} – \Gamma_{\beta\alpha} \mathbf{U}_{\alpha}) $$
For turbulence, I used the \(k\)-\(\varepsilon\) model, where the turbulent viscosity is
$$ \mu_t = \rho C_{\mu} \frac{k^2}{\varepsilon} $$
with \(C_{\mu} = 0.09\). The turbulent kinetic energy \(k\) and its dissipation rate \(\varepsilon\) are solved from their transport equations. I also considered the \(k\)-\(\omega\) model, where the turbulent viscosity is
$$ \mu_t = \rho \frac{k}{\omega} $$
For the CFD model, I created a fluid domain around the miter gears. The gear surfaces were set as no-slip walls, and the oil nozzle was set as a velocity inlet. The oil density was 860 kg/m³, the dynamic viscosity was 0.039 Pa·s, and the surface tension coefficient was 0.071 N/m. The time step was \(1 \times 10^{-5}\) s, and the convergence residual was \(1 \times 10^{-4}\). To avoid negative volume meshes, I moved the driven gear along the positive x-axis by 1.5 mm, increasing the center distance to 171.92 mm. The mesh model contained approximately 906,000 cells.
3. Factors Affecting Oil Jet Lubrication of Miter Gears
I compared oil injection on the incoming side and the outgoing side. For the incoming side, the jet trajectory was analyzed under different gear speeds and injection speeds. The results are summarized in Table 2. When the injection speed was fixed at 35 m/s and the gear speed increased from 2800 r/min to 10000 r/min, the jet gradually deviated from the meshing zone. At 10000 r/min, only a small amount of oil reached the meshing region. When the gear speed was fixed at 6900 r/min and the injection speed varied from 10 m/s to 40 m/s, the jet deviation decreased as the injection speed increased. At 10 m/s, the jet deviated significantly.
| Injection side | Injection speed (m/s) | Gear speed (r/min) | Observed behavior |
|---|---|---|---|
| Incoming | 35 | 2800 | Jet almost unaffected, oil enters meshing zone |
| Incoming | 35 | 4500 | Jet slightly deviated, oil still enters meshing zone |
| Incoming | 35 | 5900 | Noticeable deviation, reduced oil supply |
| Incoming | 35 | 10000 | Strong deviation, very little oil reaches meshing zone |
| Incoming | 10 | 6900 | Severe deviation, poor lubrication |
| Incoming | 20 | 6900 | Minor deviation, sufficient oil supply |
| Incoming | 30 | 6900 | Almost no deviation |
| Incoming | 40 | 6900 | No deviation, excellent oil supply |
| Outgoing | 35 | 2800 | Air barrier causes reverse flow, almost no oil in meshing zone |
| Outgoing | 40 | 6900 | Complete reverse flow, lubrication fails |
For the outgoing side, the high-speed rotating flow field created an air barrier. Even at an injection speed of 40 m/s and a gear speed of 6900 r/min, the jet was completely reversed, and almost no oil reached the meshing zone. Therefore, I selected the incoming side for all subsequent studies.
I then analyzed the oil film spreading process on the miter gear tooth surfaces. The oil jet first formed a liquid column, then impacted the tooth surface. The contact line between oil, air, and tooth surface expanded outward. The film thickness reached a maximum at the moment of impact and then decreased to a stable value. The spreading process is governed by inertia, viscous force, surface tension, and contact line forces.
I validated the numerical model of oil droplet impact and deposition against experimental data from the literature. The simulated oil film thickness agreed well with the experimental results, confirming the reliability of the model. The initial parameters were: nozzle diameter 2 mm, injection distance 56 mm, injection speed 35 m/s, driving gear speed 8000 r/min, and driven gear speed 8649 r/min. The oil film thickness on the driving gear reached a maximum of about 640 nm at 1.5 ms and then decreased to about 67 nm at 4 ms.
I studied the effect of injection speed on oil film thickness. The results are shown in Table 3. As the injection speed increased from 24 m/s to 40 m/s, the initial film thickness and the final stable film thickness both increased. The time required for the oil to reach the tooth surface decreased. The film thickness did not increase linearly with injection speed because of the balance among inertia, viscous, and surface tension forces.
| Injection speed (m/s) | Initial film thickness (nm) | Final film thickness (nm) | Time to reach surface (ms) |
|---|---|---|---|
| 24 | 420 | 52 | 2.4 |
| 28 | 480 | 56 | 2.1 |
| 32 | 540 | 60 | 1.9 |
| 36 | 590 | 64 | 1.7 |
| 40 | 640 | 67 | 1.5 |
I also studied the effect of gear speed on oil film thickness. The results are given in Table 4. As the gear speed increased from 4200 r/min to 15400 r/min, the oil film thickness decreased. At lower speeds, the gear had more time to receive lubrication, but the oil film was thinner because the oil had more time to drain. At higher speeds, the meshing cycle became shorter, and the oil was carried away more quickly, resulting in a thinner film.
| Gear speed (r/min) | Initial film thickness (nm) | Final film thickness (nm) |
|---|---|---|
| 4200 | 700 | 72 |
| 7000 | 610 | 65 |
| 9800 | 520 | 58 |
| 12600 | 450 | 52 |
| 15400 | 390 | 47 |
The effect of injection distance on oil film thickness is shown in Table 5. The injection distance had only a minor effect on the final film thickness, which remained around 60 nm. However, a larger injection distance increased the time required for the oil to reach the tooth surface. If the injection distance was too small, the oil path could be blocked by the high-speed rotating teeth. Therefore, an appropriate injection distance is necessary for optimal lubrication.
| Injection distance (mm) | Time to reach surface (ms) | Final film thickness (nm) |
|---|---|---|
| 76 | 3.2 | 58 |
| 64 | 2.8 | 59 |
| 52 | 2.3 | 60 |
| 40 | 1.9 | 61 |
| 28 | 1.5 | 62 |
4. Dual-Variable Coupling Effects on Oil Jet Lubrication
I analyzed the coupling effects of injection speed, gear speed, and injection distance on the oil-gas ratio and total gas-liquid pressure in the meshing zone. The oil-gas ratio and total pressure are key indicators of lubrication performance.
First, I studied the coupling effect of injection speed and gear speed. The injection distance was fixed at 56 mm. The oil-gas ratio and total gas-liquid pressure are shown in Table 6 and Table 7. The highest oil-gas ratio occurred at an injection speed of 40 m/s and a gear speed of 4200 r/min. The oil-gas ratio increased with decreasing gear speed and increasing injection speed. The total gas-liquid pressure increased with increasing gear speed and injection speed. The highest total pressure occurred at 40 m/s and 15400 r/min, which hindered oil penetration into the meshing zone.
| Gear speed (r/min) | 24 m/s | 28 m/s | 32 m/s | 36 m/s | 40 m/s |
|---|---|---|---|---|---|
| 4200 | 24.56 | 24.98 | 25.23 | 25.99 | 26.40 |
| 7000 | 21.16 | 22.35 | 23.67 | 23.99 | 24.84 |
| 9800 | 19.68 | 20.05 | 21.39 | 21.96 | 23.31 |
| 12600 | 19.03 | 20.19 | 20.91 | 21.58 | 22.39 |
| 15400 | 17.30 | 17.98 | 18.83 | 19.27 | 20.84 |
| Gear speed (r/min) | 24 m/s | 28 m/s | 32 m/s | 36 m/s | 40 m/s |
|---|---|---|---|---|---|
| 4200 | 1987.82 | 3021.73 | 5063.97 | 6962.87 | 8054.23 |
| 7000 | 2450.52 | 3964.25 | 5445.63 | 7022.97 | 8705.65 |
| 9800 | 3123.27 | 4285.09 | 5831.78 | 7354.44 | 9603.21 |
| 12600 | 3507.92 | 4807.92 | 6470.06 | 7976.18 | 9914.89 |
| 15400 | 4723.42 | 5783.31 | 7098.47 | 8825.45 | 10189.24 |
Second, I studied the coupling effect of injection speed and injection distance. The gear speed was fixed at 8000 r/min. The results are shown in Table 8 and Table 9. The highest oil-gas ratio occurred at an injection speed of 40 m/s and an injection distance of 28 mm. The oil-gas ratio increased with increasing injection speed and decreasing injection distance. The total gas-liquid pressure increased with increasing injection speed and decreasing injection distance. However, the oil-gas ratio changed faster than the total pressure, so a high injection speed and a small injection distance are preferable.
| Injection speed (m/s) | 28 mm | 40 mm | 52 mm | 64 mm | 76 mm |
|---|---|---|---|---|---|
| 24 | 28.96 | 26.35 | 23.82 | 23.03 | 19.05 |
| 28 | 30.11 | 28.54 | 22.65 | 23.97 | 20.30 |
| 32 | 37.19 | 34.25 | 30.08 | 27.82 | 22.14 |
| 36 | 42.98 | 37.54 | 33.15 | 30.19 | 26.48 |
| 40 | 48.12 | 41.44 | 40.25 | 36.58 | 31.61 |
| Injection speed (m/s) | 28 mm | 40 mm | 52 mm | 64 mm | 76 mm |
|---|---|---|---|---|---|
| 24 | 2465.16 | 2156.75 | 2005.51 | 1694.28 | 1163.49 |
| 28 | 2868.72 | 2702.31 | 2465.41 | 2263.15 | 1755.28 |
| 32 | 3648.53 | 3559.48 | 3184.73 | 2711.59 | 2025.48 |
| 36 | 4209.84 | 3995.42 | 3526.68 | 3658.29 | 2891.57 |
| 40 | 5758.64 | 5569.34 | 4827.43 | 4758.69 | 3995.88 |
Third, I studied the coupling effect of gear speed and injection distance. The injection speed was fixed at 35 m/s. The results are shown in Table 10 and Table 11. The oil-gas ratio decreased with increasing gear speed and increasing injection distance. The total gas-liquid pressure did not change linearly with gear speed and injection distance; multiple peaks were observed.
| Gear speed (r/min) | 28 mm | 40 mm | 52 mm | 64 mm | 76 mm |
|---|---|---|---|---|---|
| 4200 | 43.34 | 41.27 | 38.26 | 37.95 | 34.16 |
| 7000 | 39.25 | 38.28 | 34.14 | 34.62 | 31.68 |
| 9800 | 31.86 | 32.65 | 29.08 | 27.59 | 24.22 |
| 12600 | 24.66 | 24.02 | 21.44 | 19.99 | 20.23 |
| 15400 | 18.34 | 16.52 | 15.79 | 15.21 | 13.54 |
| Gear speed (r/min) | 28 mm | 40 mm | 52 mm | 64 mm | 76 mm |
|---|---|---|---|---|---|
| 4200 | 3128.95 | 2866.15 | 2568.27 | 3358.29 | 3046.64 |
| 7000 | 2762.18 | 3466.22 | 4025.88 | 3662.63 | 3433.16 |
| 9800 | 3038.29 | 2891.32 | 3225.43 | 3195.11 | 2995.57 |
| 12600 | 3305.30 | 3496.09 | 4124.12 | 3513.14 | 3215.19 |
| 15400 | 2923.24 | 3045.78 | 3489.67 | 2898.87 | 3321.34 |
5. Temperature Field and Convective Heat Transfer of Miter Gears
I calculated the relative sliding speed, friction coefficient, and friction heat generation of the miter gear tooth surfaces. The relative sliding speed at meshing point O3 is
$$ v_{sO3} = v_{tO3,1} – v_{tO3,2} $$
where the tangential speeds are
$$ v_{tO3,1} = \omega_1 r_{b1} \left( \frac{r_{tO3}}{r_{b1}} \right) \cos\alpha_{tO3} = \omega_1 r_{tO3} \sin\alpha_{tO3} $$
$$ v_{tO3,2} = \omega_2 r_{b2} \left( \frac{r_{tO3}}{r_{b2}} \right) \cos\alpha_{tO3} = \omega_2 r_{tO3} \sin\alpha_{tO3} $$
The friction coefficient was calculated using the Ree-Eyring model. The total friction force is
$$ F = \iint_{\Omega} \tau \, dx \, dy $$
where
$$ \tau = \tau_0 \sinh^{-1} \left( \frac{\eta \Delta u}{\tau_0 h} \right) $$
The friction coefficient is
$$ f = \frac{F}{F_n} $$
The friction heat generation rate is
$$ q = f F_n V_s $$
The heat is distributed between the driving and driven gears according to
$$ q_1 = \kappa q, \quad q_2 = (1 – \kappa) q $$
where the distribution coefficient is
$$ \kappa = \frac{\sqrt{\lambda_1 \rho_1 c_1 V_{s1}}}{\sqrt{\lambda_1 \rho_1 c_1 V_{s1}} + \sqrt{\lambda_2 \rho_2 c_2 V_{s2}}} $$
The steady-state average friction heat power is
$$ q_{a1} = \kappa q_m \frac{2a}{t_m V_{s1}}, \quad q_{a2} = (1 – \kappa) q_m \frac{2a}{t_m V_{s2}} $$
I calculated the friction heat generation at five meshing points. The results are shown in Table 12. The friction heat on the driving gear was greater than that on the driven gear. The heat generation was higher on the incoming and outgoing sides and nearly zero near the pitch point, following a V-shaped trend.
| Meshing point | Driving gear heat (W) | Driven gear heat (W) |
|---|---|---|
| O1 (incoming) | 185.4 | 142.7 |
| O2 | 120.6 | 92.8 |
| O3 (pitch) | 2.1 | 1.6 |
| O4 | 118.9 | 91.5 |
| O5 (outgoing) | 182.3 | 140.2 |
I established a finite element model of a single miter gear tooth to solve the body temperature field. The heat balance equation is
$$ \int_{t}^{t+t_T} \left( k \left( \frac{\partial^2 T_B}{\partial x^2} + \frac{\partial^2 T_B}{\partial y^2} + \frac{\partial^2 T_B}{\partial z^2} \right) + k \left( \frac{\partial^2 T_F}{\partial x^2} + \frac{\partial^2 T_F}{\partial y^2} + \frac{\partial^2 T_F}{\partial z^2} \right) \right) dt = \int_{t}^{t+t_T} \rho c \left( \frac{\partial T_B}{\partial t} + \frac{\partial T_F}{\partial t} \right) dt $$
The boundary conditions are
$$ -k \frac{\partial T_B}{\partial n} = h_t (T_B – T_a) + q_F $$
$$ -k \frac{\partial T_B}{\partial n} = h_t (T_B – T_a) $$
$$ -k \frac{\partial T_B}{\partial n} = h_s (T_B – T_a) $$
I loaded the average friction heat flux and convective heat transfer coefficients on the tooth surface, addendum surface, and end faces. The maximum body temperature of the miter gear was about 60°C, located at the tooth tip. This is because the friction coefficient and friction heat flux are higher near the tooth tip.
I then analyzed the convective heat transfer coefficient of the tooth surface under different injection parameters. The average convective heat transfer coefficient increased with increasing injection speed, as shown in Table 13. The effect of injection distance is shown in Table 14. The average convective heat transfer coefficient decreased slightly with increasing injection distance, but the effect was smaller than that of injection speed. Therefore, injection speed is the primary parameter for improving cooling performance.
| Injection speed (m/s) | Driving gear HTC (W/m²·K) | Driven gear HTC (W/m²·K) |
|---|---|---|
| 24 | 1850 | 1720 |
| 28 | 2150 | 2010 |
| 32 | 2480 | 2320 |
| 36 | 2790 | 2610 |
| 40 | 3120 | 2930 |
| Injection distance (mm) | Driving gear HTC (W/m²·K) | Driven gear HTC (W/m²·K) |
|---|---|---|
| 76 | 2510 | 2360 |
| 64 | 2580 | 2420 |
| 52 | 2650 | 2490 |
| 40 | 2600 | 2440 |
| 28 | 2540 | 2390 |
6. Experimental Verification
I built an oil jet lubrication test rig for high-speed miter gears. The test rig consisted of a gear transmission device, an oil injection device, and a temperature measurement device. The driving gear was connected to a three-phase asynchronous motor. The oil pump supplied oil to the meshing zone through a nozzle. The nozzle position could be adjusted to change the injection distance and angle. I used contact thermocouples to measure the tooth surface temperature because the oil mist environment reduced the accuracy of non-contact methods.
The test gear parameters were the same as those in Table 1. I scaled down the injection speed and gear speed proportionally for laboratory safety. For the incoming side, I measured the jet offset under different gear speeds and injection speeds. The results are shown in Table 15. The jet offset increased with increasing gear speed and decreased with increasing injection speed. These trends agreed with the simulation results.
| Gear speed (r/min) | Injection speed (m/s) | Jet offset (mm) |
|---|---|---|
| 380 | 3.5 | 2.1 |
| 450 | 3.5 | 3.8 |
| 690 | 3.5 | 6.5 |
| 840 | 3.5 | 9.2 |
| 690 | 1.0 | 14.6 |
| 690 | 2.0 | 8.9 |
| 690 | 3.0 | 5.2 |
| 690 | 4.0 | 3.1 |
For the outgoing side, I observed the air barrier phenomenon. At an injection speed of 3.5 m/s and a gear speed of 280 r/min, the jet was partially reversed. At 4 m/s and 690 r/min, complete reverse flow occurred, and almost no oil reached the meshing zone. This confirmed that the incoming side is superior for oil jet lubrication of high-speed miter gears.
I also conducted cooling experiments. A specimen was heated to 60°C, and then oil was sprayed onto it. The surface temperature was measured after 30 s. The results are shown in Table 16 and Table 17. The cooling effect improved with increasing injection speed and decreasing injection distance. The influence of injection speed was stronger than that of injection distance. These experimental results agreed with the numerical simulations.
| Injection speed (m/s) | Surface temperature after 30 s (°C) | Temperature drop (°C) |
|---|---|---|
| 2 | 52.3 | 7.7 |
| 3 | 48.6 | 11.4 |
| 4 | 44.1 | 15.9 |
| 5 | 40.2 | 19.8 |
| 6 | 36.8 | 23.2 |
| Injection distance (mm) | Surface temperature after 30 s (°C) | Temperature drop (°C) |
|---|---|---|
| 76 | 50.5 | 9.5 |
| 64 | 48.9 | 11.1 |
| 52 | 47.2 | 12.8 |
| 40 | 45.8 | 14.2 |
| 28 | 44.6 | 15.4 |
7. Conclusions
I studied the oil jet lubrication characteristics of high-speed miter gears using computational fluid dynamics, finite element analysis, and experiments. The main conclusions are as follows.
(1) Drum-shaped modification improved the contact state of the miter gears. The contact analysis provided the input conditions for friction heat calculation. The time-varying contact line length, equivalent radius of curvature, entrainment velocity, normal contact force, and slide-roll ratio were obtained.
(2) The incoming side oil injection provided better lubrication than the outgoing side. The outgoing side suffered from an air barrier and reverse flow. The oil film spreading model was validated against experimental data. The film thickness increased with increasing injection speed and decreasing gear speed. The injection distance mainly affected the spreading time, not the final film thickness.
(3) The dual-variable coupling analysis showed that the best lubrication conditions were: injection speed 40 m/s and gear speed 4200 r/min; injection speed 40 m/s and injection distance 28 mm; and low gear speed with small injection distance. The oil-gas ratio and total gas-liquid pressure were used as indicators.
(4) The friction heat on the driving gear was greater than that on the driven gear. The maximum body temperature of the miter gear was about 60°C at the tooth tip. The average convective heat transfer coefficient increased with increasing injection speed and decreased with increasing injection distance. Injection speed had a stronger effect than injection distance.
(5) The experimental results verified the numerical simulations. The jet offset increased with increasing gear speed and decreased with increasing injection speed. The cooling performance improved with increasing injection speed and decreasing injection distance. These findings provide guidance for the design of oil jet lubrication systems for high-speed miter gears.