
Face gears represent a special class of conical gearing in which a cylindrical pinion meshes with a face gear disc. The transmission offers high contact ratio, strong load-carrying capacity, a compact envelope, and the absence of axial feed force. For these reasons, face gears have been adopted in high-speed and heavy-duty machinery, and in recent years they have become increasingly attractive for aerospace transmission systems. In lightweight aerospace gearboxes, although thin-walled housings deform and displace the gear axes, the contact pattern of a face gear is relatively insensitive to such displacement, which further strengthens its suitability for flight applications.
Conventional manufacturing of face gears relies mainly on gear hobbing, gear shaping, and gear shaving. These processes suffer from low productivity, substantial material waste, and interrupted metal flow lines along the tooth surface. To overcome these limitations, I adopted a process chain consisting of roll forming, gear cutting, heat treatment, precision grinding, and surface strengthening. In this work I focus only on the two stages that precede heat treatment, namely roll forming and gear cutting. The objective is to characterize the deformation of the tooth surface during hot pre-cutting, to quantify how different combinations of process parameters influence that deformation, to investigate the contribution of residual stress, and finally to build a predictive model that can be validated experimentally.
Research Background and Significance
Face gear transmission can be arranged with either orthogonal or non-orthogonal axes. It allows a large reduction ratio to be realized with fewer stages, which is a decisive advantage in aero-engines where every gram of mass matters. The tooth surface quality and the geometric accuracy of the face gear directly govern the service life of the transmission. Tooth surface deformation is therefore one of the most important quality indicators, and understanding its evolution is essential for improving overall performance.
The factors that influence tooth surface deformation are numerous. They include the process parameters, the tool path, the residual stress field, and the material properties. My approach is to combine finite element simulation with a controlled experimental campaign so that the deformation of the tooth surface can be predicted and subsequently controlled. The near-net-shape route that I selected, hot roll forming followed by gear cutting as a semi-finishing operation, is intended to preserve the continuous metal flow lines of the forged state while still delivering the dimensional accuracy required before heat treatment.
Near-Net-Shape Forming of Gears
Progress in Gear Forging
Closed-die hot forging of bevel gears began to be used industrially in the middle of the last century. Compared with conventional milling, forging reduces material loss, lowers production cost, preserves an uninterrupted fibrous metal structure, and shortens the cycle time. Precision forging is generally classified into hot precision forging, warm precision forging, cold precision forging, and combined precision forging. Early analytical work established how the principal process variables affect tooth accuracy, and subsequent finite element studies improved the design of toothed dies by providing formulas for die dimensions, ring dimensions, and radial interference.
In my assessment, forging still presents several difficulties. When the module is small, die filling becomes difficult, the dies are prone to damage, the elastic recovery of the die and of the workpiece after ejection reduces tooth accuracy, and demolding can be problematic. These issues motivate the search for an alternative near-net-shape route.
Progress in Gear Roll Forming
Gear roll forming is a green and highly efficient technology that combines the characteristics of forging and rolling. Two variants exist: flat-die rolling with toothed racks, and cylindrical-die rolling with a pair of synchronized toothed rolls. In cylindrical-die rolling, the rolls rotate in the same direction and at the same speed while remaining in continuous mesh, and a hydraulic system drives them radially into the workpiece at a constant feed rate. As the rolls advance, the outer circumference of the workpiece undergoes plastic deformation, and the complete tooth profile is generated progressively.
Compared with forging, roll forming offers better filling of the tooth corner, because contact is localized and the load on the roll is smaller. The roll engages the workpiece many times, so the achievable tooth accuracy is higher. Roll forming therefore avoids the incomplete corner filling, die damage, and demolding difficulties associated with forging, and it retains a favorable outlook for industrial application.
Face Gear Machining and Gear Cutting
Research on face gear generation began with the geometric description of the tooth surface and the derivation of the meshing equations. Shaping was the first practical method: a shaper cutter with the same parameters as the mating pinion reciprocates axially and thereby generates a virtual pinion in full conjugation with the face gear. Later developments introduced a worm hob or grinding worm, a disc-shaped grinding wheel that emulates a single tooth of the mating pinion, and a five-axis grinding machine capable of producing aerospace-grade accuracy.
Domestic progress followed a similar trajectory. Researchers established the mathematical model of face gear shaping, derived the conditions for avoiding undercut at the inner radius and pointing at the outer radius, and verified the feasibility of shaping, hobbing, spherical-hob hobbing, and plunge milling. Additive manufacturing, investment casting, and shaving have also been explored. Each of these methods, however, has limitations: hobbing cannot easily produce internal profiles, shaping requires a reciprocating return stroke and is therefore slow, and shaving is restricted to finishing.
Gear cutting, also described as skiving or axial gear turning, is a continuous generating process that combines the productivity of hobbing with the versatility of shaping. In gear cutting, the tool axis and the workpiece axis are crossed in space, and the tool and workpiece rotate about their own axes at a prescribed ratio while the tool feeds along the workpiece axis. Because the cutting edges are distributed helically around the tool, the material removal is continuous and the process is well suited to both external and internal gears, whether spur or helical. Gear cutting has been studied extensively with respect to chip formation, local rake angle variation, tool eccentricity, and dynamic behavior. A recent innovation applies gear cutting to face gears by adjusting the offset distance between the tool axis and the face gear axis so that the cutting edge can continuously generate the face gear tooth profile.
Machining Deformation: State of the Art
Machining deformation has been addressed through finite element analysis, experimental analysis, and numerical compensation. Residual-stress-driven deformation prediction methods include experimental measurement, analytical modeling, and finite element modeling. Neural-network-based optimization of cutting parameters, semi-analytical models for thin-walled parts that account for biaxial blank residual stress, distortion potential methods, and coupled analyses of machining-induced and inherent residual stress have all been reported. For gears specifically, the relationship between deformation and residual stress distribution has been investigated, and the internal mechanism of stress evolution has been linked to the observed distortion.
Despite this rich body of work, the deformation of face gears after gear cutting has received comparatively little attention. My contribution is to quantify that deformation, to identify the dominant process parameters, and to deliver a validated prediction model.
Three-Dimensional Modeling of the Face Gear
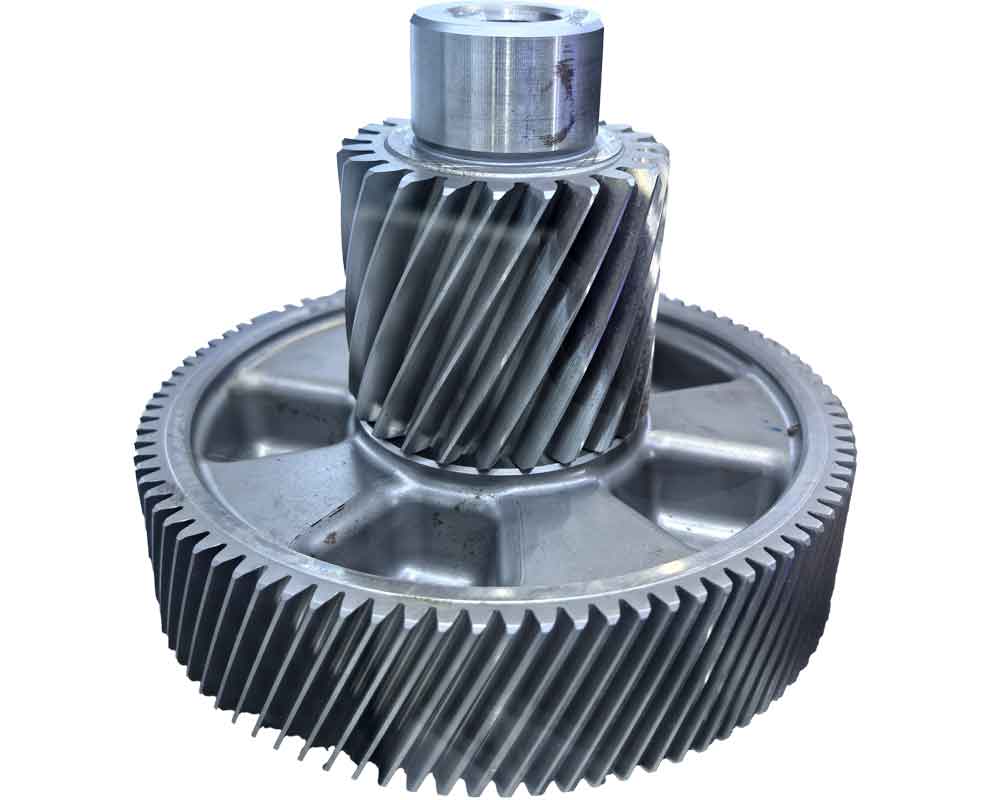
The tooth surface of a face gear is bounded by undercut at the inner radius and pointing at the outer radius, so ordinary involute modeling procedures cannot be applied directly. I therefore computed the tooth surface coordinates and the associated geometric parameters numerically, exported the point cloud in a format readable by a commercial CAD system, and reconstructed the surface by fitting curves, sweeping surfaces, stitching them into a single tooth, and finally patterning the tooth around the axis. The basic parameters of the face gear and of the mating cylindrical pinion are summarized below.
| Parameter | Face gear | Cylindrical pinion |
|---|---|---|
| Module | 4 | 4 |
| Number of teeth | 86 | 23 |
| Pressure angle (deg) | 25 | 25 |
| Shaft angle (deg) | 90 | — |
| Face width (mm) | 25 | — |
| Addendum coefficient | 1 | 1 |
| Clearance coefficient | 0.25 | 0.25 |
The face gear model produced in this way serves as the blank for the roll forming simulation and as the starting geometry for the subsequent gear cutting simulation. The same model is later used to define the theoretical tooth surface against which the machined surface is compared during measurement.
Finite Element Modeling of Hot Roll Forming
I used a general-purpose implicit finite element code specialized for bulk metal forming to simulate the hot roll forming of the face gear. The software supports hot, warm, and cold forming, and it provides automatic remeshing, which is essential when the workpiece undergoes large plastic strain. The simulation workflow consists of preprocessing, solving, and postprocessing. In preprocessing I imported the tool roll, the face gear blank, and the fixture, assigned the material model, defined the motion, generated the mesh, and prescribed the boundary conditions.
Model Setup
The roll is a cylindrical spur gear that mates with the face gear. In the physical process a formed face gear sits above the roll and provides support, while the blank to be rolled sits below. To reduce the computational cost I omitted the upper support gear and constrained the roll to move only radially. The blank was designed according to the constant-volume principle.
The workpiece material was a case-hardening gear steel of the Cr-Ni-Mo family, with the chemical composition and mechanical properties listed below. The blank was treated as an elastic-plastic body, whereas the roll and the fixture were treated as rigid bodies, since their deformation is negligible compared with that of the workpiece.
| Element | C | Si | Mn | P | S | Cr | Ni | Mo |
|---|---|---|---|---|---|---|---|---|
| Mass fraction (%) | 0.20 | 0.29 | 0.76 | 0.018 | 0.013 | 0.53 | 0.50 | 0.25 |
| Property | Value |
|---|---|
| Brinell hardness | ≤ 197 HBS |
| Tensile strength | ≥ 980 MPa |
| Yield strength | ≥ 785 MPa |
| Elongation | ≥ 9 % |
| Reduction of area | ≥ 40 % |
| Impact energy | ≥ 47 J |
Kinematics and Process Stages
The kinematics of the roll forming process require that the roll both rotate about its own axis and orbit about the face gear axis. The rotational speeds must satisfy the meshing condition
$$\omega_1 z_1 = \omega_2 z_2$$
where $\omega_1$ and $z_1$ are the angular velocity and the tooth number of the roll, and $\omega_2$ and $z_2$ are the corresponding quantities for the face gear. The radial feed rate determines how quickly the target tooth depth is reached and hence the total cycle time.
The process is divided into four stages. In the initial feed stage the roll moves only radially and indents the blank, producing shallow marks. In the indexing stage the radial feed is suspended while the roll rotates about its own axis and orbits the blank, producing indentations of uniform depth around the circumference and thereby establishing the correct tooth indexing. In the continuous feed stage the roll rotates, orbits, and simultaneously feeds radially so that the tooth spaces become progressively deeper until the target depth is attained. In the finishing stage the radial feed is stopped and the roll is reversed; after one complete revolution a face gear with uniform tooth depth and identical tooth shape is obtained.
Mesh and Boundary Conditions
I used tetrahedral elements because of the irregular tooth profile, and I adopted relative meshing with a total of approximately 120,000 elements. Local refinement with a ratio of 100:1 was applied to the region that participates in the deformation. The software automatically remeshes whenever the distortion of an element exceeds a threshold, which preserves accuracy throughout the large-strain process. The friction coefficient between the roll and the blank was set to 0.3, and that between the fixture and the blank to 0.7, using a shear friction model. The heat transfer coefficient was taken as 1 N/(s·mm·°C), the ambient temperature as 20 °C, and the convection coefficient as 0.02 N/(s·mm·°C). The step size was controlled by time at 0.1 s per step, with a Newton-Raphson iterative solver.
Analysis of the Roll Forming Process
Metal Flow Behavior
To observe the evolution of the tooth profile I extracted sections of the face gear at different stages of the process. Metal flow during roll forming is complex and asymmetric. Defining the flank that receives a tangential push in the same direction as the rotation of the face gear as the driving flank, the roll tooth B and the roll tooth C respectively press the driven and the driving flank of the face gear tooth. When the roll tooth C first contacts the driving flank, the tangential force is directed downward, the metal flows toward the tooth root, and the flow is restricted. When the roll continues to rotate and the roll tooth B contacts the driven flank, the tangential force is directed upward, the surface metal is stretched and flows toward the tooth tip, and the tip becomes pointed. This asymmetry produces the characteristic “rabbit ear” defect on the driven flank.
The metal flow lines remain continuous throughout the process and never break. Flow is concentrated in the surface layer of the tooth profile, while the flow lines near the root are very dense, which raises the contact fatigue strength. Because the driving and driven flanks experience different tangential forces, the flow is not symmetric, and the mesh on the driven flank is visibly elongated compared with that on the driving flank.
To quantify the redistribution of the surface layer, I tracked 26 points on the blank surface. As rolling proceeds, the surface points become sparser and gradually concentrate near the tooth tip. Approximately 60 % of the original surface points end up in the tip region, while about 40 % remain distributed along the two flanks.
Equivalent Stress
The equivalent stress varies with the stage of forming. It increases from the initial feed stage to the continuous feed stage and then decreases slightly during the finishing stage. The maximum value is on the order of 400 MPa and the minimum on the order of 120 MPa. The highest stress occurs at the root of the tooth where the blank contacts the roll, and it decays progressively toward the other regions.
Rolling Force
The rolling force is defined as the resistance offered by the blank to the roll. Its magnitude governs the selection of the rolling equipment. The force fluctuates continuously but its overall trend is upward, because the indentation depth increases with the radial feed.
To isolate the effect of the process parameters I varied the roll speed and the feed rate independently. The roll speed was set to 20, 30, 40, 50, and 60 r/min, and the feed rate to 0.05, 0.10, 0.15, 0.20, and 0.25 mm/s. The resulting maximum rolling forces are summarized below.
| Roll speed (r/min) | Maximum rolling force at feed rate 0.05 mm/s (N) | Maximum rolling force at feed rate 0.25 mm/s (N) |
|---|---|---|
| 20 | ≈ 9,000 | ≈ 13,000 |
| 30 | ≈ 8,800 | ≈ 12,500 |
| 40 | ≈ 8,600 | ≈ 12,100 |
| 50 | ≈ 8,400 | ≈ 11,700 |
| 60 | ≈ 8,200 | ≈ 11,300 |
The trends can be summarized as follows. At a fixed feed rate, the maximum rolling force decreases as the roll speed increases, because the feed per revolution of the roll decreases, the indentation per revolution is smaller, the metal flow is less pronounced, and the forming resistance therefore drops. At a fixed roll speed, the maximum rolling force increases as the feed rate increases, because the indentation per unit time increases, the volume of deformed metal grows, and the required forming force rises.
Equivalent Strain
The equivalent strain is highest at the tooth root and decreases gradually toward the tooth tip, where it reaches its minimum. To quantify the influence of the process parameters I selected 20 points evenly distributed from the root of the driving flank, along the surface layer, to the root of the driven flank, and I recorded the equivalent strain at each point for different parameter combinations.
For a fixed feed rate, the strain on both flanks follows the same trend from root to tip. The maximum strain on the driven flank exceeds the maximum strain on the driving flank, and the strain at the tip of the driven flank exceeds that at the tip of the driving flank. Increasing the roll speed from 20 to 60 r/min raises the equivalent strain by approximately 1 mm/mm. The physical explanation is that at a fixed feed rate a higher roll speed means more rolling passes per tooth, more contacts between the roll and the flank, and more accumulated frictional deformation; the strain therefore grows with speed.
For a fixed roll speed, the equivalent strain decreases as the feed rate increases. Raising the feed rate from 0.05 to 0.15 mm/s reduces the strain by approximately 1.6 mm/mm. A lower feed rate means more rolling passes per tooth, and each pass consolidates the previous deformation so that the strain becomes more stable. A higher feed rate reduces the number of passes and produces a large indentation per pass, which favors elastic springback and therefore a smaller net strain.
| Process parameter | Trend of equivalent strain | Dominant physical cause |
|---|---|---|
| Roll speed increases (fixed feed rate) | Increases | More passes and more friction cycles per tooth |
| Feed rate increases (fixed roll speed) | Decreases | Fewer passes and more springback per pass |
| Region on the flank | Root > tip | Larger local deformation at the root |
| Flank type | Driven > driving | Tangential force direction differs between flanks |
Directional Strain in X and Z
The strain in the X direction and the strain in the Z direction are of interest because they govern the dimensional change of the tooth. In the X direction the strain is essentially symmetric about the root, negative from the tip to the pitch region, and positive from the pitch region to the root. This sign change reflects the reversal of the friction force across the pitch line. The magnitude increases with roll speed and decreases with feed rate.
In the Z direction the sign pattern is reversed: the strain is positive from the tip to the pitch region and negative from the pitch region to the root. This is a direct consequence of the radial feed, which drives metal upward above the pitch line and downward below it.
Comparing the two directions, I find that the signs of the X-direction and Z-direction strains are almost always opposite, while the trends are nearly identical. This relationship is captured by the observation that the two strain components evolve in a coupled manner throughout the process.
Finite Element Modeling of Gear Cutting
Gear cutting of the face gear is based on the meshing of crossed helical gears. The tool axis and the face gear axis are crossed in space, and the shaft angle equals the helix angle of the tool. During gear cutting the tool and the workpiece rotate about their own axes at a prescribed ratio, while the tool feeds along the face gear axis. The offset distance between the two axes is
$$A = R_a \sin\beta_0$$
where $R_a$ is the outer radius of the face gear and $\beta_0$ is the helix angle of the tool. The tool enters at the outer end and exits at the inner end, and repeated axial passes along the tooth line bring the tooth to its design depth. Because the tool and the workpiece maintain a fixed speed ratio, the cutting edges sweep continuously across the tooth surface and generate the face gear tooth profile by enveloping.
Tool Parameters and Model Assembly
The face gear used for the gear cutting study has 86 teeth, a module of 4, and a normal pressure angle of 25°. The tool was designed accordingly. The tool parameters are listed below.
| Parameter | Value |
|---|---|
| Number of teeth | 25 |
| Module | 4 |
| Normal pressure angle (deg) | 25 |
| Helix angle (deg) | 10 |
| Rake angle (deg) | 0 |
| Base circle diameter (mm) | 91.77 |
I imported the tool and the previously rolled face gear into the finite element environment, assembled them with the correct spatial relationship, and simplified the model by retaining only a sector of the face gear in order to reduce the computational cost. The workpiece was again treated as an elastic-plastic body, and the tool and fixture as rigid bodies. Local mesh refinement was applied only to the teeth that participate in gear cutting. The friction coefficient between the tool and the workpiece was set to 0.3, and that between the workpiece and the fixture to 0.7. The heat transfer coefficient, ambient temperature, and convection coefficient were set to the same values used in the roll forming simulation.
Chip separation during gear cutting requires a separation criterion. I adopted the default criterion, which combines geometric and physical conditions and is the most widely used option for continuous generating processes.
Cutting Force
The cutting force in gear cutting arises from two sources: the resistance of the workpiece material to elastic and plastic deformation, and the friction between the chip and the rake face together with the friction between the flank face and the machined surface. The force components in the X, Y, and Z directions all display a periodic pattern. When the tool first enters the workpiece the force is small. As the cutting proceeds the uncut chip thickness grows, the removed volume increases, and the force rises. When the entry edge is fully engaged and the exit edge begins to cut, the chip thickness reaches a maximum and the force peaks. As the exit edge completes its cut the chip thickness falls, the force decreases, and when the edge loses contact with the workpiece the force drops to a minimum. One tooth space of the face gear is thereby completed.
Stress State
The equivalent stress is concentrated in the contact zone between the tool and the workpiece. In the primary deformation zone the material of the cutting layer reaches its yield strength, slips, and continues to slip until it becomes essentially parallel to the rake face. Because the chip thickness varies along the cutting edge, the equivalent stress differs among the entry edge, the exit edge, and the top edge. The stress decays outward from the contact zone.
The minimum principal stress appears at the contact between the cutting edge and the material and reaches approximately −2800 MPa in compression. Several contact zones contribute simultaneously, so the stress field is complex, but the general trend is a monotonic decrease from the surface to the substrate. The three principal stress components follow the same pattern, all emanating from the cutting contact and decaying outward.
Cutting Temperature
The heat generated during gear cutting comes from the plastic work of the cutting layer and from the friction between the chip and the rake face, the flank face, and the workpiece. The maximum temperature occurs in the contact region between the tool and the workpiece, where plastic deformation and friction both contribute. As the chip forms, the relative sliding speed between the chip and the tool becomes the largest, and the chip carries away the majority of the heat. The temperature distribution confirms that the chip is the hottest part of the system.
Tooth Surface Deformation and Its Prediction
Extraction of the Deformation Value
To characterize the deformation after gear cutting I extracted the coordinates of nine points along a tooth line passing through the mid-height of the tooth, and I compared them with the theoretical coordinates. The deviation between the two is the local deformation. The largest deviation among the nine points is taken as the deformation value of that tooth surface. In the case examined here the maximum deviation was 21.1 µm.
Orthogonal Experiment
To reduce the number of simulations while still capturing the influence of the process parameters, I designed an orthogonal experiment with three factors and three levels. The factors were the tool speed, the cutting depth, and the feed rate. The levels are given below.
| Level | Tool speed (r/min) | Cutting depth (mm) | Feed rate (mm/min) |
|---|---|---|---|
| 1 | 240 | 0.05 | 3 |
| 2 | 270 | 0.10 | 6 |
| 3 | 300 | 0.20 | 9 |
The nine simulations of the orthogonal array produced the deformation values listed below.
| Run | Tool speed (r/min) | Cutting depth (mm) | Feed rate (mm/min) | Deformation (µm) |
|---|---|---|---|---|
| 1 | 240 | 0.05 | 3 | 16.3 |
| 2 | 240 | 0.10 | 9 | 18.8 |
| 3 | 240 | 0.20 | 6 | 21.1 |
| 4 | 270 | 0.05 | 9 | 19.1 |
| 5 | 270 | 0.10 | 6 | 15.8 |
| 6 | 270 | 0.20 | 3 | 20.5 |
| 7 | 300 | 0.05 | 6 | 15.2 |
| 8 | 300 | 0.10 | 3 | 16.9 |
| 9 | 300 | 0.20 | 9 | 21.9 |
Range analysis of the orthogonal array gives the following results.
| Range | Tool speed (r/min) | Cutting depth (mm) | Feed rate (mm/min) |
|---|---|---|---|
| K1 (µm) | 18.73 | 16.87 | 17.90 |
| K2 (µm) | 18.47 | 17.12 | 17.37 |
| K3 (µm) | 18.00 | 21.17 | 19.93 |
| R (µm) | 0.73 | 4.30 | 2.57 |
The range R measures the sensitivity of the deformation to each factor. The larger the range, the stronger the influence. The ranking obtained here is cutting depth > feed rate > tool speed. Cutting depth is therefore the dominant factor, feed rate is the second most important, and tool speed has the smallest effect.
Response Surface Prediction Model
I fitted the simulation data by multiple regression using the least squares method. The resulting prediction model for the maximum deformation is
$$\delta = -141.7 – 1.163\,V_c + 15.1\,a_p + 0.002167\,f^2 + \frac{100}{V_c} – 0.017\,a_p V_c + 81.1\,a_p f – 0.065\,V_c f$$
where $V_c$ is the tool speed in r/min, $a_p$ is the cutting depth in mm, and $f$ is the feed rate in mm/min. The p-value of the model is 0.016, which is below the 0.05 significance threshold, and the adjusted coefficient of determination is 98.17 %, indicating that the model is reliable.
The response surfaces reveal the following behavior. As the feed rate increases, the deformation of the tooth surface increases. As the cutting depth increases, the deformation increases. As the tool speed increases, the deformation decreases. Among the combinations examined, the smallest deformation is obtained with a tool speed of 300 r/min, a cutting depth of 0.05 mm, and a feed rate of 3 mm/min.
| Parameter | Direction of change | Effect on deformation | Ranking |
|---|---|---|---|
| Cutting depth | Increase | Increase | 1 |
| Feed rate | Increase | Increase | 2 |
| Tool speed | Increase | Decrease | 3 |
Influence of Residual Stress
Residual stress after gear cutting originates from three sources: mechanical stress, thermal stress, and phase transformation. Mechanical residual stress arises because the elastic deformation of the subsurface layer tends to recover after the cutting force is removed, while the surface layer constrains that recovery. Thermal residual stress arises because the surface and the subsurface cool at different rates after the cutting heat is generated. Phase transformation residual stress arises when the surface temperature exceeds the transformation temperature, so that the microstructure changes and a volume mismatch is created. In this study I consider the coupled mechanical and thermal contributions and neglect the phase transformation contribution.
I extracted the residual stress along the depth of the machined tooth surface at intervals of 0.2 mm over ten layers, for the six stress components. I then applied these values as prestress to a single-tooth model and performed a static equilibrium analysis so that the internal stress field could redistribute and reach a new equilibrium. The resulting deformation is a free distortion of the tooth.
The maximum deformation occurs at the edge of the tooth and reaches approximately 15.8 µm. Because no external constraint was imposed, the edge deforms more than the center, which confirms the reasonableness of the simulation approach. Comparing the different process parameter combinations, I found that larger residual stress components produce larger redistribution deformation. To control the deformation caused by residual stress it is therefore necessary to reduce the residual stress itself. Lowering the cutting depth reduces the cutting heat and the mechanical stress, and multiple passes are preferable to a single deep pass. Reducing the feed rate also lowers the residual stress. Increasing the tool speed slightly reduces the residual stress, although its effect is weaker than that of the other two parameters. Within a reasonable parameter window, the recommended strategy is to minimize the cutting depth, moderately reduce the feed rate, and increase the tool speed.
Virtual Machining and Experimental Verification
Construction of the Virtual Machining Platform
I built a three-dimensional model of the gear cutting machine and imported it into a dedicated numerical control simulation environment. The machine consists of a base that carries two orthogonal slideways, a transverse slide and a longitudinal slide, with a vertical slide mounted on the transverse slide and a rotary table mounted on the longitudinal slide. The transverse motion provides the tool feed, the longitudinal motion positions the workpiece along its radial direction, the vertical motion performs the tool setting, and the rotary table sets the cutting angle. The tool spindle and the workpiece spindle rotate the tool and the workpiece about their own axes.
The control system was configured, the machining zero point was established, and the tool and workpiece were positioned by adjusting the offsets. The numerical control program was then loaded and debugged. The gear cutting process was simulated, and the material removal was verified to be free of overcut and undercut.
The simulation reveals the sequence of edge engagement. The entry edge cuts first and removes material from the tip of the left flank near the root of the tool tooth. As the tool and workpiece rotate, the entry edge completes its cut and the top edge takes over, removing material near the root of the face gear tooth. Finally the exit edge engages, starting near the root of the right flank and progressing toward the tip. Throughout the process the tool and the workpiece execute a spatial generating motion, which is the essence of gear cutting.
Experimental Setup
Based on the existing machine platform, I carried out the gear cutting experiment. The tool and the face gear were clamped and positioned, the slide positions were adjusted to align the tool with the tooth surface, and the numerical control program together with the tool speed, workpiece speed, feed rate, and cutting depth was entered into the control panel. The chips produced during gear cutting have a shape that closely matches the tooth space of the face gear, and the chip thickness is not uniform: the chips removed by the entry and exit edges are thinner than those removed by the top edge, which produces the thickest chip.
Measurement of Tooth Surface Deformation
The tooth surface deformation after gear cutting was measured on a precision gear measuring machine. The machine selects nine points along the face width and five points along the tooth height, giving 45 measuring points per flank. Each point is compared with its theoretical position, and the deviation is the local deformation. On the left flank, 16 points fell above the theoretical surface with a maximum deviation of 10.3 µm, and 29 points fell on or below the theoretical surface with a maximum deviation of 17.7 µm, so the maximum deformation of the left flank is 17.7 µm. On the right flank, 20 points fell above the theoretical surface with a maximum deviation of 8.7 µm, and 25 points fell on or below the theoretical surface with a maximum deviation of 14 µm, so the maximum deformation of the right flank is 14 µm.
Across several measured teeth, the deformation at the outer and inner ends of the face width is larger than at the mid-width. Two explanations are plausible. First, the tool engages and disengages at the edges, so the force history there is more abrupt and more likely to induce a larger local deformation; at mid-width the force history is more regular. Second, residual stress is released after machining, and the edges are less constrained than the interior, so they deform more during release. The deformation near the root is slightly larger than at mid-height because the chip thickness at the root is the largest, so both the cutting force and the cutting heat reach their maximum there. The deformation near the tip is also comparatively large because the tip is thin and therefore sensitive to thermal effects and to stress redistribution. Overall, the tooth surface accuracy reaches grades 8 to 9, which confirms that gear cutting can serve as a semi-finishing operation for face gears.
Validation of the Prediction Model
To validate the prediction model I performed additional gear cutting experiments with different parameter combinations and compared the measured deformation with the predicted deformation. The results are summarized below.
| Run | Tool speed (r/min) | Cutting depth (mm) | Feed rate (mm/min) | Simulated (µm) | Measured (µm) | Error |
|---|---|---|---|---|---|---|
| 1 | 240 | 0.05 | 3 | 16.3 | 16.2 | −0.61 % |
| 2 | 240 | 0.10 | 9 | 18.8 | 19.4 | +3.19 % |
| 3 | 240 | 0.20 | 6 | 21.1 | 22.6 | +7.11 % |
| 4 | 270 | 0.05 | 9 | 19.1 | 21.2 | +10.99 % |
| 5 | 270 | 0.10 | 6 | 15.8 | 14.5 | −8.23 % |
| 6 | 270 | 0.20 | 3 | 20.5 | 23.5 | +14.63 % |
| 7 | 300 | 0.05 | 6 | 15.2 | 13.8 | −9.21 % |
| 8 | 300 | 0.10 | 3 | 16.9 | 15.2 | −10.06 % |
| 9 | 300 | 0.20 | 9 | 21.9 | 22.6 | +3.20 % |
The error between the simulated and the measured values lies within the range of −10 % to +15 %, which is acceptable for this class of process. The validation confirms the accuracy of the finite element simulation and the reliability of the response surface prediction model. The trends identified earlier are confirmed: increasing the tool speed reduces the deformation, while increasing the cutting depth and the feed rate increases it. The physical reason is that a larger cutting depth and a larger feed rate require the tool to remove more material, which generates a larger cutting force and more cutting heat, and the combined effect produces a larger deformation. Consequently, the parameter combination of 300 r/min tool speed, 0.05 mm cutting depth, and 3 mm/min feed rate is recommended for minimizing the deformation during gear cutting.
Conclusions
I investigated the deformation of an aerospace face gear during hot pre-cutting, covering roll forming and the subsequent gear cutting operation. The main findings are summarized below.
First, the hot roll forming of the face gear was simulated with a bulk forming finite element code. The metal flow on the driving and driven flanks differs because the tangential forces act in opposite directions, which stretches the tip of the driven flank and produces the rabbit ear defect. The rolling force decreases as the roll speed increases and increases as the feed rate increases.
Second, the equivalent strain on the driving and driven flanks follows the same root-to-tip trend. The strain increases with roll speed and decreases with feed rate. The X-direction and Z-direction strains have nearly opposite signs and similar trends, reflecting the coupling between radial compression and tangential flow.
Third, the gear cutting process was simulated on the rolled face gear. The cutting force, stress, and temperature were analyzed, and the cutting force was found to be periodic with the engagement of the entry, top, and exit edges. An orthogonal experiment identified the ranking of the process parameters as cutting depth > feed rate > tool speed. A response surface model was fitted, and the resulting prediction model was shown to be statistically significant.
Fourth, residual stress was extracted and reapplied as prestress, and the resulting free distortion was quantified. Larger residual stress components produce larger deformation, so the process should be tuned to minimize residual stress by reducing the cutting depth, moderating the feed rate, and raising the tool speed.
Fifth, a virtual machining platform was constructed for gear cutting, and a physical gear cutting experiment was performed on the machine platform. The measured tooth surface deformation agrees with the simulated value within −10 % to +15 %, which validates both the finite element model and the response surface prediction model. The parameter combination of 300 r/min tool speed, 0.05 mm cutting depth, and 3 mm/min feed rate is recommended for minimizing deformation.
Outlook
Several directions remain open. The metal flow during hot roll forming was studied only through finite element simulation; to improve the integrity of the flow lines and the fatigue strength of the gear, the internal microstructure and the flow line characteristics should be examined with electron microscopy, and the roll forming parameters should be optimized accordingly. The present work measured only the tooth surface deformation after gear cutting; surface work hardening and fatigue strength were not addressed, and a systematic study of how the process parameters affect these quantities would further improve the quality of the face gear. Finally, only the response surface method was used to build the deformation prediction model. Other intelligent approaches, such as back-propagation neural networks, hybrid genetic-neural networks, and particle swarm optimization, could be applied, and a comparison among several prediction models would help identify the optimal combination of process parameters. Taken together, these extensions would strengthen the near-net-shape manufacturing route for aerospace face gears and support the broader adoption of gear cutting in precision gear production.