
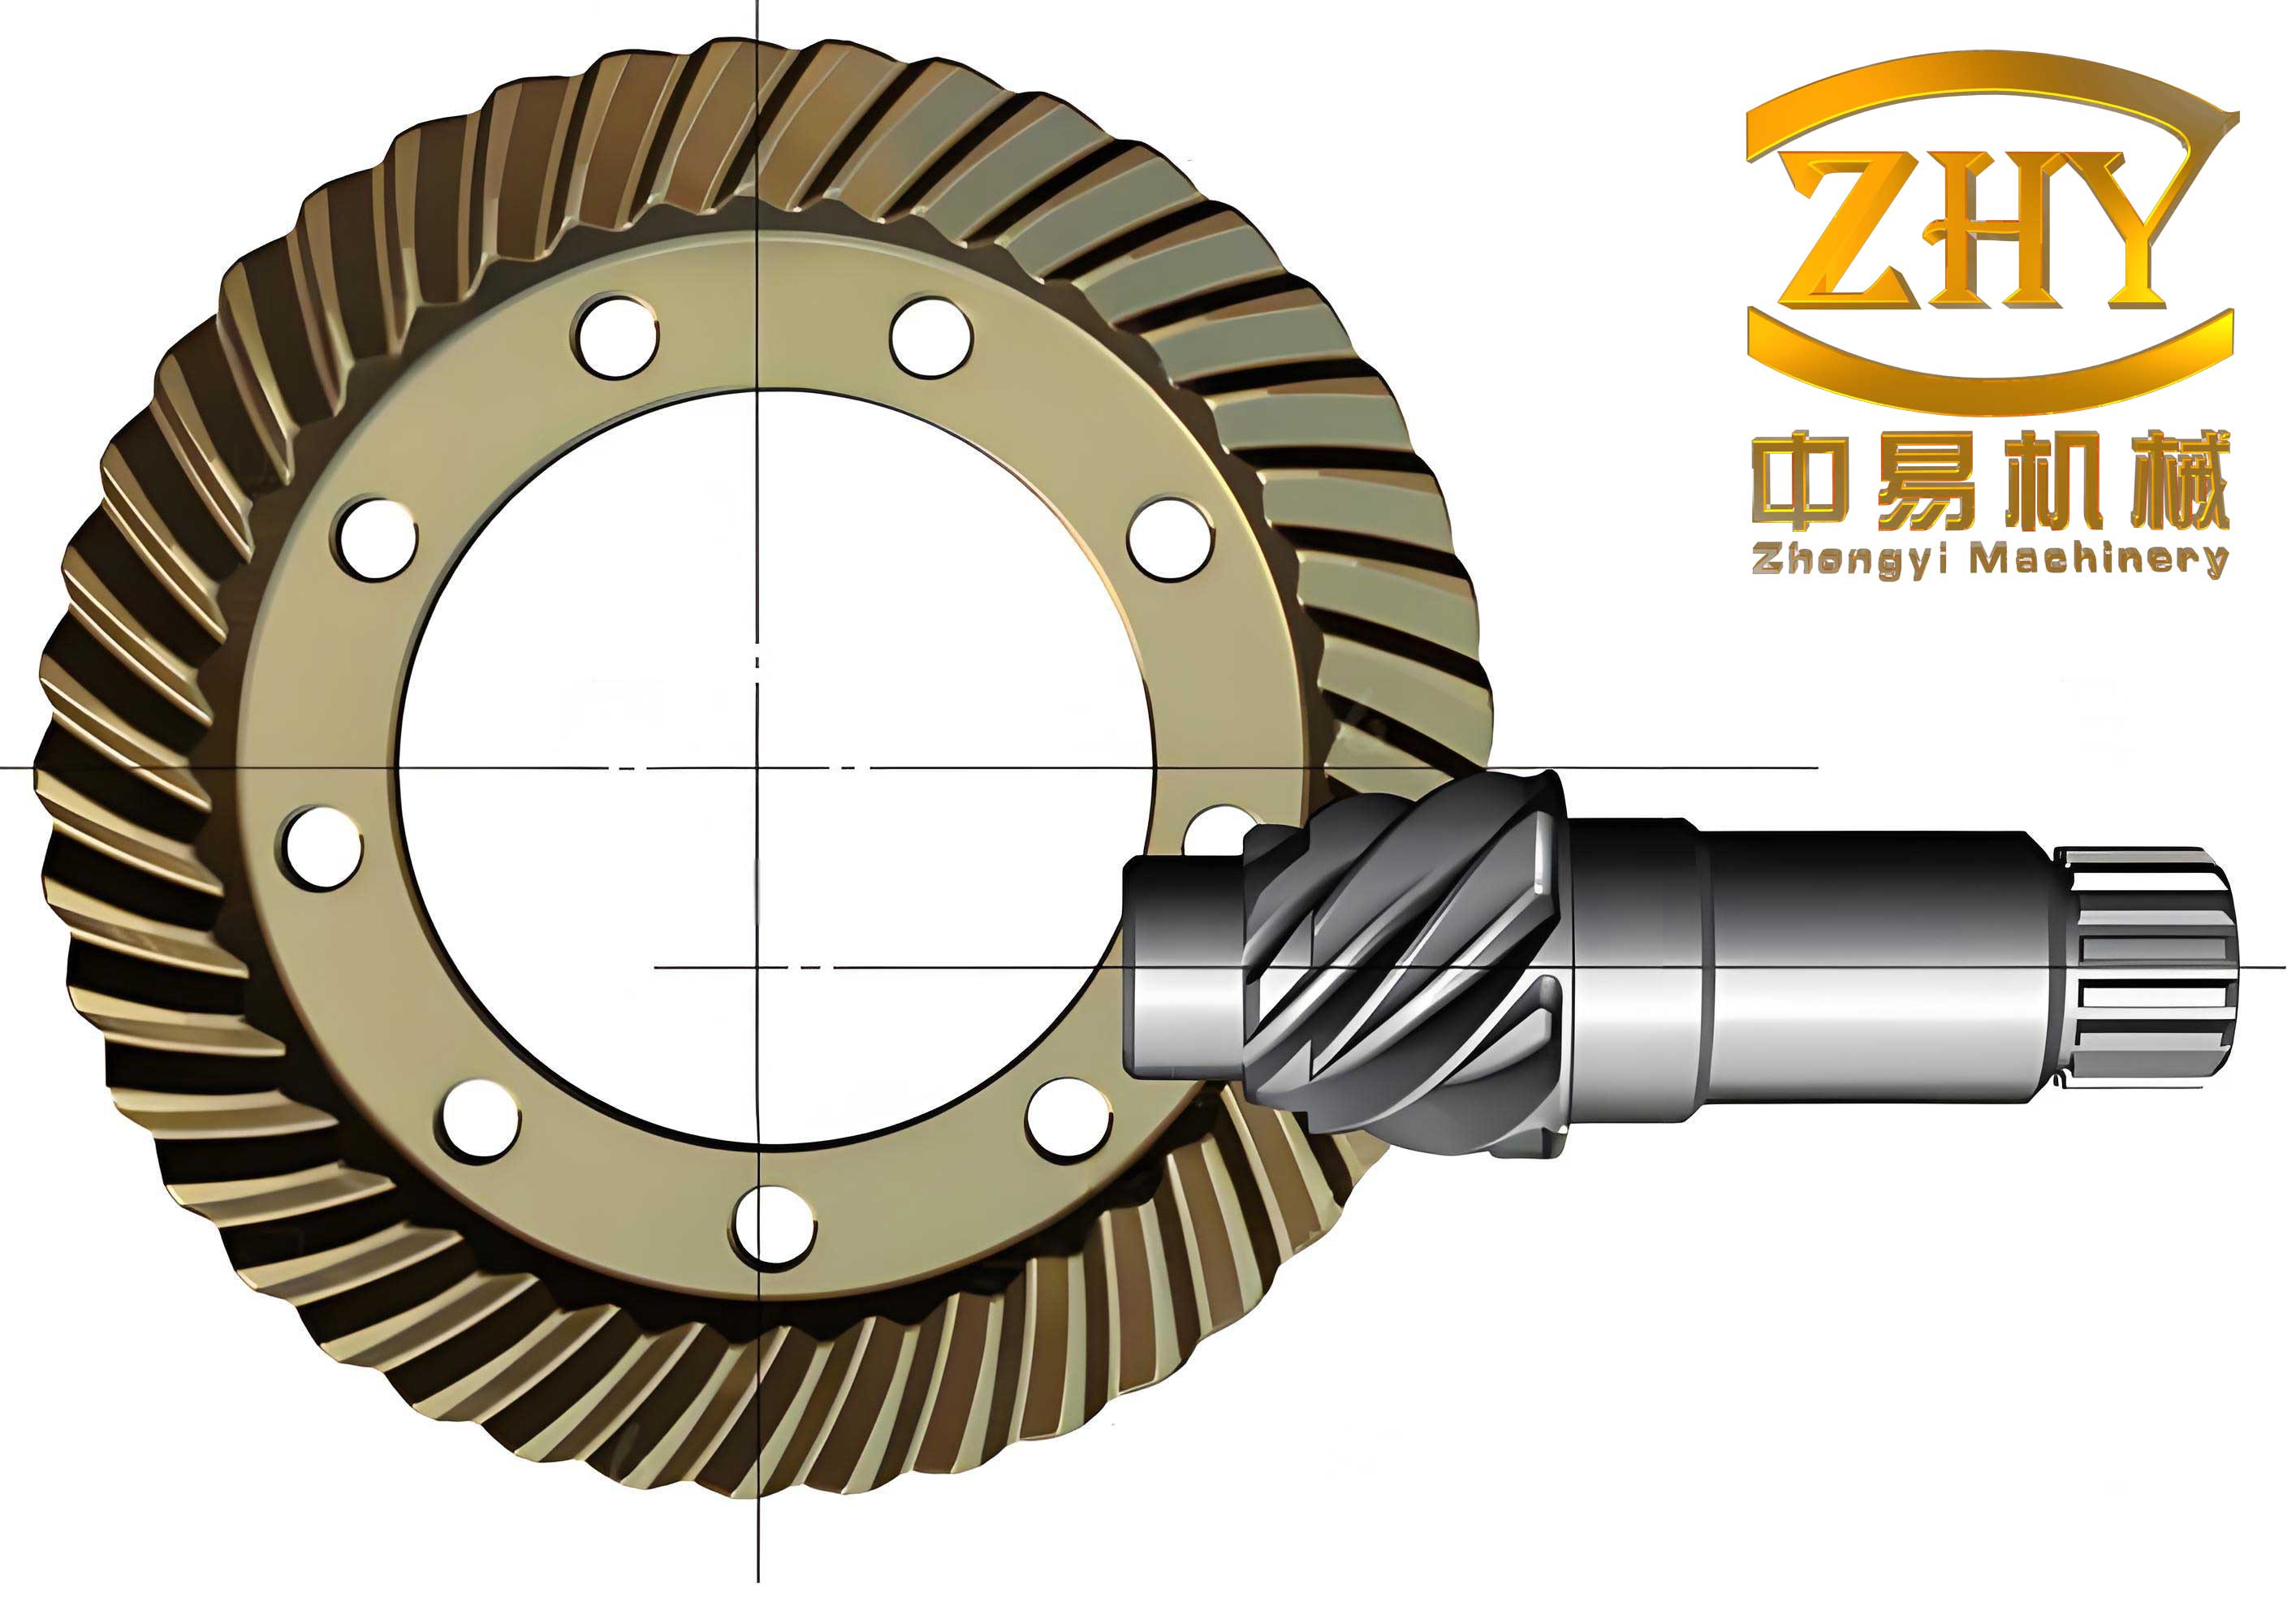
The work presented in this dissertation focuses on the assembly quality control and measurement technology for hypoid gears used in a power take-off unit of a four-wheel-drive vehicle. The research is driven by the necessity to ensure precise meshing conditions of hypoid gears, which are widely applied due to their excellent transmission performance. Because of the complex tooth surfaces and local conjugation, the assembly precision requirements for hypoid gear pairs are stringent. My study covers three main aspects: pre-assembly geometric deviation detection, in-assembly contact zone position control, and post-assembly transmission quality verification.
During the actual production process of the power take-off, I categorized the primary causes of defective products and summarized five major deviations affecting the meshing accuracy of the gear pair: tooth profile deviation, tooth surface damage, foreign matter between meshing surfaces, eccentricity of the ring gear shaft, and shaft angle misalignment. Based on the principle of double-flank rolling test used for cylindrical gears, I designed a meshing detection method for hypoid gear pairs. To verify the accuracy of this method, I conducted kinematic simulations and established a gear meshing test bench for experimental validation.
In the assembly stage, due to the local conjugation of hypoid gears, the position of the contact zone between the pinion and ring gear must be strictly controlled. Given the manufacturing process, the pinion is relatively small and easier to control in geometry compared with the ring gear. Therefore, in the gear meshing detection process, I fixed the distance from the pinion face to the ring gear axis. By analyzing the pinion radial runout during meshing, I calculated the shim compensation value in the axial direction of the ring gear shaft. The shim compensation value for the pinion axial direction was derived from the housing and pinion dimensions. Since both the contact zone position control and geometric deviation detection adopt the double-flank meshing method, the calculation of compensation values was performed on the same test bench.
After assembly, the power take-off is in a sealed state, making direct measurement of the contact zone position impossible. Therefore, I designed a circumferential backlash measurement method based on the principle that the tooth clearance causes a difference in rotation angles between the two gears. By comparing the measured circumferential backlash with the theoretical backlash of the hypoid gear pair, I can judge the accuracy of pre-assembly deviation detection and in-assembly contact zone compensation. Additionally, the variation pattern of backlash during the meshing cycle provides insights into the influencing factors and the transmission quality of the gear pair.
Since hypoid gears constitute a nonlinear transmission system with high detection precision and limited rigidity of the test bench, different experimental parameters significantly affect the detection results. I analyzed the experimental parameters for both test benches and conducted respective experimental studies to optimize them.
1. Theoretical Foundations of Meshing Detection and Circumferential Backlash Measurement
Hypoid gear pairs are based on the local conjugation principle. The complete conjugation would theoretically provide advantages such as smooth rotation and high torque, but it also eliminates the adjustability of the gear pair. In practice, gear tooth surfaces are modified to achieve local conjugation, which allows small assembly position errors without significant contact zone migration. The most critical factors affecting meshing quality are the position, orientation, size, and shape of the contact zone.
The meshing equations for conjugate surfaces can be expressed as follows:
$$ \begin{cases} \mathbf{r}_2 = \mathbf{m} + \mathbf{r}_1 \\ \mathbf{n}_2 = \mathbf{n}_1 \\ \mathbf{n} \cdot \mathbf{v}_{12} = 0 \end{cases} $$
where $\mathbf{r}_1$ and $\mathbf{r}_2$ are the position vectors of the contact point on the two surfaces, $\mathbf{n}_1$ and $\mathbf{n}_2$ are the unit normal vectors, $\mathbf{m}$ is the vector connecting the origins of the two coordinate systems, and $\mathbf{v}_{12}$ is the relative sliding velocity at the contact point.
For the gear pair under investigation, the parameters are summarized in the following table:
| Parameter | Pinion | Ring Gear |
|---|---|---|
| Number of teeth | 17 | 27 |
| Transverse module (mm) | 5.270 | 5.270 |
| Mean spiral angle | 47°06′ | 38°59′ |
| Hand of spiral | Right | Left |
| Cutter diameter (mm) | 127 | 127 |
| Theoretical whole depth (mm) | 9.533 | 9.504 |
| Theoretical outside diameter (mm) | 111.435 | 146.25 |
| Pinion offset (mm) | 10 | 10 |
| Shaft angle (°) | 90 | 90 |
1.1 Dynamic Error Curve Theory
The dynamic tooth error curve concept was originally proposed for cylindrical gears using single-flank meshing with a special measuring worm. The curve contains the overall deviation information of the gear. However, for hypoid gears, the single-flank method requires special equipment. I adapted the double-flank meshing principle to hypoid gear pairs, where the center distance variation in cylindrical gears is replaced by the radial runout of the pinion in the hypoid gear pair.
In the double-flank measurement, the gear pair meshes without backlash, and any deviation on the tooth surfaces causes a variation in the center distance. For hypoid gears, the radial runout of the pinion reflects the combined effect of tooth profile deviations, spacing errors, runout, and other factors. This runout curve serves as the basis for evaluating the gear pair quality.
The time-domain signal can be transformed into the frequency domain using the Fast Fourier Transform (FFT). The rotation frequencies and meshing frequencies are defined as:
$$ f_c = \frac{n}{60} $$
$$ f_z = \frac{n Z}{60} $$
where $n$ is the rotational speed in revolutions per minute, and $Z$ is the number of teeth. The meshing frequency and its harmonics are essential for diagnosing gear faults. When gear faults occur, sidebands appear around the meshing frequency and its harmonics in the spectrum.
1.2 Circumferential Backlash Measurement Principle
The circumferential backlash is defined as the actual clearance at every meshing position in a complete cycle. The complete cycle means that after $n_1 \times n_2$ meshing events, where $n_1$ and $n_2$ are the numbers of teeth of the two gears, the same pair of teeth comes into contact again. The proper backlash range is essential for gear transmission quality.
The minimum backlash is determined by several compensation factors:
$$ J_{n\min} = J_{n1} + J_{n2} + J_{n3} + J_{n4} $$
where $J_{n1}$ is the thermal expansion compensation, $J_{n2}$ is the oil film compensation, $J_{n3}$ is the assembly error compensation, and $J_{n4}$ is the noise reduction compensation. The maximum backlash can be taken as:
$$ J_{n\max} = 2.5 \times J_{n\min} $$
The measurement principle is based on the angular difference between the driving and driven gears caused by the backlash. Two angle encoders record the rotation angles of the two gears during forward and reverse rotation. By plotting the angle of one gear against the other, the backlash can be derived from the difference between the forward and reverse curves.
The backlash for each meshing position can be calculated as:
$$ J_n = (\alpha_1 – \alpha_2) \times \frac{\pi r}{180^\circ} $$
where $\alpha_1$ and $\alpha_2$ are the pinion angles in the forward and reverse directions, and $r$ is the pinion radius.
2. Kinematic Simulation of Geometric Deviations in Hypoid Gear Pairs
To understand how different geometric deviations manifest in the pinion radial runout curve, I developed three-dimensional models of the hypoid gear pair based on the tooth surface equations derived from the spherical involute theory.
The spherical involute is generated by a circular plane rolling purely on a base cone. The trajectory of a point on the rolling plane forms the tooth profile. The tooth surface equation can be expressed as:
$$ \begin{cases} x = R_b(\sin\varphi \sin\psi + \cos\varphi \cos\psi \cos\theta) \\ y = R_b(-\cos\varphi \sin\psi + \sin\varphi \cos\psi \sin\theta) \\ z = R_b \cos\psi \cos\theta \end{cases} $$
where $R_b$ is the base cone distance, $\varphi$ is the roll angle, $\psi$ is the angle between the initial generatrix and the axis, and $\theta$ is the base cone angle.
The transformation between the pinion coordinate system and the ring gear coordinate system is given by:
$$ M_{12} = \begin{bmatrix} \cos\Delta & 0 & \sin\Delta \\ 0 & 1 & 0 \\ -\sin\Delta & 0 & \cos\Delta \end{bmatrix} $$
where $\Delta$ is the shaft angle. Since the shaft angle is 90° for the investigated pair, this matrix simplifies accordingly.
Based on the analysis of defective products from the production line, I identified five major geometric deviations:
1. Tooth profile deviation: caused by machine and tool errors, reflected as high-frequency, low-amplitude fluctuations in the radial runout curve.
2. Tooth surface damage: usually at the tooth edge due to transportation impacts, causing significant distortions in the runout curve.
3. Foreign matter on the meshing surface: small particles or debris entering the mesh, causing moderate spikes in the runout curve.
4. Ring gear shaft eccentricity: caused by improper assembly of the ring gear and shaft, producing a sinusoidal component at the ring gear shaft rotational frequency.
5. Ring gear shaft axis angle: the angular misalignment between the ring gear axis and the shaft axis, affecting both the runout amplitude and the meshing frequency.
I modeled these deviations in SolidWorks and imported the models into Adams for kinematic simulation. The pinion was allowed to move along one direction (x-direction) with a spring force to simulate the double-flank meshing condition, while the ring gear shaft was driven at a constant speed.
The simulation results showed distinctive patterns for each deviation:
| Deviation Type | Time-Domain Signature | Frequency-Domain Signature |
|---|---|---|
| Tooth profile deviation | High-frequency periodic oscillation | Peaks at meshing frequency and harmonics |
| Tooth surface damage | Large localized spike | Sidebands around meshing frequency |
| Foreign matter | Small localized protrusion | Peak at meshing frequency |
| Shaft eccentricity | Sinusoidal variation | Peak at ring gear rotational frequency |
| Shaft axis angle | Periodic variation with amplitude modulation | Peaks at both rotational and meshing frequencies |
3. Experimental Verification of the Double-Flank Meshing Detection for Hypoid Gears
3.1 Test Bench Design
According to the meshing conditions of hypoid gears, the test bench must satisfy the following requirements.
- The pinion should have only one translational degree of freedom (x-direction for radial runout measurement) and one rotational degree of freedom (z-axis rotation).
- The ring gear should have only one rotational degree of freedom (z-axis rotation).
- The distance from the pinion face to the ring gear axis should be fixed at 74.25 mm during meshing, with variation not exceeding 3 μm.
- A proper pressing force should be applied to the pinion to maintain no-backlash meshing.
- The shaft angle between the pinion and ring gear axes must be 90°.
- The offset between the pinion and ring gear axes must be 10 mm.
The mechanical structure of the double-flank meshing detection test bench consists of the following main parts:
| Component | Function |
|---|---|
| Pinion clamping mechanism | Clamps the pinion using an expansion sleeve, ensuring high concentricity and reliable torque transmission |
| Ring gear positioning mechanism | Positions the ring gear shaft with a pneumatic cylinder and supports rotation with tapered roller bearings |
| Contact position control mechanism | Uses a servo motor to position the pinion clamping mechanism and monitors the position with a displacement sensor |
| Pressing force mechanism | Applies a constant downward force to the pinion via counterweight and pulleys |
For the data acquisition system, I selected grating displacement sensors with a resolution of 0.1 μm and a reaction time of less than 3 ms. The sensors produce pulse signals that are counted by a high-speed counter. I chose a data acquisition system with a maximum sampling frequency of 25 kHz to capture the fine details of the meshing process. The system uses asynchronous callback to read data, ensuring data integrity and real-time performance.
3.2 Optimization of Test Parameters
Through experimental studies, I optimized four key test parameters that significantly influence the measurement results.
Pressing force: I tested counterweights of 3 kg, 4 kg, 5 kg, 6 kg, and 8 kg. When the force was too light (3 kg), the radial runout curve exhibited random drift in direction, indicating that the pinion could not return to the proper meshing position. When the force was too heavy (8 kg), gear locking occurred during repeated measurements. The optimal pressing force was found to be 5 kg.
Rotational speed: I tested speeds from 30 r/min to 180 r/min. The results showed that the runout parameters stabilized after 60 r/min, but higher speeds reduced the ability to capture fine tooth profile details. Considering both measurement quality and production cycle time, I selected 120 r/min as the optimal speed.
| Speed (r/min) | Min (μm) | Max (μm) | Average (μm) | Fluctuation (μm) |
|---|---|---|---|---|
| 30 | 114 | 143 | 129 | 29 |
| 60 | 88 | 124 | 106 | 36 |
| 90 | 76 | 111 | 94 | 35 |
| 120 | 85 | 119 | 102 | 34 |
| 150 | 84 | 119 | 103 | 35 |
| 180 | 80 | 116 | 101 | 36 |
Lubrication condition: I compared dry friction, oil lubrication, and grease lubrication. Dry friction resulted in poor repeatability. Both oil and grease lubrication gave similar results, but oil lubrication was preferred for efficiency. Therefore, oil lubrication was selected for the test bench.
Non-full-cycle sampling: In an actual production environment, the measurement cycle is limited. I analyzed whether the measurement results from a non-full-cycle rotation can represent the complete meshing information. The results showed that for foreign matter, local damage, shaft eccentricity, and axis angle deviations, non-full-cycle sampling does not affect the accuracy because each tooth participates in meshing multiple times within a few rotations. Only extreme cases of tooth profile deviation could potentially be missed.
3.3 Verification of Geometric Deviation Detection
Using the optimized test parameters (pressing force 5 kg, speed 120 r/min, oil lubrication), I conducted experiments on gear pairs with artificially introduced deviations. The main frequencies at 120 r/min are listed below:
| Frequency Component | Value (Hz) |
|---|---|
| Pinion rotational frequency | 2 |
| Ring gear shaft rotational frequency | 1.259 |
| Meshing frequency | 34 |
Foreign matter: The presence of foreign matter produced a small protrusion in the time-domain runout curve. In the frequency domain, it caused a peak at the meshing frequency with minimal effect on the harmonics. The location and severity of the foreign matter can be identified from the time-domain signal.
Tooth surface damage: Local damage caused a large spike in the runout curve, affecting not only the current tooth but also several subsequent teeth. In the frequency spectrum, it created sidebands around the meshing frequency due to the impact nature of the fault and the energy broadening caused by the FFT of the impulsive signal.
Ring gear shaft eccentricity: I introduced eccentricities of 5 μm, 15 μm, 30 μm, and 45 μm. The radial runout exhibited a sinusoidal variation at the ring gear shaft rotational frequency. The amplitude at this frequency increased proportionally with the eccentricity, providing a quantitative measure of the deviation.
Ring gear shaft axis angle: I introduced axis angles of 0.00164°, 0.00491°, 0.00982°, and 0.0147°. The runout curve showed periodic variations with a more complex pattern compared with eccentricity. In the frequency domain, both the rotational frequency and the meshing frequency experienced amplitude increases, indicating that the axis angle affects both the radial and axial meshing conditions.
3.4 Contact Zone Position Compensation
For gear pairs that pass the geometric deviation inspection, the next step is to calculate the shim compensation values for the axial directions. The calculation is based on the average displacement sensor readings during calibration and during measurement, as well as the housing and gear dimensions.
The compensation value for the ring gear shaft is calculated as:
$$ L_r = \overline{S_{cr}} – \overline{S_{mr}} + L_{sr} – D_{cr} – L_{br} $$
where $\overline{S_{cr}}$ is the average sensor reading during calibration, $\overline{S_{mr}}$ is the average sensor reading during measurement, $L_{sr}$ is the housing depth, $D_{cr}$ is the bearing thickness, and $L_{br}$ is the housing depth for the ring gear bearing.
The compensation value for the pinion is:
$$ L_p = L_{sp} – L_{cp} – D_{cp} $$
where $L_{sp}$ is the housing depth, $L_{cp}$ is the distance from the calibrating pinion face to the ring gear axis, and $D_{cp}$ is the pinion bearing thickness.
The actual distances between the gears are expressed as:
$$ E = \overline{S_{cr}} – \overline{S_{mr}} + L_{cr} $$
$$ N = \overline{S_{cp}} – \overline{S_{mp}} + L_{cp} $$
where $E$ represents the distance from the ring gear face to the pinion axis, $N$ represents the distance from the pinion face to the ring gear axis, and $L_{cr}$ is the distance from the calibrating ring gear face to the pinion axis.
4. Circumferential Backlash Measurement for Transmission Quality Verification
4.1 Measurement Method
After assembly, the power take-off is sealed, and direct contact zone measurement is impossible. I developed a circumferential backlash measurement method to indirectly verify the contact zone position. The method relies on the relationship between the angular difference of the two gears during rotation and the backlash.
To visualize the small angular differences, I introduced a relative measurement approach. Instead of comparing the absolute angles, I calculated the difference between the actual pinion angle and its theoretical value based on the ring gear angle:
$$ J_{ti} = \left(\alpha_i – \beta_i \times S_t\right) \times \frac{\pi R}{180^\circ} $$
where $J_{ti}$ is the half-backlash at position $i$, $\alpha_i$ is the pinion angle, $\beta_i$ is the ring gear angle, $S_t$ is the transmission ratio, and $R$ is the pinion pitch radius.
The full circumferential backlash is obtained by subtracting the half-backlash in the reverse direction from that in the forward direction:
$$ J_{ni} = J_{tfi} – J_{tbi} $$
Test bench design: The test bench needs to meet several specific requirements to ensure accurate measurement:
- The rotation transmitted from the gear shaft to the angle encoder must be free of relative sliding and cumulative errors.
- The data from the two encoders must be sampled simultaneously in time.
For the clamping mechanism, I used a hydraulic expansion sleeve that grips the gear shaft through friction. The maximum torque that can be transmitted by the expansion sleeve is:
$$ T_{\max} = f F_{N2} r $$
where $f$ is the friction coefficient, $F_{N2}$ is the normal force on the gear shaft, and $r$ is the shaft radius. If the system drag torque exceeds this maximum, relative sliding occurs between the sleeve and the shaft, breaking the temporal correspondence between the encoder signals.
For synchronization, I used a start trigger signal. The data acquisition card is configured such that both encoder counting tasks start only when the trigger signal is activated. This ensures the two angle sequences share the same sampling clock and time base.
4.2 Effect of Rotational Speed
The rotational speed affects the system inertia and the starting torque. I tested speeds from 20 r/min to 100 r/min. At 100 r/min, significant relative sliding occurred between the expansion sleeve and the gear shaft, breaking the data consistency. Based on these tests, I selected 60 r/min as the standard test speed.
| Speed (r/min) | Starting Torque (N·m) |
|---|---|
| 20 | 11.12 |
| 40 | 10.39 |
| 60 | 10.76 |
| 80 | 10.64 |
| 100 | 14.81 |
At higher speeds, the starting torque increases significantly due to the inertia of the rotating parts. The speed-related effects also influence the meshing impact. Therefore, I collected angle data only after the gear pair reached a steady rotational state, avoiding the influence of the starting transient.
4.3 Analysis of the Circumferential Backlash Results
The circumferential backlash measurement provides a comprehensive view of the gear pair meshing quality. The backlash curve in a complete cycle reveals the variation of clearance at every meshing position.
Normal backlash range: The acceptable backlash range for this hypoid gear pair is shown in the following table:
| Parameter | Minimum (mm) | Maximum (mm) |
|---|---|---|
| Backlash single value | 0.16-0.24 | 0.24-0.32 |
| Backlash average | 0.20-0.28 | 0.20-0.28 |
| Backlash fluctuation | 0-0.08 | 0-0.08 |
Influencing factors: The frequency spectrum of the backlash curve shows several distinct components. The rotational frequencies of the two gears dominate the low-frequency range, indicating the influence of shaft eccentricity on the backlash variation. The meshing frequency component reflects the contribution of tooth profile deviations. Between these frequencies, there is a prominent peak corresponding to the natural vibration frequency of the gear pair, which is related to the gear meshing stiffness and the overall system dynamics.
The meshing vibration causes a time-varying displacement at the contact point, which directly modulates the backlash signal. This self-excited vibration component increases with rotational speed, suggesting that higher speeds amplify the dynamic effects within the meshing process.
Verification of compensation accuracy: By measuring the circumferential backlash of multiple power take-off units after applying the compensation calculated from the meshing detection test bench, I verified that the gear pair backlash falls within the acceptable range. This confirms that the contact zone position compensation value is correct. The repeatability of the backlash measurement was also evaluated, and the test bench demonstrated consistent results across multiple measurements.
5. Conclusions and Future Work
This dissertation presents a comprehensive study on the assembly quality control and measurement technology for hypoid gears. The main contributions and conclusions are as follows:
1. I established a theoretical foundation for extracting geometric deviation information from the pinion radial runout curve of hypoid gears based on the local conjugation principle and the double-flank meshing detection principle adapted for hypoid gear pairs.
2. Through kinematic simulation and experimental verification, I confirmed that the five major geometric deviations—tooth profile deviation, tooth surface damage, foreign matter, ring gear shaft eccentricity, and ring gear shaft axis angle—can be identified from the time- and frequency-domain characteristics of the pinion radial runout curve.
3. I designed and optimized a double-flank meshing detection test bench specifically for hypoid gears. The optimal test parameters were determined through systematic experiments, ensuring high measurement repeatability and accuracy.
4. I developed a shim compensation calculation method for controlling the contact zone position of hypoid gear pairs during assembly, which significantly reduced the defect rate in the power take-off production line.
5. I designed a circumferential backlash measurement test bench for sealed power take-off units. The measurement method successfully verifies the accuracy of the contact zone compensation and provides insights into the factors affecting the meshing quality of hypoid gears.
Future work can extend this research in the following directions:
- Investigate the combined effects of multiple geometric deviations on hypoid gear meshing quality.
- Develop closed-loop feedback from the measurement data to the gear manufacturing process for continuous improvement.
- Apply the double-flank meshing detection principle to other types of bevel and hypoid gears.
- Extend the circumferential backlash measurement method to other single-stage gear pairs for general transmission quality assessment.