
In my years of experience working with gear systems, particularly straight bevel gears, I have consistently observed that improper tooth contact during assembly remains a significant challenge, even when the gear components and housing are manufactured within specified tolerances. This issue often stems from errors in the locating distance—the axial position of the gears relative to their theoretical mounting points. When the actual locating distances deviate from the design values, the pitch cone apexes of the pinion and gear fail to coincide, leading to misalignment and suboptimal meshing. This article aims to provide a comprehensive analysis of how locating distance errors affect the tooth contact of straight bevel gears, and I will present a practical method to quantify and correct these errors through a combination of geometric analysis, backlash measurement, and systematic adjustment. The focus will be on straight bevel gears, a common type of bevel gear used in intersecting shaft transmissions, and the discussion will be enriched with formulas, tables, and practical insights to ensure clarity and applicability.
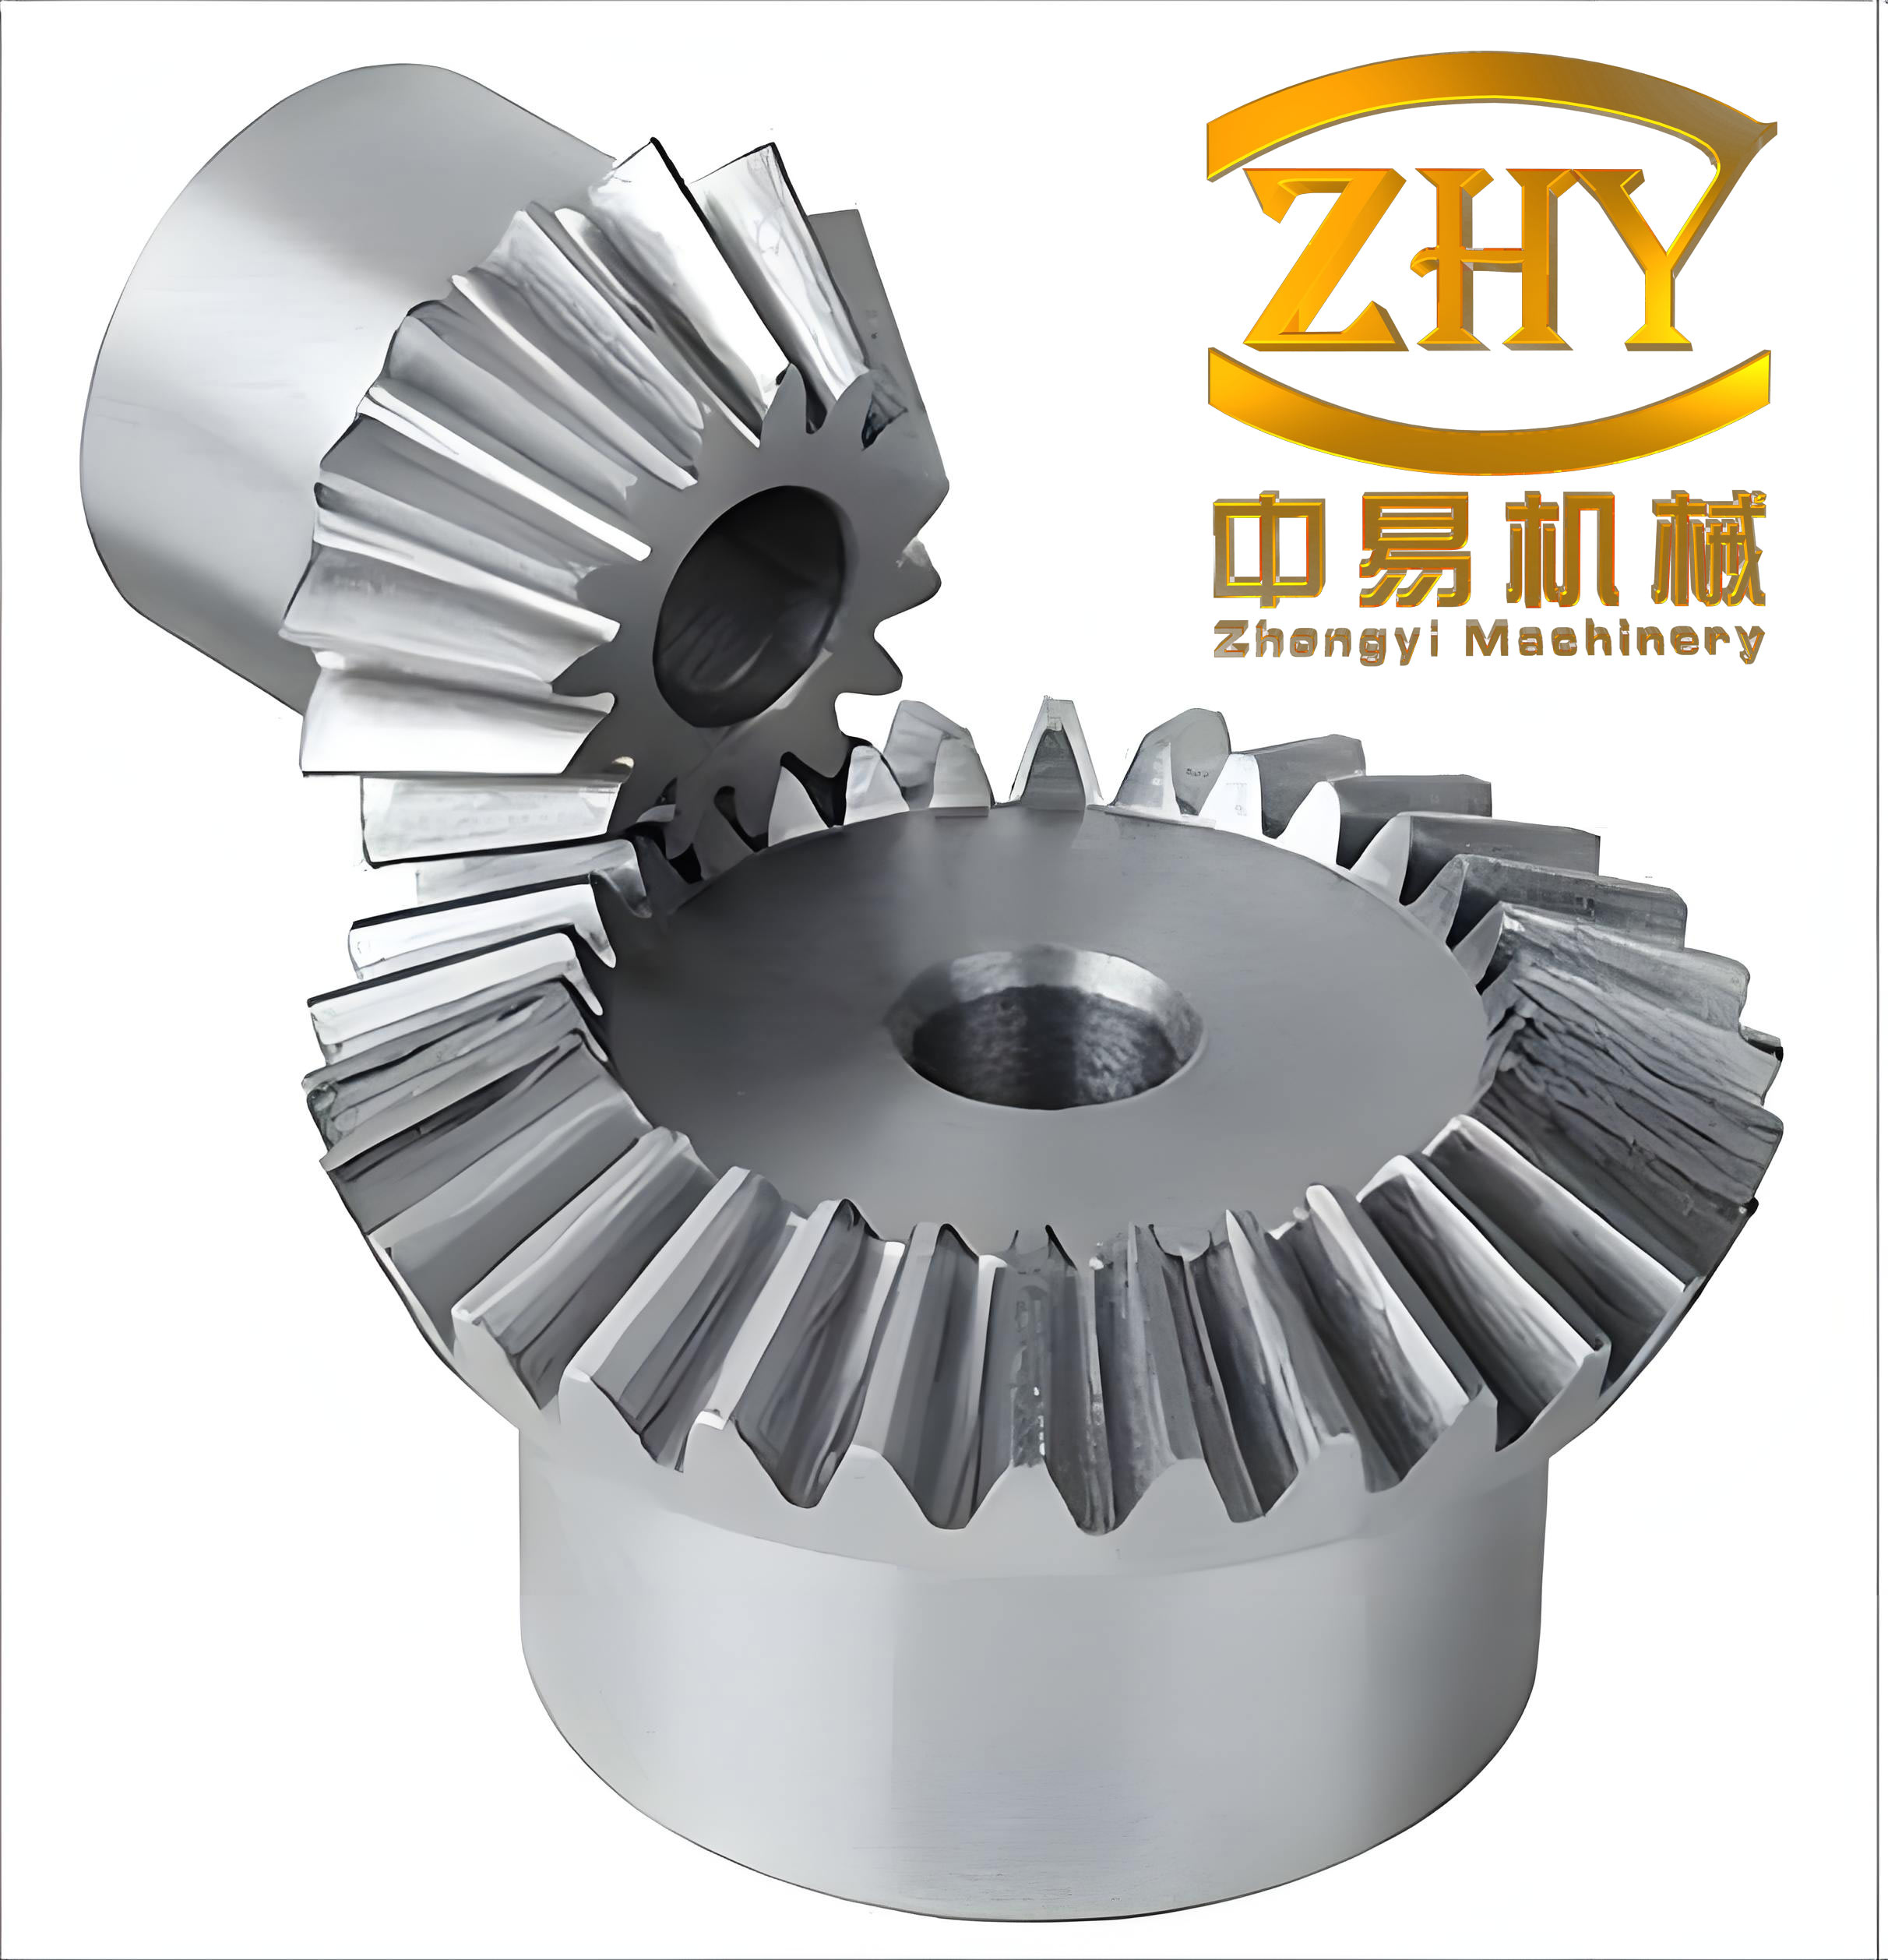
Straight bevel gears are characterized by straight teeth that taper towards the apex of the conical pitch surface. Their design and assembly require precision to ensure efficient power transmission, minimal noise, and long service life. The locating distance, often referred to as the mounting distance, is a critical parameter that defines the axial position of each gear relative to a reference point, such as the housing shoulder or bearing seat. In an ideal assembly, the pitch cone apexes of both the pinion and the gear should intersect at the same point along the shaft axes. However, in practice, cumulative tolerances in gear manufacturing, housing bore positions, and bearing settings can cause the actual locating distances to differ from the nominal values. This discrepancy results in a shift of the pinion’s pitch cone apex relative to the gear’s, which in turn alters the tooth contact pattern and backlash. Understanding this relationship is essential for effective troubleshooting and adjustment in the assembly of straight bevel gears.
To systematically analyze the impact of locating distance errors, let us establish a coordinate system. Consider a Cartesian coordinate system where the origin O is placed at the pitch cone apex of the gear (the larger straight bevel gear). The y-axis is aligned with the gear’s axis of rotation, and the x-axis is aligned with the pinion’s axis. When the actual locating distances A₂’ (for the gear) and A₁’ (for the pinion) are not equal to the theoretical distances A₂ and A₁, the pinion’s pitch cone apex P will not coincide with O. Instead, P will have coordinates (x, y) in this coordinate system. The magnitude and direction of this displacement directly influence the tooth contact. A key parameter is the slope angle φ, defined as the angle between the line OP and the positive x-axis, calculated as:
$$ \phi = \tan^{-1}\left(\frac{y}{x}\right) $$
Depending on the quadrant in which P lies, the slope angle φ can take values from 0 to 2π. However, for straight bevel gears, the relevant range is often segmented based on the pinion’s pitch cone angle δ. I have found it useful to divide the possible locations of P into 16 distinct address codes, encompassing eight primary boundary addresses and eight intermediate ones. Each address corresponds to a specific tooth contact pattern on the pinion’s flanks (drive flank and coast flank). This correspondence is summarized in Table 1, which provides a qualitative guide for diagnosing locating distance errors based on observed contact patterns.
| Address Code | Coordinates (x, y) | Slope Angle φ | Description of Tooth Contact Pattern on Pinion Flanks |
|---|---|---|---|
| A | x > 0, y = 0 | φ = 0 | Contact on both the drive and coast flanks is biased towards the toe (small end) of the tooth. The pattern may appear as a concentrated spot near the toe. |
| B | x > 0, y > 0 | φ = δ | On the drive flank, contact is predominantly near the heel (large end); on the coast flank, contact is near the toe. This results in an asymmetric pattern across flanks. |
| C | x = 0, y > 0 | φ = π/2 | Contact on both flanks is relatively centered but may be elongated along the tooth height. This often indicates a pure vertical misalignment. |
| D | x < 0, y > 0 | φ = π/2 + δ | On the drive flank, contact shifts towards the toe; on the coast flank, contact shifts towards the heel. This is somewhat opposite to pattern B. |
| E | x < 0, y = 0 | φ = π | Contact on both flanks is biased towards the heel. This is the mirror of pattern A with respect to the origin. |
| F | x < 0, y < 0 | φ = π + δ | Similar to pattern B but reversed: on the drive flank, contact near heel; on coast flank, contact near toe, but due to negative y, the overall effect differs in backlash change. |
| G | x = 0, y < 0 | φ = 3π/2 | Centered contact patterns but may indicate a vertical offset in the opposite direction to C. Often associated with specific backlash changes. |
| H | x > 0, y < 0 | φ = 3π/2 + δ | Resembles pattern D but reversed: drive flank contact near toe, coast flank contact near heel, with negative y coordinate. |
The addresses between these primary ones (e.g., between A and B) represent transitional zones where the contact pattern gradually morphs from one shape to another. In practice, when assembling straight bevel gears, applying a marking compound to the tooth flanks and rotating the gears under light load reveals these patterns. By comparing the observed pattern with Table 1, an experienced technician can estimate the address code and thus the approximate slope angle φ. This qualitative assessment is the first step in diagnosing locating distance errors. However, to achieve precise adjustment, a quantitative approach is necessary, which involves measuring the backlash and using geometric relationships to calculate the exact coordinates of P.
Backlash, defined as the clearance between mating teeth when the gears are stationary, is another critical parameter affected by locating distance errors. For straight bevel gears, the theoretical backlash J is determined during the design phase, accounting for necessary tooth thickness reductions to accommodate thermal expansion, lubrication, and manufacturing tolerances. It is typically specified at the large end of the gear teeth. The actual backlash j measured after assembly may differ from J due to misalignment. The change in backlash, denoted as Δj = j – J, provides a quantifiable link to the coordinates (x, y) of the pinion’s pitch cone apex P. Through geometric derivation, I have established the following relationship:
$$ \Delta j = \left( \frac{x \cos \delta}{R} \cdot \frac{\pi m}{2} + 2x \sin \delta \tan \alpha \right) – \left( \frac{y \cos(\frac{\pi}{2} – \delta)}{R} \cdot \frac{\pi m}{2} + 2y \sin(\frac{\pi}{2} – \delta) \tan \alpha \right) $$
Here, δ is the pitch cone angle of the pinion, α is the pressure angle (usually 20° for standard straight bevel gears), m is the module at the large end, and R is the pitch cone radius (length of the pitch cone generatrix). For a pinion with number of teeth z₁, R is given by:
$$ R = \frac{m z_1}{2 \sin \delta} $$
Note that for a straight bevel gear pair, δ is often calculated from the tooth numbers: δ = arctan(z₁/z₂) for a 90° shaft angle, where z₂ is the gear tooth count. Substituting R into the backlash equation and using the relation y = x tan φ (from the definition of φ), we can simplify the expression to solve for x and y explicitly. After algebraic manipulation, the formulas become:
$$ x = \frac{\Delta j}{\left[ \frac{\pi}{z_1} (\sin \delta \cos \delta – \sin^2 \delta \tan \phi) + 2 \tan \alpha (\sin \delta – \cos \delta \tan \phi) \right]} $$
$$ y = x \tan \phi $$
These equations are powerful tools for assembly adjustment. Once Δj is measured and φ is estimated from the contact pattern, we can compute the exact axial misalignments x and y. However, a special case arises when the backlash remains unchanged despite misalignment. This occurs when the pinion’s pitch cone apex P lies along a specific line defined by a critical slope angle φ₀. Setting Δj = 0 in the equation and solving for φ yields:
$$ \phi_0 = \tan^{-1} \left( \frac{\frac{\pi}{z_1} \cos \delta + 2 \tan \alpha}{\frac{\pi}{z_1} \sin \delta + 2 \tan \alpha \tan \delta} \right) $$
When φ = φ₀, the backlash change is zero, meaning that the measured backlash j equals the theoretical J. In such cases, the contact pattern alone must guide the adjustment, and an iterative approach may be needed. To aid in understanding, Table 2 summarizes the general behavior of backlash change relative to φ and the quadrant of P.
| Condition on φ and Quadrant | Effect on Backlash Δj = j – J | Typical Address Code Region |
|---|---|---|
| φ < φ₀ in quadrants I or III | Backlash increases (Δj > 0) | Regions near A, B, E, F |
| φ > φ₀ in quadrants I or III | Backlash decreases (Δj < 0) | Regions near C, D, G, H |
| φ < φ₀ in quadrants II or IV | Backlash decreases (Δj < 0) | Depends on specific coordinates |
| φ > φ₀ in quadrants II or IV | Backlash increases (Δj > 0) | Depends on specific coordinates |
| φ = φ₀ (any quadrant) | Backlash unchanged (Δj = 0) | Along critical line in all quadrants |
It is crucial to verify consistency: the observed backlash change should align with the expected trend based on the estimated φ from the contact pattern. If inconsistency arises, possible causes include measurement errors, non-uniform backlash around the gear, or additional manufacturing defects in the straight bevel gears themselves. Assuming consistency, the calculated x and y provide direct adjustment values. The adjustment rules are straightforward:
- For the pinion: a positive x indicates that the pinion should be moved axially towards the gear’s axis (i.e., reducing the pinion’s locating distance), while a negative x means moving away from the gear’s axis (increasing the locating distance).
- For the gear: a positive y indicates that the gear should be moved axially away from the pinion’s axis (increasing the gear’s locating distance), while a negative y means moving towards the pinion’s axis (reducing the locating distance).
These adjustments are typically achieved using shims, adjustable mounts, or threaded sleeves in the housing. After adjustment, the gear mesh should be rechecked for contact pattern and backlash to confirm improvement. In many cases, especially with large straight bevel gears used in heavy machinery, this method enables accurate correction in a single attempt, saving time and reducing the risk of damage from repeated trial-and-error.
To illustrate the practical application, let me walk through a detailed numerical example. Consider a straight bevel gear pair designed for a right-angle drive with the following parameters:
- Pinion tooth count: z₁ = 18
- Gear tooth count: z₂ = 36
- Module at large end: m = 4 mm
- Pressure angle: α = 20°
- Shaft angle: Σ = 90°
- Theoretical backlash specified: J = 0.12 mm
First, compute the pitch cone angle δ for the pinion. For a 90° shaft angle, δ = arctan(z₁/z₂) = arctan(18/36) = arctan(0.5) ≈ 26.565°. Next, determine the pitch cone radius R:
$$ R = \frac{m z_1}{2 \sin \delta} = \frac{4 \times 18}{2 \times \sin(26.565^\circ)} = \frac{72}{2 \times 0.4472} \approx 80.5 \text{ mm} $$
During assembly, suppose the measured backlash at several positions averages j = 0.18 mm, so Δj = 0.06 mm. The contact pattern, after applying marking compound, shows that on both flanks of the pinion, the contact is biased towards the toe. Referring to Table 1, this corresponds to address A, implying φ ≈ 0. Now, plug the values into the formula for x. Note that when φ = 0, tan φ = 0, so the denominator simplifies significantly. Calculate the trigonometric values: sin δ ≈ 0.4472, cos δ ≈ 0.8944, tan α ≈ 0.3640.
$$ x = \frac{0.06}{\left[ \frac{\pi}{18} (\sin \delta \cos \delta – \sin^2 \delta \times 0) + 2 \tan \alpha (\sin \delta – \cos \delta \times 0) \right]} = \frac{0.06}{\left[ \frac{\pi}{18} (0.4472 \times 0.8944) + 2 \times 0.3640 \times 0.4472 \right]} $$
Compute stepwise: sin δ cos δ = 0.4472 × 0.8944 ≈ 0.4. Then, π/18 ≈ 0.1745. So the first term: 0.1745 × 0.4 ≈ 0.0698. The second term: 2 × 0.3640 × 0.4472 ≈ 0.3256. Denominator sum: 0.0698 + 0.3256 = 0.3954. Thus:
$$ x = \frac{0.06}{0.3954} \approx 0.1517 \text{ mm} $$
Since φ = 0, y = x tan φ = 0. Therefore, the adjustment required is: move the pinion 0.1517 mm towards the gear axis (positive x direction), and no movement for the gear. After making this adjustment using appropriate shims, re-measure the backlash and observe the contact pattern. Ideally, the backlash should now be close to 0.12 mm, and the contact pattern should be centered on the tooth flanks, indicating proper alignment of the pitch cone apexes.
For a more complex scenario, suppose the contact pattern indicates address D, with φ ≈ π/2 + δ = 90° + 26.565° = 116.565° (or in radians, φ ≈ 2.0344 rad). Assume the same gear parameters, but now Δj = -0.04 mm (backlash decreased). Then, tan φ = tan(116.565°) ≈ -2.0 (since tangent is negative in the second quadrant). Compute the denominator components:
sin δ cos δ = 0.4, sin² δ = (0.4472)² ≈ 0.2. So, sin δ cos δ – sin² δ tan φ = 0.4 – 0.2 × (-2.0) = 0.4 + 0.4 = 0.8. The term sin δ – cos δ tan φ = 0.4472 – 0.8944 × (-2.0) = 0.4472 + 1.7888 = 2.236. Then the denominator becomes: (π/18) × 0.8 + 2 × 0.3640 × 2.236 = 0.1745 × 0.8 + 0.728 × 2.236 ≈ 0.1396 + 1.627 ≈ 1.7666. Thus:
$$ x = \frac{-0.04}{1.7666} \approx -0.02264 \text{ mm} $$
$$ y = x \tan \phi = (-0.02264) \times (-2.0) = 0.04528 \text{ mm} $$
Interpretation: x is negative, so the pinion should move away from the gear axis by 0.02264 mm; y is positive, so the gear should move away from the pinion axis by 0.04528 mm. Such small adjustments highlight the sensitivity of straight bevel gear meshing to minute axial displacements.
Beyond the core calculations, several practical considerations are vital when working with straight bevel gears. First, measurement accuracy is paramount. Backlash should be measured at multiple positions around the gear circumference to account for possible eccentricity or tooth-to-tooth variations. Dial indicators or specialized backlash meters are recommended. Second, the contact pattern check should be performed under light load, simulating actual operating conditions as closely as possible. Third, environmental factors such as temperature can affect dimensions; thus, measurements should be taken at stable ambient conditions. Fourth, for large straight bevel gears, the weight of the components may induce deflections, so proper support during assembly is necessary to avoid false readings. Finally, it is essential to distinguish between contact patterns caused by locating distance errors and those due to other factors like gear tooth profile errors, housing bore misalignment, or bearing preload. As a rule of thumb, if the contact patterns on the drive and coast flanks are similar (both biased in the same direction), locating distance error is likely. If patterns differ significantly between flanks, other geometric issues may be present, requiring further investigation or component rework.
The method described here is particularly valuable for large straight bevel gear pairs used in industries such as mining, construction, and heavy machinery, where gearboxes are substantial and disassembly is time-consuming. By enabling precise adjustment in one or two iterations, downtime is minimized, and operational reliability is enhanced. Moreover, this approach complements modern quality control techniques; for instance, coordinate measuring machines (CMM) can be used to verify the actual locating distances on housing and gears before assembly, providing proactive data to predict and compensate for errors.
In terms of design implications, engineers designing straight bevel gear systems should consider specifying tighter tolerances on locating dimensions or incorporating adjustable elements (e.g., tapered sleeves, eccentric bushes) to facilitate fine-tuning during assembly. Additionally, providing clear assembly instructions that include backlash measurement procedures and contact pattern interpretation can improve consistency in the field. From a theoretical perspective, the formulas presented can be extended or adapted for other bevel gear types, such as spiral bevel gears, though additional factors like spiral angle and bias would need to be incorporated.
To further elucidate the geometric principles, let’s delve into the derivation of the backlash change equation. Starting from the basic geometry of a straight bevel gear, the tooth thickness at the large end is modified by the axial displacement of the gear relative to its pitch cone apex. For a small axial shift Δx of the pinion along its axis, the effective tooth thickness at the pitch circle changes due to the cone angle. Specifically, a movement Δx towards the gear axis effectively reduces the pinion’s back-cone distance, leading to a change in the apparent tooth thickness. Similarly, a shift Δy of the gear along its axis affects the gear’s tooth thickness. The net change in circumferential backlash at the pitch circle can be expressed as the sum of contributions from both gears. Using the approximation that the tooth profile is linear near the pitch point (valid for standard involute profiles), the change in tooth thickness per unit axial movement is proportional to the tangent of the pressure angle and the sine of the pitch cone angle. After integrating these effects and converting to linear backlash at the large end, we arrive at the earlier equation. A more rigorous derivation would involve the geometry of the back-cone and the Tredgold’s approximation, which treats bevel gears as equivalent spur gears on the back-cone. However, for practical assembly purposes, the given formulas suffice.
For quick reference, Table 3 lists typical values of the critical angle φ₀ for various straight bevel gear configurations with α = 20°. This can help assemblers estimate whether backlash is expected to increase or decrease based on the observed contact pattern slope.
| Pinion Teeth z₁ | Gear Teeth z₂ | Pitch Cone Angle δ (degrees) | φ₀ (degrees) | φ₀ (radians) |
|---|---|---|---|---|
| 10 | 30 | 18.435 | ~64.2 | ~1.120 |
| 15 | 45 | 18.435 | ~65.8 | ~1.148 |
| 20 | 40 | 26.565 | ~58.1 | ~1.014 |
| 25 | 50 | 26.565 | ~59.3 | ~1.035 |
| 30 | 30 | 45.000 | ~50.5 | ~0.881 |
Note that φ₀ generally decreases as δ increases, reflecting the changing influence of the cone geometry on backlash sensitivity. When the observed slope angle φ is less than φ₀, backlash tends to increase for positive x in the first quadrant; however, the quadrant-specific rules from Table 2 should be followed for accurate diagnosis.
In conclusion, the accurate assembly of straight bevel gears hinges on controlling the locating distance to ensure coincidence of the pitch cone apexes. Errors in this parameter manifest as characteristic tooth contact patterns and measurable backlash changes. By systematically analyzing the contact pattern and backlash, and applying the formulas presented here, assemblers can calculate the required axial adjustments for both the pinion and gear, achieving optimal meshing in a efficient manner. This method not only reduces assembly time and cost but also enhances the performance and longevity of straight bevel gear drives. As straight bevel gears continue to be integral components in various mechanical systems, mastering such adjustment techniques remains essential for engineers and technicians committed to reliability and precision in power transmission.