
The pursuit of high-precision power transmission in heavy-duty industrial applications has consistently driven the demand for advanced gear manufacturing technologies. Among various gear types, the herringbone gear stands out due to its unique double-helical design, which inherently cancels out axial thrust forces and enables smooth, high-torque transmission. This characteristic makes it indispensable in critical machinery such as ship propulsion systems, large compressors, and high-power turbine drives. The traditional manufacturing of herringbone gears, often involving specialized machines and complex setups, has been a costly and technically challenging endeavor. However, the advent and maturation of Computer Numerical Control (CNC) technology have revolutionized this field. The feasibility of using versatile multi-axis CNC machining centers equipped with standard cutting tools, such as end mills, to generate herringbone gear teeth has been successfully demonstrated. This flexibility offers significant advantages in terms of cost reduction and production agility.
Despite these advancements, achieving and consistently maintaining the high geometrical accuracy required for optimal herringbone gear performance remains a significant challenge. The machining process is susceptible to a multitude of error sources that can degrade final gear quality. These errors can be broadly categorized into machine tool geometric errors (inaccuracies in the guideways, spindles, and rotary axes), tool-related errors (wear, deflection, and setting inaccuracies), and workpiece-related errors. Among the workpiece-related errors, the clamping pose error—comprising inaccuracies in the position and orientation of the gear blank relative to the machine tool’s intended coordinate system—is a critical yet often overlooked factor. During the milling process on a multi-axis machine, the herringbone gear blank is typically mounted on a rotary table (C-axis). Any deviation from its ideal location and alignment, such as eccentric mounting or tilting, directly propagates into the machined tooth flanks. This can lead to deviations in tooth profile, lead (helix), and pitch, ultimately resulting in undesirable consequences like non-uniform load distribution, increased noise and vibration, and reduced transmission efficiency and service life in the final assembly.
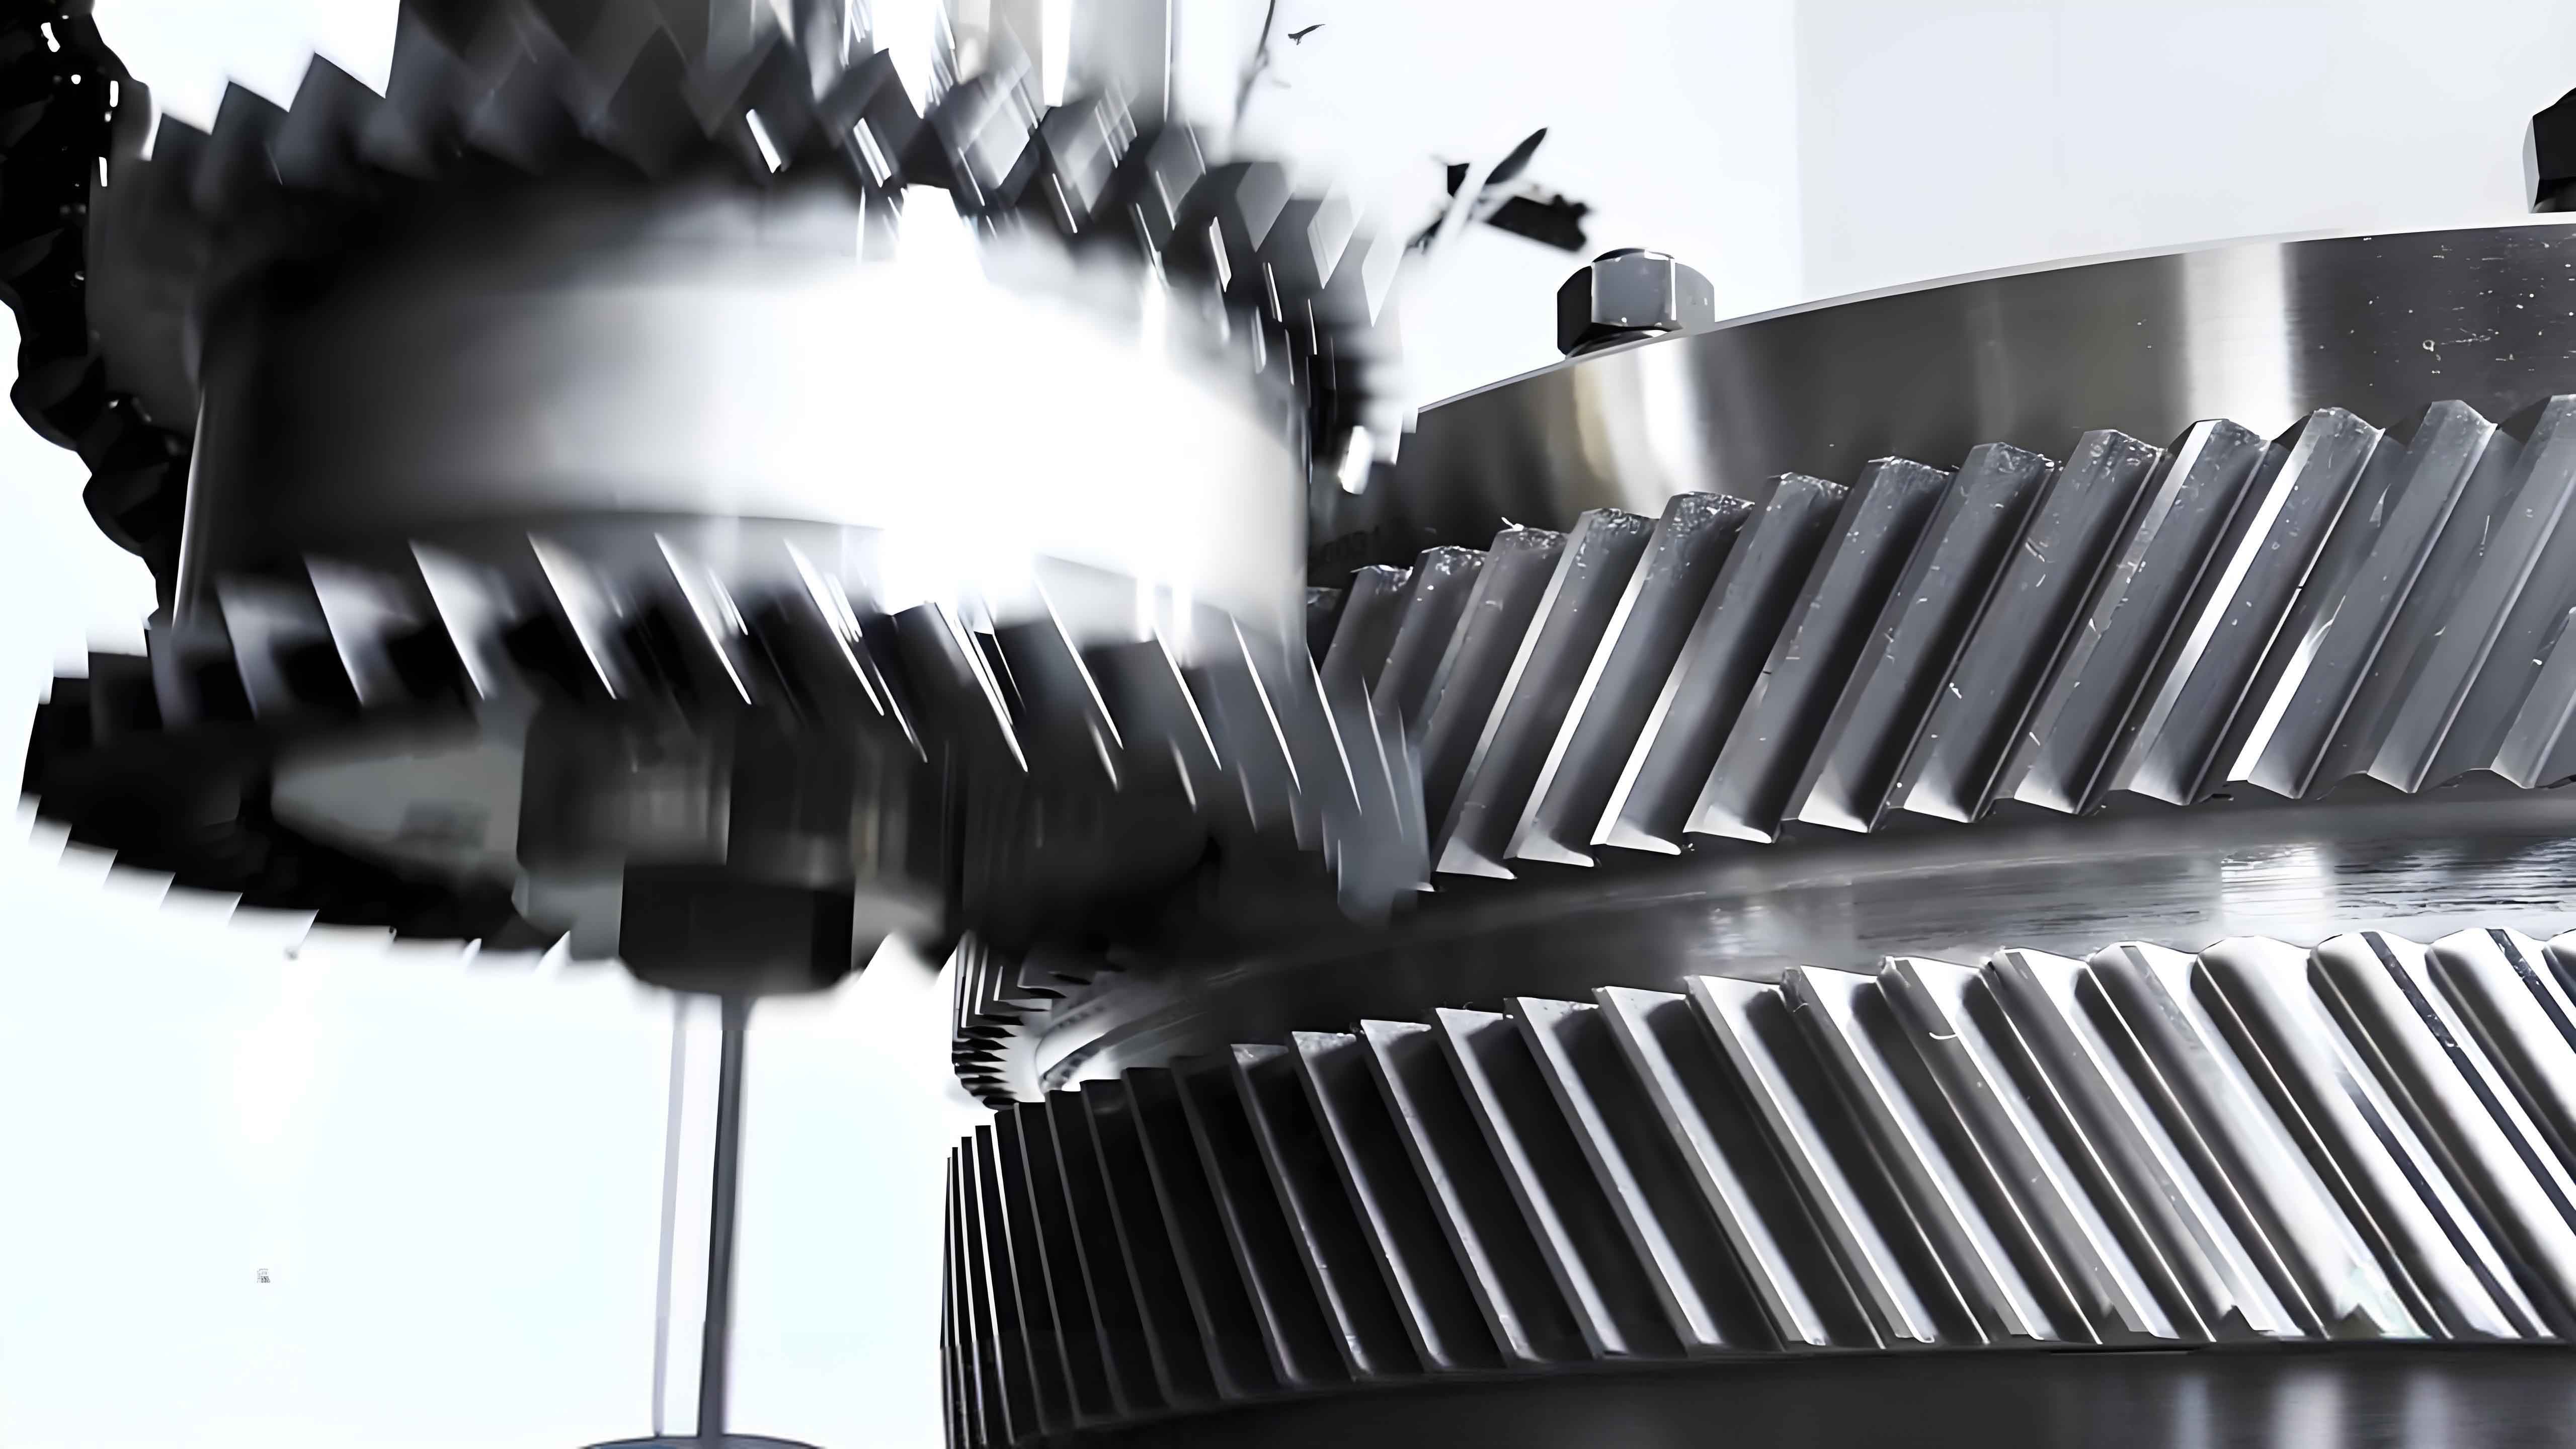
Therefore, a comprehensive understanding and quantification of how specific clamping pose errors affect the key accuracy parameters of a milled herringbone gear are paramount. This knowledge forms the foundation for effective error identification, compensation strategies, and ultimately, the enhancement of machining precision. This article presents a detailed investigation into this subject. A mathematical model for herringbone gear flank milling, incorporating clamping pose errors, is developed. Subsequently, this model is employed to systematically analyze the sensitivity of gear accuracy metrics—specifically profile error, lead error, and pitch error—to individual and coupled clamping errors. The findings are validated through practical milling experiments.
Mathematical Modeling and Error Evaluation Framework
1.1 Fundamentals of Herringbone Gear Milling and Accuracy Assessment
The milling of herringbone gear teeth on a multi-axis CNC machine involves the synchronized movement of several axes. A standard end mill (or a form cutter) performs the cutting action. One typical kinematic configuration involves linear axes for positioning (e.g., X, Y, Z) and a rotary axis (C) for workpiece indexing. The cutter rotates about its own axis (S_p) while simultaneously undergoing a reciprocating motion along the gear’s axial direction (e.g., Z-axis). The workpiece, mounted on the C-axis, rotates in a coordinated, intermittent manner with the cutter’s strokes. The combined motion causes the cutter’s side cutting edges to envelop the desired double-helical tooth surface. Essentially, the tool sweeps out a helical path relative to the workpiece, generating the left-hand and right-hand helices of the herringbone gear.
To assess the impact of errors, a precise method for quantifying deviations between the theoretical (ideal) tooth surface and the actual machined surface is required. The international standard ISO 1328-1 provides the definitive guidelines for evaluating cylindrical gear accuracy. For a herringbone gear, evaluations are typically performed on transverse sections. The key accuracy parameters include:
Profile Error: Deviation of the actual tooth profile from the theoretical involute.
- Profile Form Deviation $(f_{f\alpha})$: The distance between two facsimiles of the mean profile line, which are fitted by the least-squares method, encompassing the total profile deviation within the evaluation range.
- Profile Slope Deviation $(f_{H\alpha})$: The distance between two profile lines that are parallel to the mean profile line and which contain the total profile deviation.
- Total Profile Deviation $(F_{\alpha})$: The absolute sum of the greatest positive and greatest negative profile deviation from the mean profile line within the evaluation range.
Lead Error: Deviation of the actual tooth trace (helix) from the theoretical helix line on the reference cylinder.
- Lead Form Deviation $(f_{f\beta})$: Analogous to profile form deviation, but applied to the helix.
- Lead Slope Deviation $(f_{H\beta})$: The angular deviation of the actual helix from the theoretical helix.
- Total Lead Deviation $(F_{\beta})$: The absolute sum of the greatest positive and greatest negative lead deviation from the mean lead line.
Pitch Error: Deviations in the angular spacing between tooth flanks.
- Single Pitch Deviation $(f_{pt})$: The algebraic difference between the actual and theoretical pitch between two adjacent teeth.
- Total Cumulative Pitch Deviation $(F_p)$: The algebraic difference between the greatest and least actual circumferential pitch deviations over a full revolution of the gear.
The theoretical involute profile in a transverse section can be defined parametrically. For a point on the right-hand flank of a right-hand helix (considering one side of the herringbone), the surface equation in the ideal workpiece coordinate system $S_g(O_g-x_gy_gz_g)$ is:
$$
\begin{cases}
x_g = r_b \cos(\sigma_0 + u + \theta) + r_b u \sin(\sigma_0 + u + \theta) \\
y_g = r_b \sin(\sigma_0 + u + \theta) – r_b u \cos(\sigma_0 + u + \theta) \\
z_g = p \theta
\end{cases}
$$
where $r_b$ is the base circle radius, $\sigma_0$ is the half-spacewidth angle on the base circle, $u$ is the involute roll angle parameter, $\theta$ is the parameter related to the helix (proportional to the rotation angle), and $p$ is the helix parameter ($p = r_b / \tan(\beta_b)$, with $\beta_b$ as the base helix angle).
1.2 Modeling of Clamping Pose Errors
In a real machining setup, the gear blank coordinate system $S_g$ is not perfectly aligned with the machine’s nominal workpiece coordinate system $S_c(O_c-x_cy_cz_c)$, which is tied to the CNC rotary table. The misalignment, or clamping pose error, can be described by three translational errors ($\delta_{xg}, \delta_{yg}, \delta_{zg}$) and three rotational errors ($\epsilon_{xg}, \epsilon_{yg}, \epsilon_{zg}$) along and about the x, y, and z axes of $S_c$, respectively. Using homogeneous transformation matrices (HTM), the relationship between a point in the ideal coordinate system $\mathbf{P_c} = [x_c, y_c, z_c, 1]^T$ and its actual location in the gear blank system $\mathbf{P_g} = [x_g, y_g, z_g, 1]^T$ is:
$$
\mathbf{P_g} = \mathbf{T_{gc}} \cdot \mathbf{P_c}
$$
The transformation matrix $\mathbf{T_{gc}}$ is constructed from sequential rotations and translations. For small error magnitudes, approximations $\sin(\epsilon) \approx \epsilon$ and $\cos(\epsilon) \approx 1$ can be applied. Furthermore, certain errors can be simplified based on the context of herringbone gear clamping. A rotation about the z-axis ($\epsilon_{zg}$) and a translation along z ($\delta_{zg}$) primarily affect the initial axial and angular phasing of the part but do not fundamentally distort the generated tooth surface geometry relative to the gear’s own axis. Therefore, they can be neglected for surface accuracy analysis. A common and significant clamping error is an eccentricity $e$ of the gear blank’s axis relative to the C-axis. This can be modeled as translational errors in the x and y directions that vary with the rotation angle $\varphi$ of the workpiece: $\delta_{xg}=e\sin(\varphi)$ and $\delta_{yg}=e\cos(\varphi)$. An angular tilt error, most critically about the y-axis ($\epsilon_{yg}$), is also considered. Assuming no roll error ($\epsilon_{xg}=0$), the simplified error transformation matrix becomes:
$$
\mathbf{T_{gc}} =
\begin{bmatrix}
1 & 0 & \epsilon_{yg} & e\sin(\varphi) \\
0 & 1 & 0 & e\cos(\varphi) \\
-\epsilon_{yg} & 0 & 1 & 0 \\
0 & 0 & 0 & 1
\end{bmatrix}
$$
Thus, the coordinates of a point on the actual machined tooth surface, accounting for clamping pose errors, are derived from the ideal surface coordinates $\mathbf{P_c^{ideal}} = [x_c, y_c, z_c, 1]^T$ as follows:
$$
\mathbf{P_g^{actual}} = \mathbf{T_{gc}} \cdot \mathbf{P_c^{ideal}} = \begin{bmatrix}
x_c + \epsilon_{yg} z_c + e\sin(\varphi) \\
y_c + e\cos(\varphi) \\
-\epsilon_{yg} x_c + z_c \\
1
\end{bmatrix}
$$
This equation forms the core model for simulating the herringbone gear tooth surface under the influence of clamping eccentricity $e$ and tilt $\epsilon_{yg}$. The parameter $\varphi$ links the error to the workpiece’s angular position during machining.
Sensitivity Analysis of Gear Accuracy to Clamping Errors
Using the developed mathematical model, a detailed numerical sensitivity analysis was conducted. A specific herringbone gear design was used as a case study with the following parameters:
• Number of Teeth $(z)$: 78
• Normal Module $(m_n)$: 12 mm
• Normal Pressure Angle $(\alpha_n)$: 20°
• Helix Angle $(\beta)$: 30° (Right and Left hand)
• Facewidth $(b)$: 200 mm
• Reference Diameter: $d = m_n z / \cos(\beta) \approx 1082.5$ mm
The analysis investigated three scenarios: 1) Pure eccentricity error ($e=0.05$ mm, $\epsilon_{yg}=0$°), 2) Pure tilt error ($e=0$ mm, $\epsilon_{yg}=0.05$°), and 3) Coupled errors ($e=0.05$ mm, $\epsilon_{yg}=0.05$°). The evaluation of profile, lead, and pitch errors was performed computationally according to ISO 1328-1 principles on the simulated point clouds of the generated tooth surfaces.
2.1 Influence on Profile Error
The profile error was evaluated on multiple teeth across the gear circumference. The results indicate that both profile slope deviation $(f_{H\alpha})$ and profile form deviation $(f_{f\alpha})$ exhibit very low sensitivity to clamping pose errors.
| Error Scenario | Profile Slope Dev. $f_{H\alpha}$ (mm) | Profile Form Dev. $f_{f\alpha}$ (mm) | Sensitivity |
|---|---|---|---|
| Pure Eccentricity $(e=0.05mm)$ | ~0.007 | ~0.00014 | Very Low |
| Pure Tilt $(\epsilon_{yg}=0.05°)$ | ~0.0123 | ~0.000313 | Very Low |
| Coupled Errors | ~0.0193 | ~0.000453 | Linear Superposition |
The values of $f_{H\alpha}$ and $f_{f\alpha}$ are orders of magnitude smaller than the input errors themselves. This is because the involute profile in a given transverse section is primarily defined by the relative tool-workpiece motion in that plane. Small eccentricities and tilts cause a nearly rigid-body displacement/rotation of the entire profile in that section, which has a minimal effect on the intrinsic shape and slope of the involute curve when evaluated from its own base circle. The effect of coupled errors closely approximates the linear sum of the effects from individual errors.
2.2 Influence on Lead Error
The lead error analysis reveals a markedly different sensitivity pattern. While the lead form deviation $(f_{f\beta})$ remains largely insensitive, the lead slope deviation $(f_{H\beta})$ shows a very high sensitivity to the angular tilt error $\epsilon_{yg}$.
| Error Scenario | Lead Slope Dev. $f_{H\beta}$ (mm) | Lead Form Dev. $f_{f\beta}$ (mm) | Sensitivity |
|---|---|---|---|
| Pure Eccentricity $(e=0.05mm)$ | ~0.0051 | ~0.000081 | Low |
| Pure Tilt $(\epsilon_{yg}=0.05°)$ | ~0.0829 | ~0.00313 | Very High (for $f_{H\beta}$) |
| Coupled Errors | ~0.0880 | ~0.00321 | Linear Superposition |
The physical explanation is intuitive. An eccentricity $e$ slightly shifts the helical path but does not change its nominal helix angle significantly across the facewidth. In contrast, a tilt error $\epsilon_{yg}$ directly rotates the axis of the gear blank relative to the direction of the tool’s axial (Z) feed motion. This introduces a systematic twist along the tooth trace, causing a pronounced and consistent slope error in the lead. A tilt of 0.05° (approximately 0.00087 rad) over a 200 mm facewidth can theoretically cause a lead deviation on the order of $200 \times \tan(0.05°) \approx 0.175$ mm, which aligns with the magnitude observed in the simulation. The value $f_{H\beta} \approx 0.0829$ mm from the simulation confirms this high sensitivity. The coupling effect is again approximately linear.
2.3 Influence on Pitch Error
Pitch error analysis shows that the single pitch deviation $(f_{pt})$ is relatively insensitive, but the total cumulative pitch deviation $(F_p)$ is highly sensitive to both eccentricity and tilt errors.
| Error Scenario | Single Pitch Dev. $f_{pt}$ (mm) | Total Cumulative Pitch Dev. $F_p$ (mm) | Sensitivity |
|---|---|---|---|
| Pure Eccentricity $(e=0.05mm)$ | ~0.004 | ~0.100 | High (for $F_p$), $F_p \approx 2e$ |
| Pure Tilt $(\epsilon_{yg}=0.05°)$ | ~0.007 | ~0.127 | High (for $F_p$) |
| Coupled Errors | ~0.011 | ~0.227 | Linear Superposition |
The relationship $F_p \approx 2e$ for pure eccentricity is a key finding. This is a classical result in gear metrology: a radial runout (eccentricity) of the gear during manufacturing or measurement directly translates into a peak-to-peak cumulative pitch error of twice the eccentricity value. The tilt error also induces a significant $F_p$ because it effectively creates a varying eccentricity condition as the measurement plane moves along the gear axis, combined with the helical twist, leading to a non-uniform angular distribution of teeth. The single pitch deviation $f_{pt}$, being a local measure between adjacent teeth, is less affected by these low-order, systematic error components. The coupled error effect on $F_p$ is nearly the sum of the individual contributions.
Experimental Validation
To validate the theoretical findings, a practical herringbone gear milling experiment was conducted on a multi-axis CNC machining center. A gear blank with the specified parameters was intentionally mounted with controlled clamping pose errors ($e \approx 0.05$ mm, $\epsilon_{yg} \approx 0.05$°). After milling, the gear was inspected on a high-precision coordinate measuring machine (CMM). Key accuracy parameters, specifically lead slope deviation $(f_{H\beta})$ and total cumulative pitch deviation $(F_p)$, were measured on several teeth from both the upper and lower helices.
Results with Intentional Errors:
The measured $f_{H\beta}$ values corresponded to an accuracy grade of ISO 8 (values around 27-33 μm), confirming the high sensitivity to tilt error.
The measured $F_p$ values were approximately 144 μm for one flank and 174 μm for the opposite flank, aligning well with the predicted range of 0.1 to 0.227 mm from the simulation for the coupled error condition. The sign and magnitude variation between flanks were consistent with the model’s prediction of error phase.
Results after Error Correction:
The clamping setup was then meticulously adjusted to minimize eccentricity and tilt. The same gear was re-machined and measured.
The $f_{H\beta}$ improved to ISO grade 6 (around 17-18 μm).
The $F_p$ improved significantly to ISO grade 4-5 (34-48 μm).
This experimental improvement of 2 to 4 accuracy grades upon correcting the clamping pose errors provides strong, empirical confirmation of the analysis. The trends and relative magnitudes of error reduction matched the theoretical sensitivity analysis, validating the model and the identified critical error sources.
Conclusion
The systematic investigation into the impact of herringbone gear clamping pose errors on milling accuracy leads to the following key conclusions:
- Differential Sensitivity: Different gear accuracy parameters exhibit vastly different sensitivities to clamping errors. Profile errors $(f_{f\alpha}, f_{H\alpha})$ are largely insensitive. Lead slope error $(f_{H\beta})$ is extremely sensitive to angular tilt errors $(\epsilon_{yg})$ but less so to eccentricity $(e)$. Pitch errors show a high sensitivity in their cumulative form $(F_p)$ to both eccentricity and tilt, with $F_p \approx 2e$ for pure eccentricity, while single pitch error $(f_{pt})$ is less affected.
- Mechanisms: Eccentricity primarily induces a first-order radial runout error, directly manifesting as cumulative pitch error. Angular tilt introduces a twist along the tooth trace, causing significant lead slope deviation and contributing to complex cumulative pitch errors.
- Superposition Principle: Under the small-error assumption, the effects of multiple clamping pose errors (e.g., eccentricity and tilt) on the evaluated accuracy parameters can be reasonably approximated by the linear superposition of their individual effects.
- Critical Control Parameters: For high-precision milling of herringbone gears, meticulous control over the angular alignment (tilt) of the gear blank is paramount to control lead accuracy. Simultaneously, precise centering (minimizing eccentricity) is crucial to control cumulative pitch accuracy. These are the identified sensitive error elements in the clamping process.
The methodology combining mathematical modeling based on kinematic transformations and flank milling theory with systematic sensitivity analysis provides a powerful tool for error budgeting and process optimization. The findings underscore that beyond the machine tool’s intrinsic geometric accuracy, the fixture and setup strategy for the herringbone gear workpiece itself is a critical determinant of final quality. Implementing rigorous procedures to measure and correct clamping eccentricity and tilt before and during production can lead to substantial gains in the accuracy class of milled herringbone gears, thereby enhancing their performance and reliability in demanding applications.