
In the realm of mechanical engineering, helical gears play a pivotal role in transmitting power and motion across various machinery, from automotive transmissions to industrial equipment. Their helical tooth design offers smoother and quieter operation compared to spur gears, but this complexity also introduces challenges in stress distribution and fatigue resistance. As a researcher focused on fracture mechanics, I have embarked on a detailed study to analyze the behavior of cracks in helical gears, specifically examining stress intensity factors (SIFs) and the J-integral under different initial crack parameters. This work aims to provide insights into crack initiation and propagation, which are critical for predicting fatigue life and ensuring the reliability of gear systems. The importance of helical gears cannot be overstated; they are integral components in many mechanical assemblies, and their failure due to cracks can lead to catastrophic breakdowns. Thus, understanding fracture parameters in helical gears is essential for advancing durability assessments.
Fatigue fracture is a predominant failure mode in gears, often originating at stress concentration regions like the tooth root. Over the years, fracture mechanics has emerged as a powerful tool to quantify crack behavior, with stress intensity factors and the J-integral serving as key parameters. Stress intensity factors, denoted as KI, KII, and KIII, correspond to three fundamental crack modes: opening (Mode I), sliding (Mode II), and tearing (Mode III). Among these, Mode I is typically the most critical for low-stress brittle fractures. The J-integral, on the other hand, provides an energy-based approach to characterize crack-tip fields, especially in elastic-plastic materials. In this study, I leverage finite element software to simulate three-dimensional cracks in helical gears and compute these fracture parameters. By varying initial crack conditions—such as load, length, and position—I seek to uncover patterns that can inform design and maintenance strategies for helical gears.
The foundation of this analysis lies in fracture mechanics theory. For a three-dimensional crack front, the displacement fields near the crack tip can be used to derive stress intensity factors. In a local coordinate system defined by the normal (n), binormal (b), and tangent (τ) directions at the crack front, the SIFs are expressed as:
$$ K_I = \frac{E}{8(1 – \mu^2)} \sqrt{\frac{2\pi}{r}} \lim_{r \to 0} \left[ u_c^2(\theta = +\pi) – u_c^2(\theta = -\pi) \right] $$
$$ K_{II} = \frac{E}{8(1 – \mu^2)} \sqrt{\frac{2\pi}{r}} \lim_{r \to 0} \left[ u_c^1(\theta = +\pi) – u_c^1(\theta = -\pi) \right] $$
$$ K_{III} = \frac{E}{8(1 – \mu)} \sqrt{\frac{2\pi}{r}} \lim_{r \to 0} \left[ u_c^3(\theta = +\pi) – u_c^3(\theta = -\pi) \right] $$
Here, \(E\) is Young’s modulus, \(\mu\) is Poisson’s ratio, \(r\) is the distance from the crack tip, and \(u_c^1, u_c^2, u_c^3\) represent displacements in the b, n, and τ directions, respectively. These equations highlight how crack-tip displacements govern the stress intensity, which in turn influences crack propagation. For fatigue life prediction, the stress intensity factor range \(\Delta K\) is crucial. It is defined based on the maximum and minimum SIFs during loading cycles:
$$ R = \frac{K_{\text{min}}}{K_{\text{max}}} $$
$$ \Delta K = \begin{cases} K_{\text{max}} – K_{\text{min}} & \text{if } R \geq 0 \\ K_{\text{max}} & \text{if } R < 0 \end{cases} $$
Crack growth occurs only when \(\Delta K\) exceeds a threshold \(\Delta K_{\text{th}}\). The number of cycles to failure, \(N\), can be estimated using Paris’ law:
$$ N = \int_{a_0}^{a_c} \frac{da}{C (\Delta K)^n} $$
where \(a_0\) is the initial crack size, \(a_c\) is the critical crack size, and \(C\) and \(n\) are material constants. This formula underscores the importance of accurately determining SIFs for life assessment in helical gears.
The J-integral offers an alternative perspective by evaluating the energy release rate. For a three-dimensional crack, it is defined as a path-independent integral around the crack tip. Its value, denoted as \(J\), correlates with the stress intensity factors in linear elastic conditions via:
$$ J = \frac{K_I^2}{E’} + \frac{K_{II}^2}{E’} + \frac{K_{III}^2}{2\mu} $$
where \(E’ = E\) for plane stress and \(E’ = E/(1-\mu^2)\) for plane strain. In elastic-plastic regimes, \(J\) serves as a fracture criterion, with a critical value \(J_c\) indicating crack initiation or instability. In my study, I compute both SIFs and \(J\) to gain a comprehensive view of crack behavior in helical gears.
To conduct this analysis, I developed a three-dimensional finite element model of a helical gear pair. The geometric parameters are summarized in Table 1, which ensures accurate meshing and simulation of helical gears. These parameters are typical for industrial applications, and the model includes a small backlash of 0.1 mm to reflect real-world conditions.
| Parameter | Driving Gear | Driven Gear |
|---|---|---|
| Number of Teeth, \(z\) | 30 | 30 |
| Normal Module, \(m_n\) (mm) | 2 | 2 |
| Pressure Angle, \(\alpha\) (°) | 20 | 20 |
| Helix Angle, \(\beta\) (°) | 8 | -8 |
| Face Width, \(b\) (mm) | 20 | 20 |
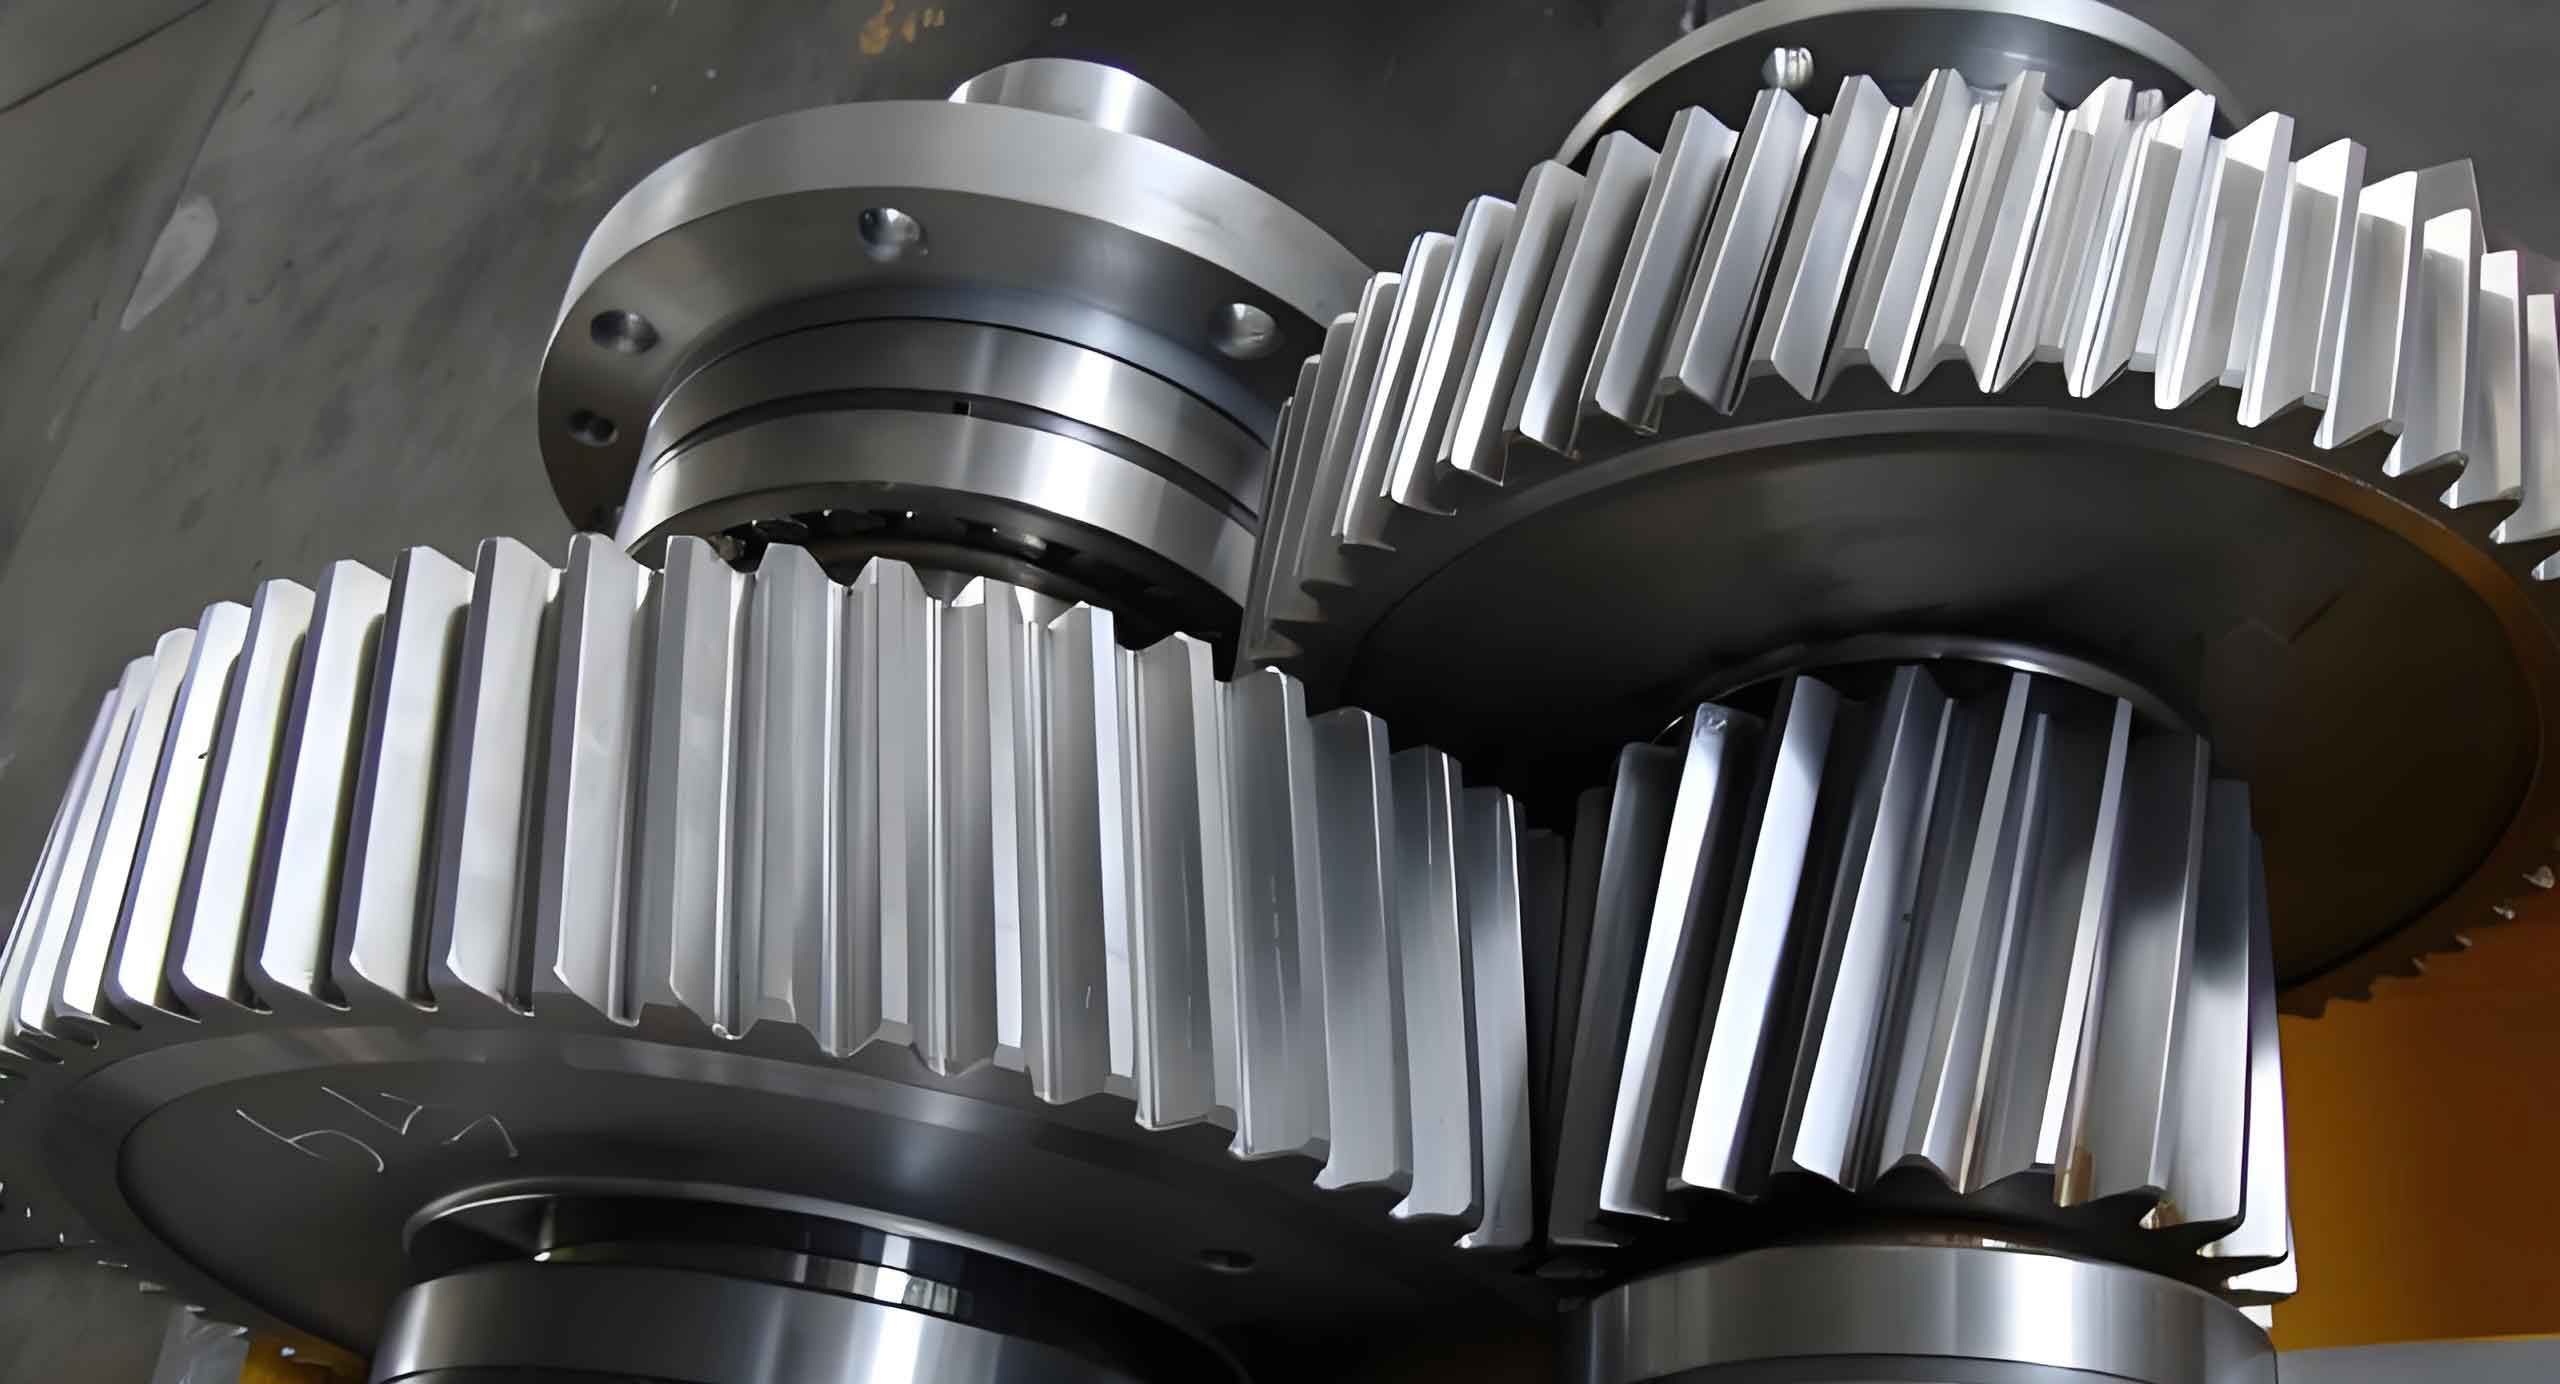
The material selected for the helical gears is 17CrNiMo6, a common alloy steel with good fatigue resistance. After constructing the gear model, I introduced a semi-elliptical initial crack at the tooth root—a common site for crack initiation in helical gears due to high stress concentrations. The crack is defined in a local coordinate system: the X-axis aligns with the crack propagation direction, the Y-axis is normal to the crack front, and the Z-axis is parallel to the crack front. This setup allows for precise control over crack parameters. The finite element mesh was refined around the crack tip to ensure accurate computation of fracture parameters, as shown in the image link provided earlier, which depicts a typical helical gear mesh.
In my simulations, I varied three key initial crack parameters: applied load, crack length, and crack position along the tooth root. For each case, I computed the stress intensity factors \(K_I\), \(K_{II}\), and \(K_{III}\), as well as the J-integral along the crack front. To facilitate comparison, the crack front length was normalized from 0 to 1. The results are presented below through tables and formulas to summarize the trends.
First, I investigated the effect of load on fracture parameters. Torques of 500 N·m, 750 N·m, 1000 N·m, 1250 N·m, and 1500 N·m were applied to the driving gear while keeping the crack dimensions constant (semi-axes of 1 mm each). The computed SIFs and J-integral values are summarized in Table 2, which shows average values along the crack front for brevity. However, the full distribution curves reveal more nuanced behavior.
| Torque (N·m) | \(K_I\) (MPa√m) | \(K_{II}\) (MPa√m) | \(K_{III}\) (MPa√m) | \(J\) (kJ/m²) |
|---|---|---|---|---|
| 500 | 15.2 | 1.8 | 0.9 | 0.45 |
| 750 | 22.8 | 2.7 | 1.35 | 1.01 |
| 1000 | 30.4 | 3.6 | 1.8 | 1.80 |
| 1250 | 38.0 | 4.5 | 2.25 | 2.81 |
| 1500 | 45.6 | 5.4 | 2.7 | 4.05 |
From the data, it is evident that all fracture parameters increase linearly with load, which can be approximated by:
$$ K_I = 0.0304 \times T, \quad K_{II} = 0.0036 \times T, \quad K_{III} = 0.0018 \times T, \quad J = 0.0009 \times T^2 $$
where \(T\) is the torque in N·m. This quadratic relationship for \(J\) aligns with theory, as \(J\) is proportional to the square of SIFs. The distribution curves show that \(K_I\) and \(J\) exhibit a parabolic shape along the crack front, with higher values at the ends and lower in the middle. This pattern is consistent across loads, but the curves become steeper as load increases. Importantly, \(K_I\) dominates over \(K_{II}\) and \(K_{III}\), underscoring the prevalence of Mode I cracking in helical gears under tensile stresses. However, the contributions of Modes II and III cannot be ignored, especially in complex loading scenarios inherent to helical gears.
Next, I examined the influence of crack length. I varied the semi-elliptical crack’s major axis length from 0.5 mm to 1.25 mm while maintaining a constant depth of 1 mm and a torque of 500 N·m. The results are condensed in Table 3, which presents peak values along the crack front for each SIF and \(J\).
| Crack Length (mm) | Peak \(K_I\) (MPa√m) | Peak \(K_{II}\) (MPa√m) | Peak \(K_{III}\) (MPa√m) | Peak \(J\) (kJ/m²) |
|---|---|---|---|---|
| 0.5 | 12.5 | 1.2 | 1.0 | 0.31 |
| 0.75 | 14.3 | 1.5 | 0.95 | 0.40 |
| 1.0 | 15.2 | 1.8 | 0.9 | 0.45 |
| 1.25 | 16.8 | 2.1 | 0.85 | 0.55 |
The trends indicate that as crack length increases, \(K_I\) and \(K_{II}\) generally rise, particularly in the mid-region of the crack front, while \(K_{III}\) shows a slight decrease in the mid-region but increases at the ends. This behavior can be modeled with empirical formulas:
$$ K_I \approx 10.5 + 5.0 \times L, \quad K_{II} \approx 0.6 + 1.2 \times L, \quad K_{III} \approx 1.1 – 0.2 \times L $$
where \(L\) is the crack length in mm. The J-integral follows a similar trend to \(K_I\), increasing with length and maintaining a parabolic distribution. This suggests that longer cracks in helical gears lead to higher energy release rates, accelerating fatigue crack growth. The curves flatten in the middle as length grows, implying more uniform stress intensity along the crack front. These findings are vital for assessing crack propagation risks in helical gears, where initial flaw sizes can dictate service life.
Finally, I explored the effect of crack position along the tooth root of the helical gear. The crack was moved along the Z-axis (aligned with the helix direction) from -6 mm to +6 mm relative to the tooth root center, with fixed dimensions of 1 mm length and depth. The torque was set to 500 N·m. Table 4 summarizes the average fracture parameters for each position, highlighting spatial variations.
| Position (mm) | \(K_I\) (MPa√m) | \(K_{II}\) (MPa√m) | \(K_{III}\) (MPa√m) | \(J\) (kJ/m²) |
|---|---|---|---|---|
| -6 | 18.5 | 3.0 | 1.5 | 0.68 |
| -4 | 17.2 | 2.5 | 1.3 | 0.59 |
| -2 | 16.0 | 2.0 | 1.1 | 0.51 |
| 0 | 15.2 | 1.8 | 0.9 | 0.45 |
| 2 | 15.1 | 2.2 | 0.7 | 0.44 |
| 4 | 15.0 | 2.6 | 0.5 | 0.43 |
| 6 | 14.9 | 3.0 | 0.3 | 0.42 |
Analysis reveals that as the crack moves in the negative Z-direction (toward one end of the helical gear tooth), \(K_I\) increases significantly, while in the positive direction, it remains relatively stable. This asymmetry stems from the helical geometry, which induces non-uniform stress fields. For \(K_{II}\) and \(K_{III}\), the trends are more complex: \(K_{II}\) increases in both directions but more sharply in the positive, whereas \(K_{III}\) decreases in the positive direction and increases in the negative. These relationships can be approximated by piecewise functions:
$$ K_I = \begin{cases} 15.2 + 0.55 |z| & \text{for } z < 0 \\ 15.2 – 0.05 |z| & \text{for } z \geq 0 \end{cases} $$
$$ K_{II} = 1.8 + 0.2 |z|, \quad K_{III} = 0.9 – 0.1 z $$
where \(z\) is the position in mm. The J-integral mirrors \(K_I\), showing higher values at negative positions and minimal change at positive ones. The distribution curves maintain a parabolic shape, but the peaks shift depending on position. This underscores that crack location in helical gears profoundly affects fracture parameters, with certain regions being more prone to crack growth. In practical terms, this means that inspections of helical gears should focus on areas with higher stress intensity, such as the negative flank regions in this model.
Throughout this study, the repeated emphasis on helical gears is intentional, as their unique design—characterized by angled teeth—introduces complex three-dimensional stress states that differ from spur gears. This complexity makes fracture analysis more challenging but also more critical for ensuring reliability. The finite element approach adopted here allows for detailed simulation of these effects, providing data that can feed into fatigue life predictions. For instance, using the computed SIFs, one can estimate \(\Delta K\) and apply Paris’ law to predict cycles to failure. Given the trends observed, designers of helical gears might consider reinforcing tooth roots or optimizing helix angles to mitigate crack risks.
In conclusion, my investigation into three-dimensional cracks in helical gears has yielded several key insights. First, stress intensity factor \(K_I\) dominates the fracture behavior, but \(K_{II}\) and \(K_{III}\) contribute notably, especially under varying crack positions. Second, the J-integral closely follows \(K_I\) trends, offering an energy-based confirmation of the stress intensity patterns. Third, parameters like load, crack length, and position all significantly influence fracture metrics, with empirical formulas derived to quantify these relationships. These findings enhance our understanding of crack dynamics in helical gears and provide a foundation for more accurate fatigue life assessments. Future work could extend this analysis to dynamic loading conditions or incorporate material plasticity for a more comprehensive view. Ultimately, this research underscores the importance of fracture mechanics in maintaining the integrity of helical gears, which are indispensable components in modern machinery.